WHO'S PRINTING PIPS AND CASH? AUDJPY SHORT FORECAST Q2 W21 Y25WHO'S PRINTING PIPS AND CASH? AUDJPY SHORT FORECAST Q2 W21 Y25
Professional Risk Managers👋
Welcome back to another FRGNT chart update📈
Diving into some Forex setups using predominantly higher time frame order blocks alongside confirmation breaks of structure.
Let’s see what price action is telling us today!
💡Here are some trade confluences📝
✅Weekly order block rejection
✅Daily order block rejection
✅HTF 50 EMA acting as support and resistance.
✅Gap to be filled
🔑 Remember, to participate in trading comes always with a degree of risk, therefore as professional risk managers it remains vital that we stick to our risk management plan as well as our trading strategies.
📈The rest, we leave to the balance of probabilities.
💡Fail to plan. Plan to fail.
🏆It has always been that simple.
❤️Good luck with your trading journey, I shall see you at the very top.
🎯Trade consistent, FRGNT X
AUD (Australian Dollar)

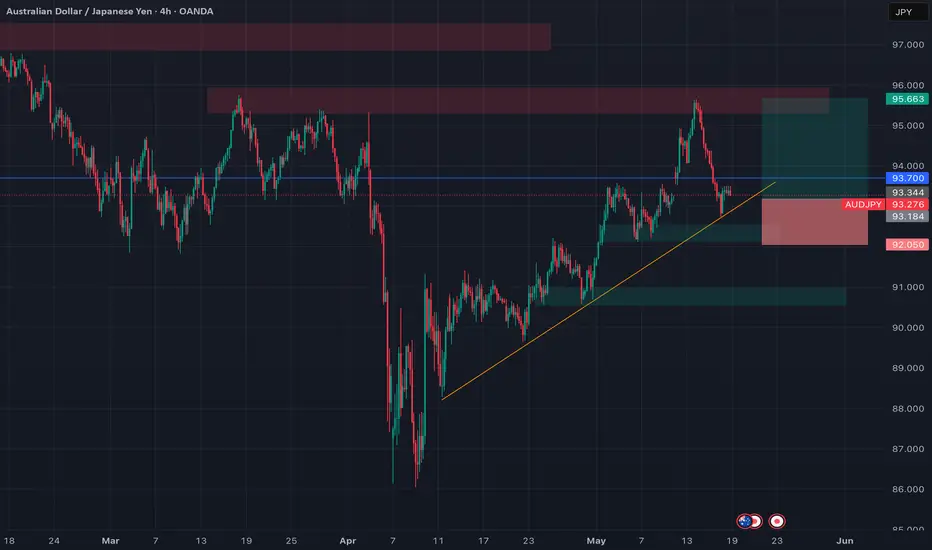
AUDJPY Long: Buy the Dip into Trendline + Seasonal AUD Surge🔹 Pair: AUD/JPY
🔹 Timeframe: 4H
🔹 Direction: Long
🔹 Status: Retesting Trendline Support
🔹 Entry Zone: 93.20–93.40 (Live Entry Area)
⸻
📊 Macro & Fundamental Confluence
🇦🇺 AUD – Bullish
• Strong Seasonality: Historically bullish May 19 – June 10.
• Conditional Score Rise: From 21 → 24 = Positive momentum shift.
• Dovish CB, But Risk-On: Supports carry trade flows into AUD.
• Macro View: Rebalancing inflation & trend recovery, AUD outperforming.
🇯🇵 JPY – Bearish
• BoJ Hawkish Talk, Dovish Action: Delayed inflation targets (to 2027).
• Score Flat: Minor rise (11 → 12), showing underperformance.
• Risk-On Mood: With VIX under 20, safe-haven demand fading.
• Macro Lag: JPY weakest G7 performer year-to-date.
🧠 Confluences Supporting the Trade
✅ Seasonal AUD strength
✅ Fundamental divergence: AUD strong, JPY weak
✅ Risk-on regime (favoring carry trades like AUDJPY)
✅ Trendline respected since April (bullish market structure)
✅ Support zone at 93.00–93.30 area
⸻
📈 Technical Setup
• Entry Zone: 93.20–93.40
• Stop Loss: 92.08 (below structure and ascending trendline)
• Take Profit:
• TP1: 95.40 (resistance zone)
• TP2: 96.00 (supply zone retest)
• Risk:Reward: ~1.8 – 2.2 depending on final entry
📌 Execution Notes
Watching for candle closure confirmation above 93.50.
Break below 92.08 invalidates the bullish bias.
This setup combines macro divergence, seasonal strength, and clean 4H market structure.
⸻
💬 Are you trading AUDJPY this week?
Drop your thoughts below ⬇️
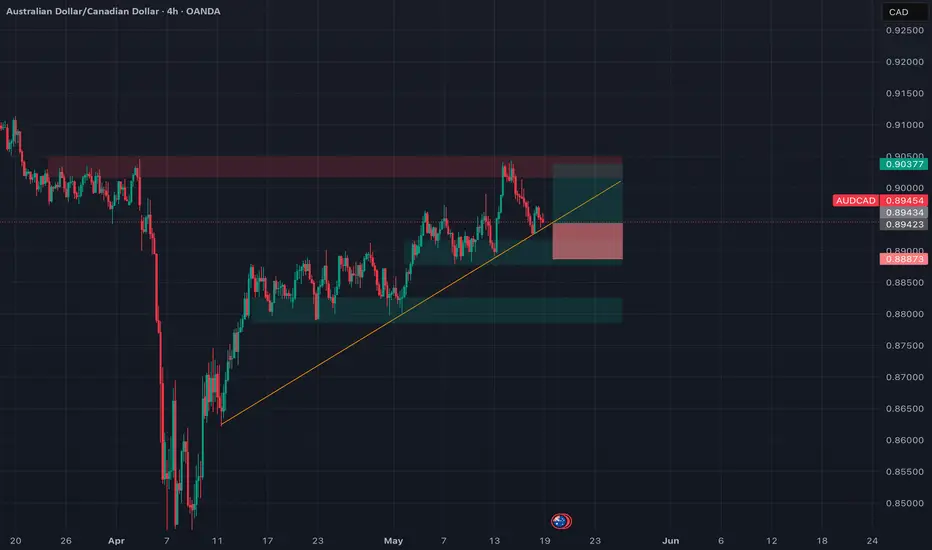
AUDCAD Long: Riding Aussie Strength vs Weak Loonie 🔹 Pair: AUD/CAD
🔹 Timeframe: 4H
🔹 Direction: Long
🔹 Strategy: Trend Continuation + Macro Confluence
🔹 Trade Active: 📍 0.8945 (CMP)
📊 Fundamental Bias
🇦🇺 AUD – Bullish
• Seasonal Surge: Historically strong from May 19 to June 10.
• Conditional Score Gain: AUD rose from 21 → 24 (momentum improving).
• Macro View: Inflation stabilizing, dovish stance offset by improving sentiment.
• VIX < 20: Risk-on conditions favor AUD.
🇨🇦 CAD – Bearish
• Flat Conditional Score: No improvement (2 → 2).
• Hawkish CB but Weak Data: CPI softening, trade risks persist.
• Global Sentiment: Oil stagnation + cautious BoC tone = headwinds for CAD.
⸻
🧠 Confluence Summary
✅ AUD macro + seasonal strength
✅ CAD remains fundamentally weak
✅ Risk-on supports commodity currencies
✅ 4H trendline support holding
⸻
🖼️ Technical Setup
• Entry: 0.8945
• Stop Loss: 0.8890 (below ascending trendline + support zone)
• Take Profit: 0.9036 (prior resistance + TP1)
• Risk:Reward: ~1.67
🟠 Optional Target: 0.9045 for extended move.
📌 Outlook
I’m bullish on AUDCAD for the week of May 19–23, supported by:
• Seasonal patterns
• Risk tone
• CAD stagnation
• Clear trend structure
Will look to trail SL as price closes above 0.8975. Clean invalidation below 0.8890.
⸻
💬 What’s your bias on AUD this week?
Drop a comment & let’s discuss 📉📈
EUR_AUD BULLISH WEDGE|LONG|
✅EUR_AUD made a bullish
Breakout from the bullish
Wedge pattern and the
Breakout is confirmed so
We are bullish biased and
We will be expecting a
Further bullish move up
On Monday when the
Market reopens
LONG🚀
✅Like and subscribe to never miss a new idea!✅
Disclosure: I am part of Trade Nation's Influencer program and receive a monthly fee for using their TradingView charts in my analysis.

GBPAUD Will Collapse! SELL!
My dear friends,
My technical analysis for GBPAUD is below:
The market is trading on 2.0749 pivot level.
Bias - Bearish
Technical Indicators: Both Super Trend & Pivot HL indicate a highly probable Bearish continuation.
Target - 2.0638
Recommended Stop Loss - 2.0826
About Used Indicators:
A pivot point is a technical analysis indicator, or calculations, used to determine the overall trend of the market over different time frames.
Disclosure: I am part of Trade Nation's Influencer program and receive a monthly fee for using their TradingView charts in my analysis.
———————————
WISH YOU ALL LUCK

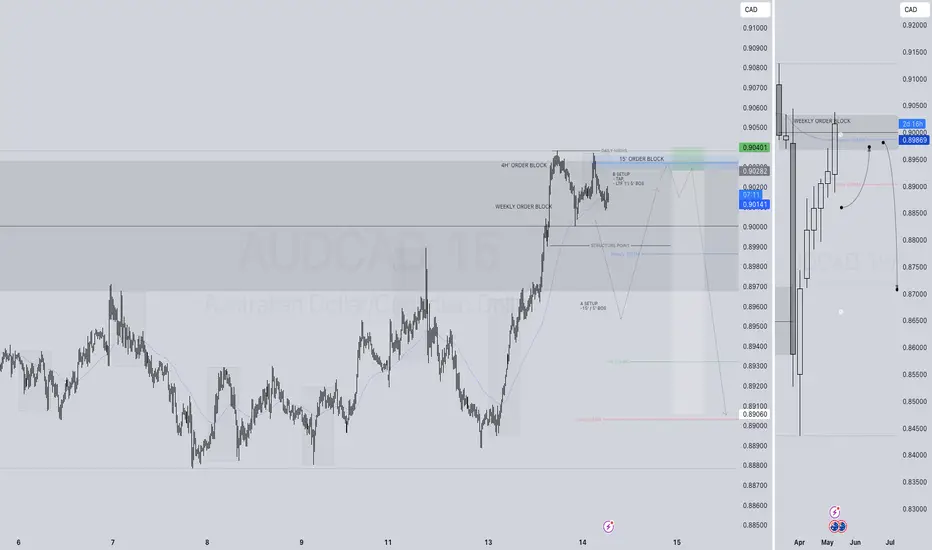
AUDCAD SHORT FORECAST Q2 W21 Y25AUDCAD SHORT FORECAST Q2 W21 Y25
Professional Risk Managers👋
Welcome back to another FRGNT chart update📈
Diving into some Forex setups using predominantly higher time frame order blocks alongside confirmation breaks of structure.
Let’s see what price action is telling us today!
💡Here are some trade confluences📝
✅ Weekly order block
✅Intraday 15 order block
✅Tokyo ranges to be filled
✅ Weekly 50 EMA
🔑 Remember, to participate in trading comes always with a degree of risk, therefore as professional risk managers it remains vital that we stick to our risk management plan as well as our trading strategies.
📈The rest, we leave to the balance of probabilities.
💡Fail to plan. Plan to fail.
🏆It has always been that simple.
❤️Good luck with your trading journey, I shall see you at the very top.
🎯Trade consistent, FRGNT X

AUD/JPY BEARS WILL DOMINATE THE MARKET|SHORT
Hello, Friends!
We are now examining the AUD/JPY pair and we can see that the pair is going up locally while also being in a uptrend on the 1W TF. But there is also a powerful signal from the BB upper band being nearby, indicating that the pair is overbought so we can go short from the resistance line above and a target at 88.446 level.
Disclosure: I am part of Trade Nation's Influencer program and receive a monthly fee for using their TradingView charts in my analysis.
✅LIKE AND COMMENT MY IDEAS✅

EUR/AUD: Rebound or Continuation of the Drop?EUR/AUD is in a critical situation after a strong bearish trend that pushed the price into a key support area. Analyzing the daily chart, we can observe that the price is testing a strong demand zone, highlighted in blue, from which a potential rebound towards the upper supply zone (in red) could emerge.
The retail sentiment confirms strong short pressure, with 82% of traders positioned on the downside. This excess pessimism suggests, from a contrarian perspective, a possible rebound. Additionally, the oscillator indicates an oversold condition, reinforcing the hypothesis of a correction.
From an institutional point of view, the COT data shows a slight reduction in long positions for both EUR and AUD, but with one detail: speculators remain predominantly long on EUR and short on AUD. Meanwhile, hedgers continue to protect themselves against a possible decline in the euro, demonstrating caution.
In terms of seasonality, May has historically been a weak month for both currencies, but in the last two years, EUR has shown a slight recovery, while AUD has demonstrated signs of stability.
Trading Strategy:
Monitor the reaction to the support zone carefully. A bullish signal in this area could pave the way for a rebound towards the upper resistance. However, a bearish breakout would confirm the ongoing downward trend.

EURAUD Next possible moveWe are waiting for our asset to reach our action zone, and based on the reaction, we’ll decide on our next moves.ALWAYS WAIT FOR A CONFIRMATION TO SEE IF THE PRICE VALIDATES THE ZONE.and you what is your vision of the EURUSD its interests me! i wait you in the commentary

Will AUDJPY rebound?FX_IDC:AUDJPY had recently corrected lower, but continues to trade above a broken downside resistance line. Will we see a push back up anytime soon?
Let's dig in...
MARKETSCOM:AUDJPY
Let us know what you think in the comments below.
Thank you.
77.3% of retail investor accounts lose money when trading CFDs with this provider. You should consider whether you understand how CFDs work and whether you can afford to take the high risk of losing your money. Past performance is not necessarily indicative of future results. The value of investments may fall as well as rise and the investor may not get back the amount initially invested. This content is not intended for nor applicable to residents of the UK. Cryptocurrency CFDs and spread bets are restricted in the UK for all retail clients.

EUR-AUD Bullish Breakout! Buy!
Hello,Traders!
EUR-AUD has formed a bullish
Wedge pattern and now we are
Seeing a bullish breakout which
Is confirmed so we are bullish
Biased and we will be expecting
A further bullish move up
Buy!
Comment and subscribe to help us grow!
Check out other forecasts below too!
Disclosure: I am part of Trade Nation's Influencer program and receive a monthly fee for using their TradingView charts in my analysis.

AUDNZD: Growth & Bullish Continuation
The charts are full of distraction, disturbance and are a graveyard of fear and greed which shall not cloud our judgement on the current state of affairs in the AUDNZD pair price action which suggests a high likelihood of a coming move up.
Disclosure: I am part of Trade Nation's Influencer program and receive a monthly fee for using their TradingView charts in my analysis.
❤️ Please, support our work with like & comment! ❤️

AUDJPY Will Go Up From Support! Long!
Please, check our technical outlook for AUDJPY.
Time Frame: 12h
Current Trend: Bullish
Sentiment: Oversold (based on 7-period RSI)
Forecast: Bullish
The market is approaching a key horizontal level 93.383.
Considering the today's price action, probabilities will be high to see a movement to 96.039.
P.S
We determine oversold/overbought condition with RSI indicator.
When it drops below 30 - the market is considered to be oversold.
When it bounces above 70 - the market is considered to be overbought.
Disclosure: I am part of Trade Nation's Influencer program and receive a monthly fee for using their TradingView charts in my analysis.
Like and subscribe and comment my ideas if you enjoy them!

AUDCHF Will Go Higher! Buy!
Here is our detailed technical review for AUDCHF.
Time Frame: 12h
Current Trend: Bullish
Sentiment: Oversold (based on 7-period RSI)
Forecast: Bullish
The market is approaching a significant support area 0.536.
The underlined horizontal cluster clearly indicates a highly probable bullish movement with target 0.548 level.
P.S
Overbought describes a period of time where there has been a significant and consistent upward move in price over a period of time without much pullback.
Disclosure: I am part of Trade Nation's Influencer program and receive a monthly fee for using their TradingView charts in my analysis.
Like and subscribe and comment my ideas if you enjoy them!


GBP/AUD BEST PLACE TO SELL FROM|SHORT
Hello, Friends!
GBP/AUD is trending down which is obvious from the red colour of the previous weekly candle. However, the price has locally surged into the overbought territory. Which can be told from its proximity to the BB upper band. Which presents a great trend following opportunity for a short trade from the resistance line above towards the demand level of 2.047.
Disclosure: I am part of Trade Nation's Influencer program and receive a monthly fee for using their TradingView charts in my analysis.
✅LIKE AND COMMENT MY IDEAS✅

AUDCAD SHORT FORECAST Q2 W20 D15 Y25AUDCAD SHORT FORECAST Q2 W20 D15 Y25
Professional Risk Managers👋
Welcome back to another FRGNT chart update📈
Diving into some Forex setups using predominantly higher time frame order blocks alongside confirmation breaks of structure.
Let’s see what price action is telling us today!
💡Here are some trade confluences📝
✅ Weekly order block
✅Intraday 15 order block
✅Tokyo ranges to be filled
✅ Weekly 50 EMA
🔑 Remember, to participate in trading comes always with a degree of risk, therefore as professional risk managers it remains vital that we stick to our risk management plan as well as our trading strategies.
📈The rest, we leave to the balance of probabilities.
💡Fail to plan. Plan to fail.
🏆It has always been that simple.
❤️Good luck with your trading journey, I shall see you at the very top.
🎯Trade consistent, FRGNT X

AUDCAD SHORT FORECAST Q2 W20 D14 Y25AUDCAD SHORT FORECAST Q2 W20 D14 Y25
Professional Risk Managers👋
Welcome back to another FRGNT chart update📈
Diving into some Forex setups using predominantly higher time frame order blocks alongside confirmation breaks of structure.
Let’s see what price action is telling us today!
💡Here are some trade confluences📝
✅ Weekly order block
✅Intraday 15 order block
✅Tokyo ranges to be filled
✅ Trade towards the 50 EMA's on all time frames
🔑 Remember, to participate in trading comes always with a degree of risk, therefore as professional risk managers it remains vital that we stick to our risk management plan as well as our trading strategies.
📈The rest, we leave to the balance of probabilities.
💡Fail to plan. Plan to fail.
🏆It has always been that simple.
❤️Good luck with your trading journey, I shall see you at the very top.
🎯Trade consistent, FRGNT X
AUDJPY buy/longBy utilizing Fibonacci retracement levels, historical patterns, , we can formulate a hypothesis that the market might follow a similar trajectory if bullish sentiment prevails.

AUD/CHF - Trendline Breakout (15.05.2025)The AUD/CHF Pair on the M30 timeframe presents a Potential Selling Opportunity due to a recent Formation of a Trendline Breakout Pattern. This suggests a shift in momentum towards the downside in the coming hours.
Possible Short Trade:
Entry: Consider Entering A Short Position around Trendline Of The Pattern.
Target Levels:
1st Support – 0.5338
2nd Support – 0.5308
🎁 Please hit the like button and
🎁 Leave a comment to support for My Post !
Your likes and comments are incredibly motivating and will encourage me to share more analysis with you.
Best Regards, KABHI_TA_TRADING
Thank you.

AUDCAD: Will Keep Growing! Here is Why:
Our strategy, polished by years of trial and error has helped us identify what seems to be a great trading opportunity and we are here to share it with you as the time is ripe for us to buy AUDCAD.
Disclosure: I am part of Trade Nation's Influencer program and receive a monthly fee for using their TradingView charts in my analysis.
❤️ Please, support our work with like & comment! ❤️

AUD_NZD STRONG RESISTANCE AEHAD|SHORT|
✅AUD_NZD is going up now
But a strong resistance level is ahead around 1.0940
Thus I am expecting a pullback
And a move down towards the target of 1.0880
SHORT🔥
✅Like and subscribe to never miss a new idea!✅
Disclosure: I am part of Trade Nation's Influencer program and receive a monthly fee for using their TradingView charts in my analysis.

Steal the Show: AUD/CAD Bullish Bank Run!🌍 Greetings, Wealth Warriors & Market Mavericks! 👋😎💸
Hey there, global traders! Ready to crack the vault on the AUD/CAD "Aussie-Loonie" Forex Heist? 🏦💰 Based on our slick *Thief Trading System* blending technical precision and fundamental vibes, here’s the ultimate plan to snag profits. Follow the chart’s long-entry blueprint and aim to cash out near the high-stakes Red Zone—a wild spot where overbought signals, consolidation, and bearish traps lurk. 💪🎯 Stay sharp, grab your loot, and treat yourself—you’ve earned it! 🍾🚀
🔑 Entry 1: “The vault’s open! Spot the MA breakout at 0.90500 and dive in—bullish riches are calling!”
Pro move: Set buy stop orders above the Moving Average or buy limit orders at the latest 15/30-min swing low/high for pullback action. 📊 Add a chart alert to catch the breakout wave! 🌊
🔑 Entry 2: “The heist is on! Stalk the MA pullback in the Market Maker’s Trick Zone at 0.89200, then strike—fortune loves the fearless!”
🛑 Stop Loss: “Listen up, crew! 🗣️ For buy stop orders, hold off on setting that stop loss until the breakout kicks in. 🚀 Place it at the spot I’ve marked 📍, or go rogue at your own risk—don’t blame me if the market bites! 😜 Your trade, your rules, your fire. 🔥”
📍 Thief SL set at the nearest swing low on the 4H timeframe for swing trades.
📍 Size your SL based on your risk, lot size, and number of orders.
🎯 Target: 0.91500—or make a smooth exit near the target zone. 🏴☠️
👀 Scalpers, heads up: Stick to long-side scalps. Got deep pockets? Jump in now! Otherwise, team up with swing traders for the grand heist. Use trailing SL to lock in your cash. 💰🔒
📡 Why’s AUD/CAD hot? The "Aussie-Loonie" is riding a bullish surge, fueled by key drivers. 📰 Dive into fundamentals, COT reports, sentiment analysis, intermarket trends, and future projections. Check the linkss for fundamentals, macro trends and market outlooks for the full scoop! 🔗🌐
⚠️ Trading Alert: News Flash & Position Safety 🗞️🚨
News drops can shake the market like a storm. 🌪️ To protect your trades:
- Skip new entries during news releases. 🚫
- Use trailing stop-loss orders to secure profits and shield your positions. ✅
💥 Boost Our Heist! 💪 Hit that Boost Button to supercharge our Thief Trading squad. 💸 Crush the market daily with our slick strategies. Together, we’ll stack profits with ease! 🤝❤️🎉
Catch you at the next heist, traders—stay locked in for more! 🤑🐱🚀✨
