AUD-JPY Risky Short! Sell!
Hello,Traders!
AUD-JPY went up and hit
A horizontal supply area
Around 93.597 from where
We are already seeing a local
Bearish pullback so we are
Bearish biased and we will
Be expecting a local
Bearish correction
Buy!
Comment and subscribe to help us grow!
Check out other forecasts below too!
Disclosure: I am part of Trade Nation's Influencer program and receive a monthly fee for using their TradingView charts in my analysis.
AUD (Australian Dollar)

AUDJPY, our risk on/off monitor, is near a key resistance areaAUDJPY has been on a good run lately. The driving force behind it was the improved market sentiment due to the calming moment in the tariff wars. Can this be sustained?
Let's look at the technical picture of AUDJPY.
Let us know what you think in the comments below.
Thank you.
77.3% of retail investor accounts lose money when trading CFDs with this provider. You should consider whether you understand how CFDs work and whether you can afford to take the high risk of losing your money. Past performance is not necessarily indicative of future results. The value of investments may fall as well as rise and the investor may not get back the amount initially invested. This content is not intended for nor applicable to residents of the UK. Cryptocurrency CFDs and spread bets are restricted in the UK for all retail clients.

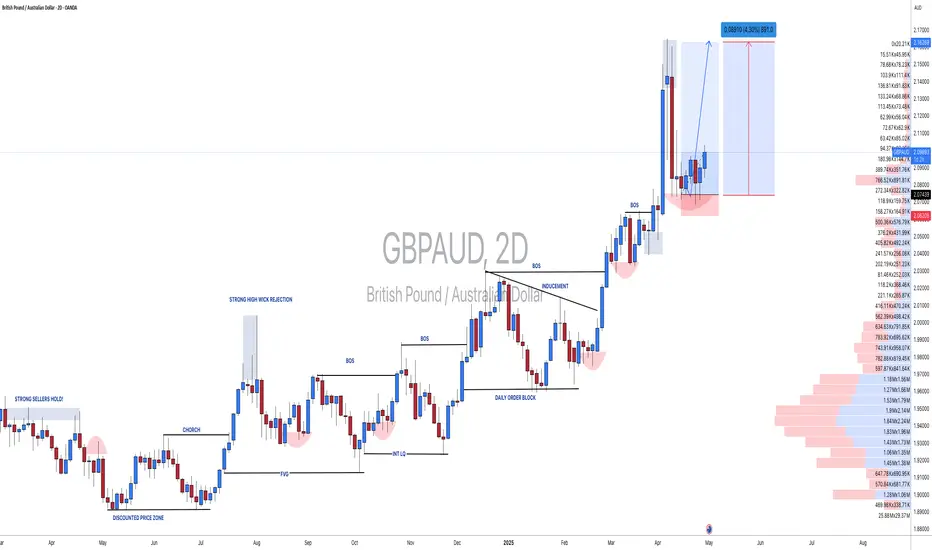
#GBPAUD: +245 From Previous Analysis, 880+ Total Pips TargetIn our previous analysis, we clearly indicated our entry point, and the price followed suit, reversing straight and currently up 245+ in positive. Going forward, we expect a straight, clean move of 800+ points. If you missed this entry, there will be a correction within the next 4 hours. Just analyse the pinpoint and enter accordingly with proper risk management.
Good luck and trade safely!
Thank you for your unwavering support! 😊
If you’d like to contribute, here are a few ways you can help us:
- Like our ideas
- Comment on our ideas
- Share our ideas
Team Setupsfx_
❤️🚀
EURAUD Will Go Down From Resistance! Sell!
Take a look at our analysis for EURAUD.
Time Frame: 9h
Current Trend: Bearish
Sentiment: Overbought (based on 7-period RSI)
Forecast: Bearish
The market is testing a major horizontal structure 1.747.
Taking into consideration the structure & trend analysis, I believe that the market will reach 1.713 level soon.
P.S
Overbought describes a period of time where there has been a significant and consistent upward move in price over a period of time without much pullback.
Disclosure: I am part of Trade Nation's Influencer program and receive a monthly fee for using their TradingView charts in my analysis.
Like and subscribe and comment my ideas if you enjoy them!

AUDCAD Will Go Higher! Long!
Please, check our technical outlook for AUDCAD.
Time Frame: 5h
Current Trend: Bullish
Sentiment: Oversold (based on 7-period RSI)
Forecast: Bullish
The market is approaching a key horizontal level 0.894.
Considering the today's price action, probabilities will be high to see a movement to 0.905.
P.S
Please, note that an oversold/overbought condition can last for a long time, and therefore being oversold/overbought doesn't mean a price rally will come soon, or at all.
Disclosure: I am part of Trade Nation's Influencer program and receive a monthly fee for using their TradingView charts in my analysis.
Like and subscribe and comment my ideas if you enjoy them!

AUD/NZD SHORT FROM RESISTANCE
Hello, Friends!
We are targeting the 1.081 level area with our short trade on AUD/NZD which is based on the fact that the pair is overbought on the BB band scale and is also approaching a resistance line above thus going us a good entry option.
Disclosure: I am part of Trade Nation's Influencer program and receive a monthly fee for using their TradingView charts in my analysis.
✅LIKE AND COMMENT MY IDEAS✅

AUDJPY...SHORTFX:AUDJPY
The zone has historically acted as a wall for price. Let's see if it does the same again. In current conditions, caution is key.
If it fails this time and we get a proper pullback, it could be the start of a trend shift.

GBPAUD Turns Bearish After Major Support Break – Eyes on 2.05110
The GBPAUD pair has broken decisively below the key support zone at 2.07000 , which previously acted as a base for multiple rebounds. This breakdown confirms bearish momentum and opens the path toward deeper retracement levels.
📉 Technical Breakdown:
- Price has closed below the 0.786 Fibonacci level (2.07778), signaling continuation.
- The next measured support target lies near 2.05110, aligning with the 1.618 Fibonacci extension and historical demand structure.
- RSI continues trending downward, showing no signs of bullish divergence , indicating sustained selling pressure.
📰 Fundamental Backdrop:
- Recent Australian CPI data came in stronger than expected , reinforcing RBA’s hawkish stance. This supports AUD strength.
Meanwhile, the UK economic outlook remains fragile due to inflation uncertainty and soft retail data.
Rising expectations that RBA may pause cuts or hike sooner vs. a dovish BOE adds fuel to this downside move.
🔍 Outlook & Trade Plan:
- Bias: Bearish below 2.07000
- Target Zone: 2.05110 (short-term)
- Confirmation: Price sustains below broken support, with pullbacks rejected near 2.07000
- Invalidation: Bullish breakout back above 2.07778 zone with strong volume
This zone breakdown is technically clean and backed by macro sentiment. I’ll monitor price action closely if a minor retest toward 2.07000 occurs, to consider entering a sell on rally setup .

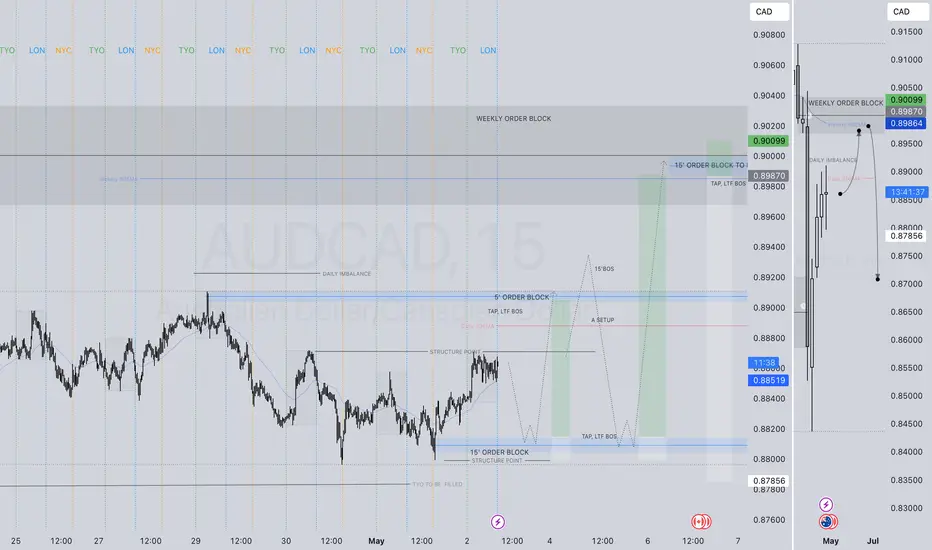
AUDCAD SHORT FORECAST Q2 W19 D5 Y25AUDCAD SHORT FORECAST Q2 W19 D5 Y25
Professional Risk Managers👋
Welcome back to another FRGNT chart update📈
Diving into some Forex setups using predominantly higher time frame order blocks alongside confirmation breaks of structure.
Let’s see what price action is telling us today!
💡Here are some trade confluences📝
✅ Weekly order block
✅Intraday 15 order block
✅Tokyo ranges to be filled
✅Intraday bearish breaks of structure to be confirmed
🔑 Remember, to participate in trading comes always with a degree of risk, therefore as professional risk managers it remains vital that we stick to our risk management plan as well as our trading strategies.
📈The rest, we leave to the balance of probabilities.
💡Fail to plan. Plan to fail.
🏆It has always been that simple.
❤️Good luck with your trading journey, I shall see you at the very top.
🎯Trade consistent, FRGNT X

GBPAUD Selling Trading IdeaHello Traders
In This Chart GBP/AUD 4 HOURLY Forex Forecast By FOREX PLANET
today GBP/AUD analysis 👆
🟢This Chart includes_ (GBP/AUD market update)
🟢What is The Next Opportunity on GBP/AUD Market
🟢how to Enter to the Valid Entry With Assurance Profit
This CHART is For Trader's that Want to Improve Their Technical Analysis Skills and Their Trading By Understanding How To Analyze The Market Using Multiple Timeframes and Understanding The Bigger Picture on the Charts

GBP-AUD Bearish Breakout! Sell!
Hello,Traders!
GBP-AUD made a bearish
Breakout of the key horizontal
Level of 2.0730 and the breakout
Is confirmed so we are
Bearish biased and we will
Be expecting a further
Move down on Monday
Sell!
Comment and subscribe to help us grow!
Check out other forecasts below too!
Disclosure: I am part of Trade Nation's Influencer program and receive a monthly fee for using their TradingView charts in my analysis.

EUR-AUD Strong Breakout! Sell!
Hello,Traders!
EUR-AUD made a bearish
Breakout of the rising support
Line and the breakout is
Confirmed so we will be
Expecting a further bearish
Move down on Monday
Sell!
Comment and subscribe to help us grow!
Check out other forecasts below too!
Disclosure: I am part of Trade Nation's Influencer program and receive a monthly fee for using their TradingView charts in my analysis.

AUD/CHF BEARS ARE STRONG HERE|SHORT
Hello, Friends!
AUD/CHF pair is in the uptrend because previous week’s candle is green, while the price is clearly rising on the 12H timeframe. And after the retest of the resistance line above I believe we will see a move down towards the target below at 0.513 because the pair overbought due to its proximity to the upper BB band and a bearish correction is likely.
Disclosure: I am part of Trade Nation's Influencer program and receive a monthly fee for using their TradingView charts in my analysis.
✅LIKE AND COMMENT MY IDEAS✅

EUR_AUD BEARISH BREAKOUT|SHORT|
✅EUR_AUD was trading along
The rising support but now
It is broken and the breakout
Is confirmed so we are bearish
Biased and we will be expecting
A further bearish move down
On Monday after a potential
Local pullback
SHORT🔥
✅Like and subscribe to never miss a new idea!✅
Disclosure: I am part of Trade Nation's Influencer program and receive a monthly fee for using their TradingView charts in my analysis.

AUD-CAD Correction Ahead! Sell!
Hello,Traders!
AUD-CAD keeps going up
But the pair will soon hit
A horizontal resistance level
Around 0.8936 and as the
Pair is locally overbought
We will be expecting a
Pullback and a local
Bearish correction
Sell!
Comment and subscribe to help us grow!
Check out other forecasts below too!
Disclosure: I am part of Trade Nation's Influencer program and receive a monthly fee for using their TradingView charts in my analysis.

AUD_CAD RESISTANCE AHEAD|SHORT|
✅AUD_CAD has been growing recently
And the pair seems locally overbought
So as the pair is approaching a horizontal resistance of 0.8950
Price decline is to be expected
SHORT🔥
✅Like and subscribe to never miss a new idea!✅
Disclosure: I am part of Trade Nation's Influencer program and receive a monthly fee for using their TradingView charts in my analysis.

GBP_AUD BEARISH BREAKOUT|SHORT|
✅GBP_AUD made a bearish
Breakout so we are bearish
Biased and we will be expecting
A local pullback and then a
Further bearish move down
SHORT🔥
✅Like and subscribe to never miss a new idea!✅
Disclosure: I am part of Trade Nation's Influencer program and receive a monthly fee for using their TradingView charts in my analysis.

EURAUD: Bullish Continuation & Long Signal
EURAUD
- Classic bullish formation
- Our team expects growth
SUGGESTED TRADE:
Swing Trade
Buy EURAUD
Entry Level - 1.7627
Sl - 1.7554
Tp - 1.7775
Our Risk - 1%
Start protection of your profits from lower levels
Disclosure: I am part of Trade Nation's Influencer program and receive a monthly fee for using their TradingView charts in my analysis.
❤️ Please, support our work with like & comment! ❤️

GBPAUD: Will Keep Growing! Here is Why:
The recent price action on the GBPAUD pair was keeping me on the fence, however, my bias is slowly but surely changing into the bullish one and I think we will see the price go up.
Disclosure: I am part of Trade Nation's Influencer program and receive a monthly fee for using their TradingView charts in my analysis.
❤️ Please, support our work with like & comment! ❤️

GBPAUD...LONG
[ OANDA:GBPAUD ] is approaching a level that has triggered key reactions in the past. Another reaction might be setting up soon. Scenarios are taking shape.
In case of a breakout, I’ll wait for a retest before positioning for the opposite direction.

AUDCAD LONG FORECAST Q2 W18 D2 Y25AUDCAD LONG FORECAST Q2 W18 D2 Y25
Professional Risk Managers👋
Welcome back to another FRGNT chart update📈
Diving into some Forex setups using predominantly higher time frame order blocks alongside confirmation breaks of structure.
Let’s see what price action is telling us today!
💡Here are some trade confluences📝
✅Daily 50 EMA
✅Intraday 15' order block
✅Tokyo ranges to be filled
✅Intraday bullish breaks of structure to be confirmed
🔑 Remember, to participate in trading comes always with a degree of risk, therefore as professional risk managers it remains vital that we stick to our risk management plan as well as our trading strategies.
📈The rest, we leave to the balance of probabilities.
💡Fail to plan. Plan to fail.
🏆It has always been that simple.
❤️Good luck with your trading journey, I shall see you at the very top.
🎯Trade consistent, FRGNT X
AUDCAD SHORT FORECAST Q2 W18 D2 Y25AUDCAD SHORT FORECAST Q2 W18 D2 Y25
Professional Risk Managers👋
Welcome back to another FRGNT chart update📈
Diving into some Forex setups using predominantly higher time frame order blocks alongside confirmation breaks of structure.
Let’s see what price action is telling us today!
💡Here are some trade confluences📝
✅Daily 50 EMA
✅Intraday 5' order block
✅Tokyo ranges to be filled
✅Intraday bearish breaks of structure to be confirmed
🔑 Remember, to participate in trading comes always with a degree of risk, therefore as professional risk managers it remains vital that we stick to our risk management plan as well as our trading strategies.
📈The rest, we leave to the balance of probabilities.
💡Fail to plan. Plan to fail.
🏆It has always been that simple.
❤️Good luck with your trading journey, I shall see you at the very top.
🎯Trade consistent, FRGNT X

Bearish drop?EUR/AUD has rejected off the pivot and could potentially drop to the 1st support which is a pullback support that aligns with the 61.8% Fibonacci projection.
Pivot: 1.77322
1st Support: 1.74140
1st Resistance: 1.78883
Risk Warning:
Trading Forex and CFDs carries a high level of risk to your capital and you should only trade with money you can afford to lose. Trading Forex and CFDs may not be suitable for all investors, so please ensure that you fully understand the risks involved and seek independent advice if necessary.
Disclaimer:
The above opinions given constitute general market commentary, and do not constitute the opinion or advice of IC Markets or any form of personal or investment advice.
Any opinions, news, research, analyses, prices, other information, or links to third-party sites contained on this website are provided on an "as-is" basis, are intended only to be informative, is not an advice nor a recommendation, nor research, or a record of our trading prices, or an offer of, or solicitation for a transaction in any financial instrument and thus should not be treated as such. The information provided does not involve any specific investment objectives, financial situation and needs of any specific person who may receive it. Please be aware, that past performance is not a reliable indicator of future performance and/or results. Past Performance or Forward-looking scenarios based upon the reasonable beliefs of the third-party provider are not a guarantee of future performance. Actual results may differ materially from those anticipated in forward-looking or past performance statements. IC Markets makes no representation or warranty and assumes no liability as to the accuracy or completeness of the information provided, nor any loss arising from any investment based on a recommendation, forecast or any information supplied by any third-party.
