GBPAUD Retests Double Top NecklineGBPAUD has broken the key support level of a double top pattern. The price is now caught between two important zones: the neckline of the double top, which is now acting as resistance, and the former resistance zone at 2.0725–2.0775, which has turned into support.
If this support fails, GBPAUD may continue toward the double top’s projected target near 2.04. However, if the neckline is reclaimed, the bearish setup would be invalidated.
AUD (Australian Dollar)

Potential bearish drop?EUR/AUD is reacting off the pivot and could drop to the pullback support.
Pivot: 1.79761
1st Support: 1.76901
1st Resistance: 1.80920
Risk Warning:
Trading Forex and CFDs carries a high level of risk to your capital and you should only trade with money you can afford to lose. Trading Forex and CFDs may not be suitable for all investors, so please ensure that you fully understand the risks involved and seek independent advice if necessary.
Disclaimer:
The above opinions given constitute general market commentary, and do not constitute the opinion or advice of IC Markets or any form of personal or investment advice.
Any opinions, news, research, analyses, prices, other information, or links to third-party sites contained on this website are provided on an "as-is" basis, are intended only to be informative, is not an advice nor a recommendation, nor research, or a record of our trading prices, or an offer of, or solicitation for a transaction in any financial instrument and thus should not be treated as such. The information provided does not involve any specific investment objectives, financial situation and needs of any specific person who may receive it. Please be aware, that past performance is not a reliable indicator of future performance and/or results. Past Performance or Forward-looking scenarios based upon the reasonable beliefs of the third-party provider are not a guarantee of future performance. Actual results may differ materially from those anticipated in forward-looking or past performance statements. IC Markets makes no representation or warranty and assumes no liability as to the accuracy or completeness of the information provided, nor any loss arising from any investment based on a recommendation, forecast or any information supplied by any third-party.

Bullish rise?AUD/CAD is reacting off the pivot and could rise to the 1st resistance.
Pivot: 0.88549
1st Support: 0.87948
1st Resistance: 0.89499
Risk Warning:
Trading Forex and CFDs carries a high level of risk to your capital and you should only trade with money you can afford to lose. Trading Forex and CFDs may not be suitable for all investors, so please ensure that you fully understand the risks involved and seek independent advice if necessary.
Disclaimer:
The above opinions given constitute general market commentary, and do not constitute the opinion or advice of IC Markets or any form of personal or investment advice.
Any opinions, news, research, analyses, prices, other information, or links to third-party sites contained on this website are provided on an "as-is" basis, are intended only to be informative, is not an advice nor a recommendation, nor research, or a record of our trading prices, or an offer of, or solicitation for a transaction in any financial instrument and thus should not be treated as such. The information provided does not involve any specific investment objectives, financial situation and needs of any specific person who may receive it. Please be aware, that past performance is not a reliable indicator of future performance and/or results. Past Performance or Forward-looking scenarios based upon the reasonable beliefs of the third-party provider are not a guarantee of future performance. Actual results may differ materially from those anticipated in forward-looking or past performance statements. IC Markets makes no representation or warranty and assumes no liability as to the accuracy or completeness of the information provided, nor any loss arising from any investment based on a recommendation, forecast or any information supplied by any third-party.

Bullish momentum to extend?AUD/CAD has bounced off the support level which is a pullback support and could potentially rise from this level to our take profit.
Entry: 0.88518
Why we like it:
There is a pullback support level.
Stop loss: 0.87962
Why we like it:
There is a pullback support level.
Take profit: 0.89544
Why we like it:
There is an overlap resistance level that lines up with the 61.8% Fibonacci projection.
Enjoying your TradingView experience? Review us!
Please be advised that the information presented on TradingView is provided to Vantage (‘Vantage Global Limited’, ‘we’) by a third-party provider (‘Everest Fortune Group’). Please be reminded that you are solely responsible for the trading decisions on your account. There is a very high degree of risk involved in trading. Any information and/or content is intended entirely for research, educational and informational purposes only and does not constitute investment or consultation advice or investment strategy. The information is not tailored to the investment needs of any specific person and therefore does not involve a consideration of any of the investment objectives, financial situation or needs of any viewer that may receive it. Kindly also note that past performance is not a reliable indicator of future results. Actual results may differ materially from those anticipated in forward-looking or past performance statements. We assume no liability as to the accuracy or completeness of any of the information and/or content provided herein and the Company cannot be held responsible for any omission, mistake nor for any loss or damage including without limitation to any loss of profit which may arise from reliance on any information supplied by Everest Fortune Group.

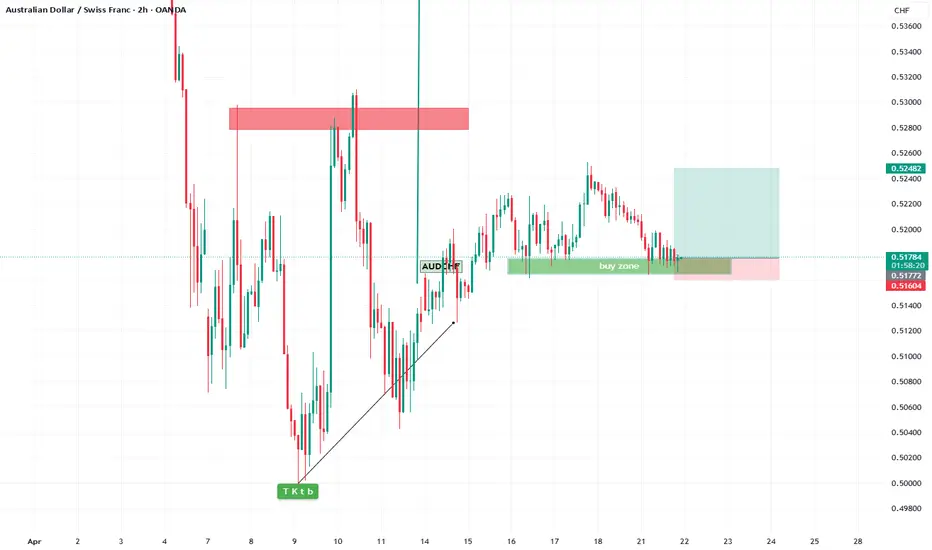
AUD/CHF BUY/LONGBy utilizing Fibonacci retracement levels, historical patterns, , we can formulate a hypothesis that the market might follow a similar trajectory if bullish sentiment prevails.
GBPAUD SELL/SHORTBy utilizing levels, historical patterns, , we can formulate a hypothesis that the market might follow a similar trajectory if bearish sentiment prevails.

AUDNZD On The Rise! BUY!
My dear subscribers,
This is my opinion on the AUDNZD next move:
The instrument tests an important psychological level 1.0683
Bias - Bullish
Technical Indicators: Supper Trend gives a precise Bullish signal, while Pivot Point HL predicts price changes and potential reversals in the market.
Target - 1.0733
About Used Indicators:
On the subsequent day, trading above the pivot point is thought to indicate ongoing bullish sentiment, while trading below the pivot point indicates bearish sentiment.
———————————
WISH YOU ALL LUCK

AUD/CHF BULLISH BIAS RIGHT NOW| LONG
Hello, Friends!
Bullish trend on AUD/CHF, defined by the green colour of the last week candle combined with the fact the pair is oversold based on the BB lower band proximity, makes me expect a bullish rebound from the support line below and a retest of the local target above at 0.522.
Disclosure: I am part of Trade Nation's Influencer program and receive a monthly fee for using their TradingView charts in my analysis.
✅LIKE AND COMMENT MY IDEAS✅

AUD-CAD Free Signal! Sell!
Hello,Traders!
AUD-CAD shot up sharply
But the pair failed to break
A horizontal resistance
Level of 0.8880 and we are
Already seeing a local pullback
Which is likely to turn into a
Local correction on Monday
So we can enter a short trade
With the Take Profit of 0.8779
And the Stop Loss of 0.8887
Sell!
Comment and subscribe to help us grow!
Check out other forecasts below too!
Disclosure: I am part of Trade Nation's Influencer program and receive a monthly fee for using their TradingView charts in my analysis.

GBPAUD NULLISH OR BEARISH DETAILED ANALYSIS GBPAUD is currently trading around the 2.0850 level, hovering just above a strong confluence support zone as seen on the 12H chart. Price action has formed a bullish symmetrical triangle pattern following a strong impulsive rally earlier this month. This compression near a major demand zone signals a potential bullish breakout as price builds pressure right above the support base. The 2.0700–2.0600 region has historically acted as a key level, now reinforcing itself as solid structure support.
Technically, this setup is clean and aligned with classic continuation pattern behavior. We had a strong rally leading into the triangle, and the market has been respecting both the lower support boundary and declining resistance trendline. The recent candles show signs of rejection from the lower bounds of the wedge, adding to the bullish sentiment. A confirmed breakout above 2.0900 could trigger a fresh wave of upside momentum targeting the 2.1300–2.1600 zone in the coming sessions.
Fundamentally, GBP remains supported by stronger-than-expected inflation data and ongoing hawkish tones from the Bank of England. Markets are dialing back expectations of near-term rate cuts, giving the pound further upside traction. Meanwhile, AUD is weakening amid soft Chinese economic data, increasing risk aversion, and fading demand for commodities. Australia’s labor market also showed signs of cooling, reducing the RBA’s tightening pressure and putting the Aussie on the back foot.
This is a high-probability swing setup gaining traction on TradingView due to the combination of strong technical formation and macro divergence. With the pattern maturing above support and a clear bullish structure, GBPAUD is offering an attractive risk-to-reward scenario for bulls eyeing continuation into Q2. Patience on the breakout confirmation will be key, but the bias remains clearly bullish from both a chart and economic perspective.

AUD/NZD LONG FROM SUPPORT
Hello, Friends!
AUD/NZD pair is in the downtrend because previous week’s candle is red, while the price is clearly falling on the 6H timeframe. And after the retest of the support line below I believe we will see a move up towards the target above at 1.083 because the pair oversold due to its proximity to the lower BB band and a bullish correction is likely.
Disclosure: I am part of Trade Nation's Influencer program and receive a monthly fee for using their TradingView charts in my analysis.
✅LIKE AND COMMENT MY IDEAS✅

GBP_AUD WAIT FOR BREAKOUT|SHORT|
✅GBP_AUD is consolidating in
A bearish triangle pattern
So we are bearish biased
And If we see a breakout
To the downside we will
Be able to go short on the
Pair expecting a further
Move down
SHORT🔥
✅Like and subscribe to never miss a new idea!✅
Disclosure: I am part of Trade Nation's Influencer program and receive a monthly fee for using their TradingView charts in my analysis.

AUDCHF LONGWe are in 75% onfirmed consolidation. i think the market will go from lower band to upper band of consolidation.
We didi bounce on prevous low and form bulish candels.
SL goes below lowes point and TP below highest point.

AUD-JPY Local Bearish Bias! Sell!
Hello,Traders!
AUD-JPY is going up now
But the pair will hit a horizontal
Resistance of 92.000 on Monday
From where we will be expecting
A local bearish correction
Sell!
Comment and subscribe to help us grow!
Check out other forecasts below too!
Disclosure: I am part of Trade Nation's Influencer program and receive a monthly fee for using their TradingView charts in my analysis.

EUR-AUD RISKY LONG|
✅EUR_AUD fell again to retest the support of 1.7700
But it is a strong key level
So I think that there is a high chance
We will see a bullish rebound and a move up
LONG🚀
✅Like and subscribe to never miss a new idea!✅
Disclosure: I am part of Trade Nation's Influencer program and receive a monthly fee for using their TradingView charts in my analysis.

#AUDCAD: Following a sell off, we might see price filling FVG. AUDCAD plummeted due to the NFP data, causing a record low price. However, it left a significant void area. The price has changed its behaviour, showing an increasing bullish presence. We only have one target where the price is likely to drop again heavily.
Good luck and trade safely. Like and comment for more!
Team Setupsfx_

GBPAUD Will Fall! Short!
Take a look at our analysis for GBPAUD.
Time Frame: 2h
Current Trend: Bearish
Sentiment: Overbought (based on 7-period RSI)
Forecast: Bearish
The market is testing a major horizontal structure 2.075.
Taking into consideration the structure & trend analysis, I believe that the market will reach 2.060 level soon.
P.S
Overbought describes a period of time where there has been a significant and consistent upward move in price over a period of time without much pullback.
Disclosure: I am part of Trade Nation's Influencer program and receive a monthly fee for using their TradingView charts in my analysis.
Like and subscribe and comment my ideas if you enjoy them!

1st trade analysis after long pause on EUR/AUDhello,
my name is kirollos and this is my first try after long pause of trading.
this is EUR/AUD currency.
I know that most of bank are in holiday today but lets try this.
there is a downtrend on high-time frame like 30min and 1h , and there is a corrective move (channel) on 5min time-frame.
I drew fib level and the correction move reach the golden ratio between 50% and 61.8% , then I drew fib extension to predict the next move and I would be satisficed with 61.8% as my first take profit target.
I my forecast that liquidity move to me side which encourage me to continue.
feel free to criticize me idea .. I love to hear any thing from you but please clarify your idea to me to understand.

AUD/CAD BEARS ARE GAINING STRENGTH|SHORT
Hello, Friends!
AUD/CAD pair is trading in a local uptrend which we know by looking at the previous 1W candle which is green. On the 1H timeframe the pair is going up too. The pair is overbought because the price is close to the upper band of the BB indicator. So we are looking to sell the pair with the upper BB line acting as resistance. The next target is 0.882 area.
Disclosure: I am part of Trade Nation's Influencer program and receive a monthly fee for using their TradingView charts in my analysis.
✅LIKE AND COMMENT MY IDEAS✅

GBP-AUD Bearish Triangle Pattern! Sell!
Hello,Traders!
GBP-AUD has formed a
Bearish triangle pattern
So we are bearish biased
And IF we see a bearish
Breakout then we will be
Expecting a further
Bearish continuation
Sell!
Comment and subscribe to help us grow!
Check out other forecasts below too!
Disclosure: I am part of Trade Nation's Influencer program and receive a monthly fee for using their TradingView charts in my analysis.

GBP/AUD "Pound vs Aussie" Forex Bank Heist Plan (Scalping/Day)🌟Hi! Hola! Ola! Bonjour! Hallo! Marhaba!🌟
Dear Money Makers & Robbers, 🤑💰✈️
Based on 🔥Thief Trading style technical and fundamental analysis🔥, here is our master plan to heist the GBP/AUD "Pound vs Aussie" Forex Market. Please adhere to the strategy I've outlined in the chart, which emphasizes short entry. Our aim is the high-risk ATR Zone. Risky level, oversold market, consolidation, trend reversal, trap at the level where traders and bullish robbers are stronger. 🏆💸"Take profit and treat yourself, traders. You deserve it!💪🏆🎉
Entry 📈 : "The heist is on! Wait for the breakout then make your move at (2.07100) - Bearish profits await!"
however I advise to Place sell stop orders below the Breakout level (or) after the breakout of Support level Place sell limit orders within a 15 or 30 minute timeframe most NEAREST (or) SWING low or high level for Pullback entries.
📌I strongly advise you to set an "alert (Alarm)" on your chart so you can see when the breakout entry occurs.
Stop Loss 🛑: "🔊 Yo, listen up! 🗣️ If you're lookin' to get in on a sell stop order, don't even think about settin' that stop loss till after the breakout 🚀. You feel me? Now, if you're smart, you'll place that stop loss where I told you to 📍, but if you're a rebel, you can put it wherever you like 🤪 - just don't say I didn't warn you ⚠️. You're playin' with fire 🔥, and it's your risk, not mine 👊."
📌Thief SL placed at the nearest/swing High or Low level Using the 4H timeframe (2.10000) Day/Scalping trade basis.
📌SL is based on your risk of the trade, lot size and how many multiple orders you have to take.
Target 🎯: 2.04700 (or) Escape Before the Target
💰💵💴💸GBP/AUD "Pound vs Aussie" Forex Bank Heist Plan (Day / Scalping Trade) is currently experiencing a Neutral trend (there is a chance to move bearishness).., driven by several key factors.👇👇👇
📰🗞️Get & Read the Fundamental, Macro Economics, COT Report, Quantitative Analysis, Sentimental Outlook, Intermarket Analysis, Future trend targets & Overall Score... go ahead to check 👉👉👉🔗🔗
⚠️Trading Alert : News Releases and Position Management 📰 🗞️ 🚫🚏
As a reminder, news releases can have a significant impact on market prices and volatility. To minimize potential losses and protect your running positions,
we recommend the following:
Avoid taking new trades during news releases
Use trailing stop-loss orders to protect your running positions and lock in profits
💖Supporting our robbery plan 💥Hit the Boost Button💥 will enable us to effortlessly make and steal money 💰💵. Boost the strength of our robbery team. Every day in this market make money with ease by using the Thief Trading Style.🏆💪🤝❤️🎉🚀
I'll see you soon with another heist plan, so stay tuned 🤑🐱👤🤗🤩

Could the price bounce from here?GBP/AUD is falling towards the pivot which is an overlap support and could bounce to the 1st resistance which acts as an overlap resistance.
Pivot: 2.0624
1st Support: 2.0413
1st Resistance: 2.1029
Risk Warning:
Trading Forex and CFDs carries a high level of risk to your capital and you should only trade with money you can afford to lose. Trading Forex and CFDs may not be suitable for all investors, so please ensure that you fully understand the risks involved and seek independent advice if necessary.
Disclaimer:
The above opinions given constitute general market commentary, and do not constitute the opinion or advice of IC Markets or any form of personal or investment advice.
Any opinions, news, research, analyses, prices, other information, or links to third-party sites contained on this website are provided on an "as-is" basis, are intended only to be informative, is not an advice nor a recommendation, nor research, or a record of our trading prices, or an offer of, or solicitation for a transaction in any financial instrument and thus should not be treated as such. The information provided does not involve any specific investment objectives, financial situation and needs of any specific person who may receive it. Please be aware, that past performance is not a reliable indicator of future performance and/or results. Past Performance or Forward-looking scenarios based upon the reasonable beliefs of the third-party provider are not a guarantee of future performance. Actual results may differ materially from those anticipated in forward-looking or past performance statements. IC Markets makes no representation or warranty and assumes no liability as to the accuracy or completeness of the information provided, nor any loss arising from any investment based on a recommendation, forecast or any information supplied by any third-party.

AUDJPY Breakout and Potential RetraceHey Traders, in today's trading session we are monitoring AUDJPY for a selling opportunity around 91.800 zone, AUDJPY is trading in a downtrend and currently is in a correction phase in which it is approaching the trend at 91.800 support and resistance area.
Trade safe, Joe.
