AUD_CAD RISKY LONG|
✅AUD_CAD is trading in an
Uptrend and the pair made
A nice pullback and retested
The falling support so we are
Locally bullish biased and
We will be expecting a
Local bullish rebound
LONG🚀
✅Like and subscribe to never miss a new idea!✅
Disclosure: I am part of Trade Nation's Influencer program and receive a monthly fee for using their TradingView charts in my analysis.
AUD (Australian Dollar)

Bullish reversal?EUR/AUD has bounced off the support level which is an overlap support that aligns with the 61.8% Fibonacci retracement and could rise from this level to our take profit.
Entry: 1.77003
Why we like it:
There is an overlap support level that lines up with the 61.8% Fibonacci retracement.
Stop loss: 1.74799
Why we like it:
There is a pullback support.
Take profit: 1.7974
Why we lik e it:
There is a pullback resistance that lines up with the 61.8% Fibonacci retracement.
Enjoying your TradingView experience? Review us!
Please be advised that the information presented on TradingView is provided to Vantage (‘Vantage Global Limited’, ‘we’) by a third-party provider (‘Everest Fortune Group’). Please be reminded that you are solely responsible for the trading decisions on your account. There is a very high degree of risk involved in trading. Any information and/or content is intended entirely for research, educational and informational purposes only and does not constitute investment or consultation advice or investment strategy. The information is not tailored to the investment needs of any specific person and therefore does not involve a consideration of any of the investment objectives, financial situation or needs of any viewer that may receive it. Kindly also note that past performance is not a reliable indicator of future results. Actual results may differ materially from those anticipated in forward-looking or past performance statements. We assume no liability as to the accuracy or completeness of any of the information and/or content provided herein and the Company cannot be held responsible for any omission, mistake nor for any loss or damage including without limitation to any loss of profit which may arise from reliance on any information supplied by Everest Fortune Group.

Bullish bounce?AUD/CAD is falling towards the support level which is an overlap support that aligns with the 71% Fibonacci retracement and could bounce from this level to our take profit.
Entry: 0.89106
Why we like it:
There is an overlap support that lines up with the 71% Fibonacci retracement.
Stop loss: 0.88668
Why we like it:
There is a pullback support.
Take profit: 0.90090
Why we like it:
There is a pullback resistance.
Enjoying your TradingView experience? Review us!
Please be advised that the information presented on TradingView is provided to Vantage (‘Vantage Global Limited’, ‘we’) by a third-party provider (‘Everest Fortune Group’). Please be reminded that you are solely responsible for the trading decisions on your account. There is a very high degree of risk involved in trading. Any information and/or content is intended entirely for research, educational and informational purposes only and does not constitute investment or consultation advice or investment strategy. The information is not tailored to the investment needs of any specific person and therefore does not involve a consideration of any of the investment objectives, financial situation or needs of any viewer that may receive it. Kindly also note that past performance is not a reliable indicator of future results. Actual results may differ materially from those anticipated in forward-looking or past performance statements. We assume no liability as to the accuracy or completeness of any of the information and/or content provided herein and the Company cannot be held responsible for any omission, mistake nor for any loss or damage including without limitation to any loss of profit which may arise from reliance on any information supplied by Everest Fortune Group.

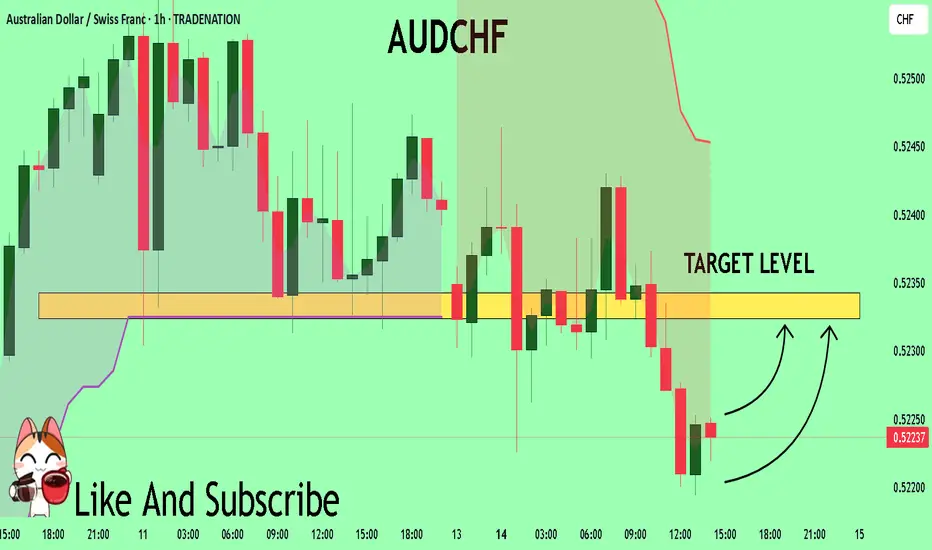
AUDCHF Expected Growth! BUY!
My dear friends,
AUDCHF looks like it will make a good move, and here are the details:
The market is trading on 0.5224 pivot level.
Bias - Bullish
Technical Indicators: Supper Trend generates a clear long signal while Pivot Point HL is currently determining the overall Bullish trend of the market.
Goal - 0.5232
About Used Indicators:
Pivot points are a great way to identify areas of support and resistance, but they work best when combined with other kinds of technical analysis
Disclosure: I am part of Trade Nation's Influencer program and receive a monthly fee for using their TradingView charts in my analysis.
———————————
WISH YOU ALL LUCK
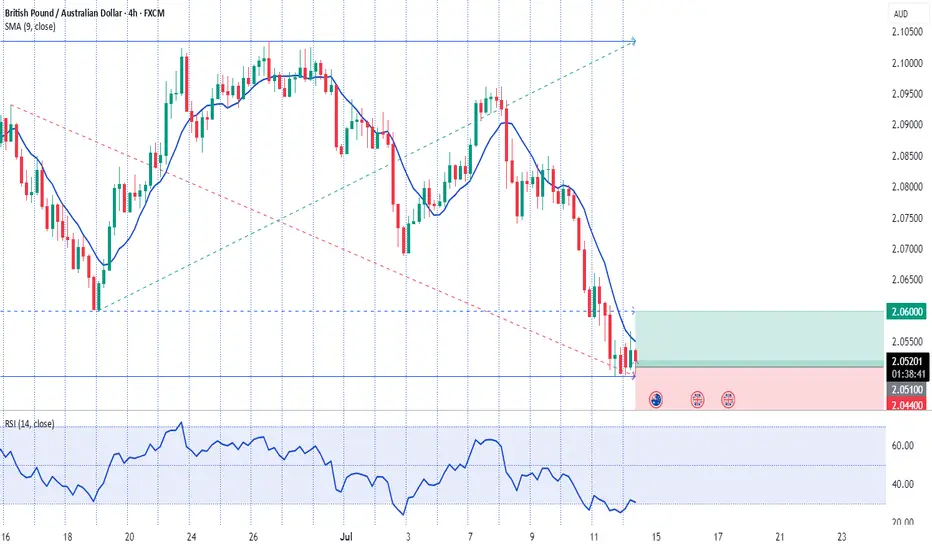
GBPAUD previous support now resistance at 2.0660The GBPAUD pair is currently trading with a bearish bias, aligned with the broader downward trend. Recent price action shows a retest of the previous support zone, suggesting a temporary relief rally within the downtrend.
Key resistance is located at 2.0660, a prior consolidation zone. This level will be critical in determining the next directional move.
A bearish rejection from 2.0660 could confirm the resumption of the downtrend, targeting the next support levels at 2.0480, followed by 2.0410 and 2.0350 over a longer timeframe.
Conversely, a decisive breakout and daily close above 2.0660 would invalidate the current bearish setup, shifting sentiment to bullish and potentially triggering a move towards 2.0710, then 2.0750.
Conclusion:
The short-term outlook remains bearish unless the pair breaks and holds above 2.0660. Traders should watch for price action signals around this key level to confirm direction. A rejection favours fresh downside continuation, while a breakout signals a potential trend reversal or deeper correction.
This communication is for informational purposes only and should not be viewed as any form of recommendation as to a particular course of action or as investment advice. It is not intended as an offer or solicitation for the purchase or sale of any financial instrument or as an official confirmation of any transaction. Opinions, estimates and assumptions expressed herein are made as of the date of this communication and are subject to change without notice. This communication has been prepared based upon information, including market prices, data and other information, believed to be reliable; however, Trade Nation does not warrant its completeness or accuracy. All market prices and market data contained in or attached to this communication are indicative and subject to change without notice.

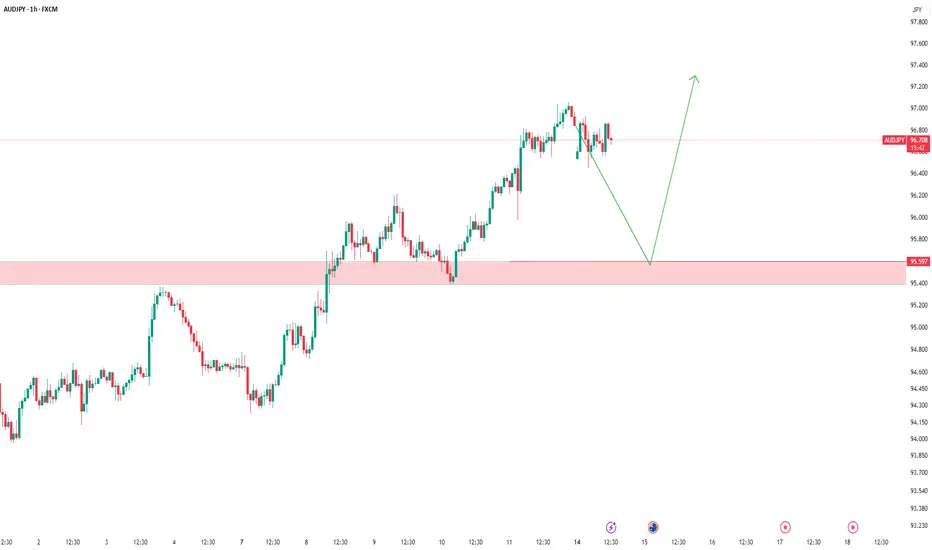
AUDJPY – Waiting for the Long SetupThe price is currently in a corrective move,
and as always, we’ve already marked our key level.
📍 We’re patiently waiting for price to reach our support zone.
If a valid buy signal appears, we’ll take the long position
according to our trading plan.
❌ What if the level breaks?
No worries.
We don’t predict — we follow the market.
We’ll wait for a clean pullback and enter short if confirmed.
🎯 Our job isn’t to predict where price will go,
our job is to manage risk and stay aligned with the market.
Price can do anything —
we’re ready for every scenario.
GBPAUD Will Move Higher! Buy!
Please, check our technical outlook for GBPAUD.
Time Frame: 1D
Current Trend: Bullish
Sentiment: Oversold (based on 7-period RSI)
Forecast: Bullish
The price is testing a key support 2.052.
Current market trend & oversold RSI makes me think that buyers will push the price. I will anticipate a bullish movement at least to 2.082 level.
P.S
We determine oversold/overbought condition with RSI indicator.
When it drops below 30 - the market is considered to be oversold.
When it bounces above 70 - the market is considered to be overbought.
Disclosure: I am part of Trade Nation's Influencer program and receive a monthly fee for using their TradingView charts in my analysis.
Like and subscribe and comment my ideas if you enjoy them!

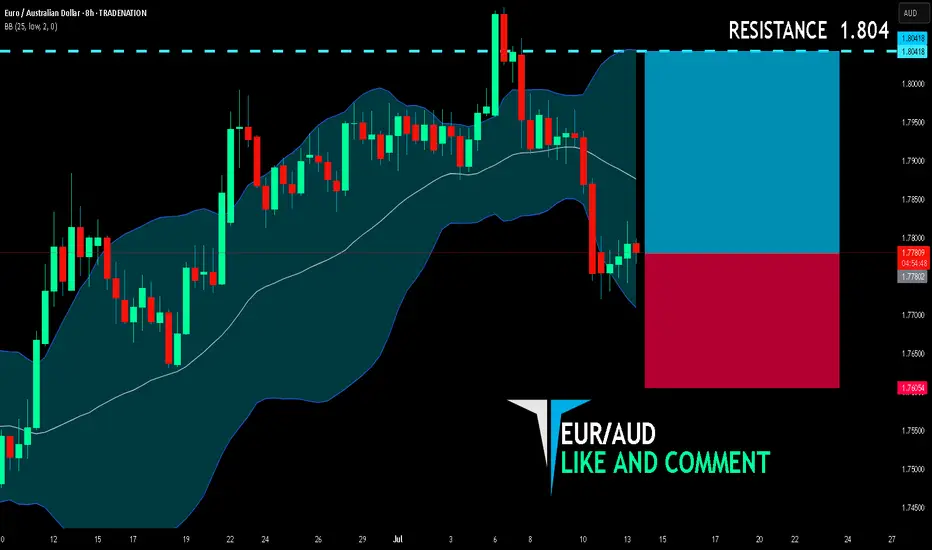
EUR/AUD BULLISH BIAS RIGHT NOW| LONG
EUR/AUD SIGNAL
Trade Direction: long
Entry Level: 1.778
Target Level: 1.804
Stop Loss: 1.760
RISK PROFILE
Risk level: medium
Suggested risk: 1%
Timeframe: 8h
Disclosure: I am part of Trade Nation's Influencer program and receive a monthly fee for using their TradingView charts in my analysis.
✅LIKE AND COMMENT MY IDEAS✅
GBP/AUD SHORT FROM RESISTANCE
GBP/AUD SIGNAL
Trade Direction: short
Entry Level: 2.098
Target Level: 2.062
Stop Loss: 2.122
RISK PROFILE
Risk level: medium
Suggested risk: 1%
Timeframe: 1D
Disclosure: I am part of Trade Nation's Influencer program and receive a monthly fee for using their TradingView charts in my analysis.
✅LIKE AND COMMENT MY IDEAS✅

AUDCAD | Weekly Outlook | July 14, 2025🟦 AUDCAD | Weekly Outlook | ICT-Based Analysis
📅 Week Starting: July 14, 2025
🧠 "Don't chase — let the trade come to you."
🧭 Market Context (1H + HTF Alignment)
This chart outlines a clear Smart Money framework for AUDCAD using ICT principles. The market recently completed a manipulation phase below a major accumulation zone, forming a clear SMT divergence and respecting a CISD (Clean Internal Sell-side Displacement).
After manipulation and SMT confirmation, price respected the CISD and showed willingness to displace bullishly, suggesting a potential re-accumulation phase on the lower timeframes.
🔍 Key Observations
Accumulation + SMT:
We had a prolonged accumulation phase that led to a smart money manipulation (fakeout), marked by SMT divergence. This was followed by a bullish shift in structure, confirming intent.
CISD + CE Reaction:
Price respected the CISD zone and formed a bullish W reversal + OB/BI setup. This is a common ICT pattern before major expansions.
Re-Accumulation Area:
The current consolidation near ERL levels shows signs of controlled accumulation, with price respecting previous liquidity levels.
This area may act as a springboard for expansion towards HTF objectives.
📈 HTF Targeting: Reversal Area + EQH
The chart marks a High Time Frame Reversal Area (HTF) above the current price, potentially acting as a premium inefficiency or sell-side liquidity target.
EOH (Expansion Objective High) is drawn in that same region, providing a long-term magnet for price.
This aligns with the broader Monthly Cycle expectation.
🔄 Monthly Cycle Analysis
“Monthly Cycle is Created — Open, Low... Now We Wait for the High and Close.”
This suggests:
Monthly Open and Low are already formed.
A bullish monthly cycle is anticipated — meaning we're waiting for the High to form next.
Once the high is set, a retracement towards the Close level is expected by the end of the month.
This macro view gives us context for aiming long positions on pullbacks — buying dips within the re-accumulation range.
⚠️ Trader's Insight
Don’t Chase — Let the Trade Come to You.
The setup is not about chasing price. Instead, the idea is to:
Wait for price to return to favorable zones (e.g., CE of OB inside CISD)
Confirm intent with LTF SMT, FVGs, or M15 structural shifts
Target HTF inefficiencies and liquidity zones (EOH & Reversal Area)
🎯 Bias for the Week
Bullish, based on:
Monthly cycle direction (expecting HIGH)
Price behavior post-CISD respect
Clear smart money accumulation and displacement
Re-accumulation on LTFs suggesting continuation

AUDJPY 4Hour TF - July 13th, 2025AUDJPY 7/13/2025
AUDJPY 4hour Bullish Idea
Monthly - Bullish
Weekly - Bearish
Dailly - Bearish
4hour - Bullish
Looking good on AJ! Last week’s analysis played out perfectly and we can see going into this week we have a similar scenario.
Here are the two potential trade paths for the week ahead:
Bullish Continuation - This is the most likely scenario going into this week as we just broke our 96.500 resistance and are now testing it as support. If we can confirm a higher low with strong bullish conviction we can look to enter long and target higher toward major resistance levels.
Bearish Reversal - For us to consider AJ bearish we would first need to see a break back below 96.500. If we can spot a clear trend change and some lower highs below 96.500 we can begin looking short. Target lower toward major support levels if this happens.
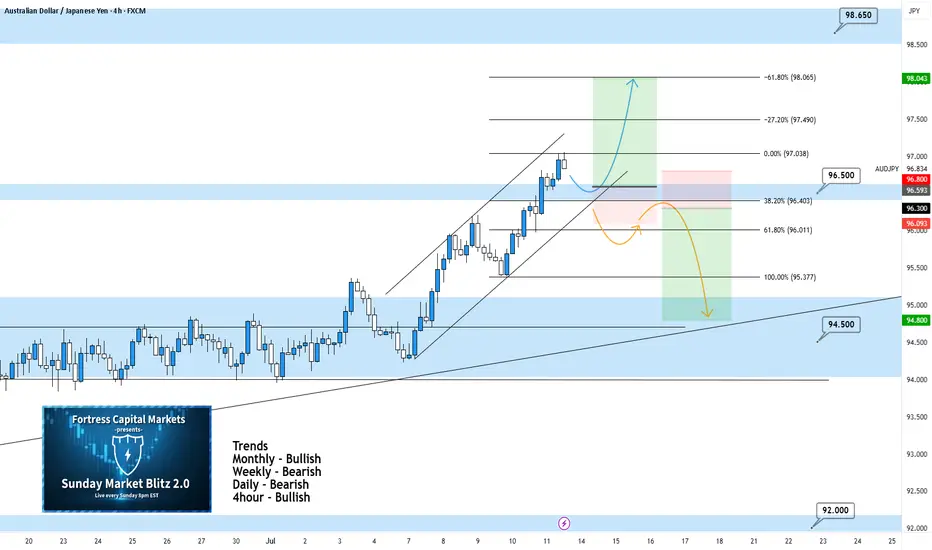
EURUAD is in the Buy direction from the Third TouchHello Traders
In This Chart EUR/AUD 4 HOURLY Forex Forecast By FOREX PLANET
today EUR/AUD analysis 👆
🟢This Chart includes_ (EUR/AUD market update)
🟢What is The Next Opportunity on EUR/AUD Market
🟢how to Enter to the Valid Entry With Assurance Profit
This CHART is For Trader's that Want to Improve Their Technical Analysis Skills and Their Trading By Understanding How To Analyze The Market Using Multiple Timeframes and Understanding The Bigger Picture on the Charts

GBP-AUD Risky Long! Buy!
Hello,Traders!
GBP-AUD keeps falling and
The pair is locally oversold
So as the pair is retesting
The horizontal support
Of 2.0480 we will be expecting
A local bullish correction
On Monday
Buy!
Comment and subscribe to help us grow!
Check out other forecasts below too!
Disclosure: I am part of Trade Nation's Influencer program and receive a monthly fee for using their TradingView charts in my analysis.

EUR_AUD WILL GO UP|LONG|
✅EUR_AUD is trading in an uptrend
And the bullish bias is confirmed
By the rebound we are seeing
After the pair retested the support
So I think the growth will continue
LONG🚀
✅Like and subscribe to never miss a new idea!✅
Disclosure: I am part of Trade Nation's Influencer program and receive a monthly fee for using their TradingView charts in my analysis.

Will This Breakout Unlock the Money Run? GBP/AUD Heist Begins!💼The Pound Heist: GBP/AUD Break-In Blueprint🔐
“The vault’s half open… Are you in or watching from the cameras?”
🌍 Hey crew! 💬 Hola, Ola, Bonjour, Hallo, Marhaba! 🌟
Welcome to another sneaky setup from the Thief Trading Syndicate™ 🕵️♂️💸
We're setting our sights on GBP/AUD — and the market's flashing green for a bold long entry mission. Read the plan carefully before suiting up. 🎯
🧠 Mission Brief:
The “Pound vs Aussie” market is now playing around a key resistance wall – it’s hot, it’s risky, and it’s primed for a breakout 🎇.
🟢 Entry:
Break & Close Above 2.10500 = 🚨 Green Light
🎯 Set a Buy Stop above the resistance zone —
OR
Sneak in with a Buy Limit during a clean pullback to recent high/low on the 15m or 30m timeframes 🔍.
⏰ Set an alert, don’t miss the moment the vault cracks open.
🛡️ Stop Loss Plan – Lock Your Exit:
🛑 For Buy Stops:
➡️ Wait till the breakout confirms — don’t rush your SL like a rookie 🐣
📍 Suggested SL at swing low (2.08700) based on the 3H timeframe
💡 Always size your SL based on your risk tolerance, not just the setup.
🎯 The Escape Plan – Target:
🏁 First Checkpoint: 2.13000
📤 Or slip out early if you sense heavy guards (resistance) on duty.
Use Trailing SL to lock your loot while staying in the run.
🧲 Scalper's Note:
Only rob the bullish side! If you’re packing heavy funds, hit fast — else join the swing crew and move with caution. 🎒
Lock in profits with trailing exits to avoid being caught in the chop 🌀.
📊 Why This Heist Works – Market Fuel:
🔥 Bullish sentiment fueled by:
Technical setup (Resistance > Breakout > Momentum Surge)
Risk zone analysis
Macro & COT outlooks
Sentiment + Intermarket Alignment
Stay informed — read the full macro game plan, news, and positioning tools. Knowledge = clean escape. 🧠💼
📰 News Alert:
⚠️ Avoid new entries during high-volatility events
✅ Use trailing SLs to protect any active trades
🔐 Stay safe, stay sharp — the market’s watching too 👁️
🆙 Support the Crew:
Smash the 💥 Boost Button 💥 if you ride with the Thief Style Traders 🐱👤💸
Let’s continue bagging pips & stacking gold, one chart at a time.
🚀 Next mission drops soon. Stay sharp. Stay sneaky. Stay paid.
#ThiefTrading #ForexHeist #GBPAUDPlan

Stealing Pips Like a Pro – AUD/NZD Long Heist, MA Breakout Setup🎯 AUD/NZD Heist: Bullish Bank Robbery 🚀💰 (Thief Trading Style)
🌟 Hi! Hola! Ola! Bonjour! Hallo! Marhaba! 🌟
Dear Money Makers & Robbers, 🤑💸✈️
Based on 🔥Thief Trading Style🔥 (technical + fundamental analysis), here’s our master plan to loot the AUD/NZD "Aussie vs Kiwi" Forex Bank!
🔎 The Heist Setup (Long Entry Focus)
🐂 Bullish Breakout Strategy:
Entry: Wait for MA breakout (1.08150) then strike!
Alternative Entry: Place Buy Stop above MA OR Buy Limit near pullback zones (15-30min timeframe).
Pro Tip: Set an ALERT for breakout confirmation!
🛑 Stop Loss (Thief’s Safety Net):
"Yo, listen up! 🗣️ If you're entering via Buy Stop, don’t set SL until after breakout!
Thief’s SL Zone: Nearest swing low (1.07500 – 3H timeframe).
Adjust SL based on your risk, lot size, and trade plan.
🎯 Profit Targets:
1st Target: 1.08600 (or escape earlier if cops lurk!).
Scalpers: Only scalp LONG! Use trailing SL to protect gains.
⚠️ Critical Heist Rules:
Avoid news chaos! 🚨 No new trades during high-impact news.
Lock profits with trailing stops.
Cops (Bears) are strong near resistance – don’t get caught!
💥 Boost the Heist!
💖 Hit the "Boost" button to strengthen our robbery squad! More likes = more 💰easy money heists!
Stay tuned for the next big steal! 🏆🚀🐱👤

"AUD/JPY: Bulls About to Raid Tokyo? (Long Plan)"🎯 AUD/JPY BULLISH BANK HEIST! (Long Setup Inside) - Thief Trading Strategy
🚨 Yen Carry Trade Alert: Aussie Loot Up For Grabs! 💰
🦹♂️ ATTENTION ALL MARKET PIRATES!
To the Profit Raiders & Risk-Takers! 🌏💣
Using our 🔥Thief Trading Tactics🔥 (a deadly combo of carry trade flows + risk sentiment + institutional traps), we're executing a bullish raid on AUD/JPY—this is not advice, just a strategic heist plan for traders who play by their own rules.
📈 THE LOOTING BLUEPRINT (LONG ENTRY PLAN)
🎯 Treasure Zone: 92.700 (or escape earlier if bears attack)
💎 High-Reward Play: Neutral turning bullish - trap for yen bulls
👮♂️ Cop Trap: Where bears get squeezed at support
🔑 ENTRY RULES:
"Vault Unlocked!" – Grab bullish loot on pullbacks (15-30min TF)
Buy Limit Orders near swing lows OR Market Orders with tight stops
Aggressive? Enter at market but watch JPY news
🚨 STOP LOSS (Escape Plan):
Thief SL at nearest swing low (4H chart)
⚠️ Warning: "Skip this SL? Enjoy donating to yen bulls."
🎯 TARGETS:
Main Take-Profit: 92.700
Scalpers: Ride the Asian session momentum
🔍 FUNDAMENTAL BACKUP (Why This Heist Works)
Before raiding, check:
✅ BOJ Policy (Yen weakness continuing?)
✅ Commodity Prices (Iron ore/coal supporting AUD?)
✅ Risk Sentiment (Stocks rally = carry trade fuel)
✅ Interest Spreads (AUD-JPY yield advantage)
🚨 RISK WARNING
Avoid BOJ/RBA speeches (unless you like volatility torture)
Trailing stops = your golden parachute
💎 BOOST THIS HEIST!
👍 Smash Like to fund our next raid!
🔁 Share to recruit more trading pirates!
🤑 See you at the target, rebels!
⚖️ DISCLAIMER: Hypothetical scenario. Trade at your own risk.
#AUDJPY #CarryTrade #TradingView #RiskOn #ThiefTrading
💬 COMMENT: "Long already—or waiting for better entry?" 👇🔥
P.S. Next heist target already being scouted... stay tuned! 🏴☠️

AUDCAD: Forecast & Technical Analysis
Balance of buyers and sellers on the AUDCAD pair, that is best felt when all the timeframes are analyzed properly is shifting in favor of the sellers, therefore is it only natural that we go short on the pair.
Disclosure: I am part of Trade Nation's Influencer program and receive a monthly fee for using their TradingView charts in my analysis.
❤️ Please, support our work with like & comment! ❤️

EURAUD Weekly Trade Setup(14 to 18th July 2025) - Head&ShoulderThis week, EURAUD (Euro/Australian Dollar) has entered a critical price zone, providing a textbook technical opportunity for traders. A clear Head & Shoulders pattern has formed on the 4-hour chart, pointing toward a potential trend reversal from bullish to bearish.
Let’s explore how to trade this intelligently from both bullish and bearish perspectives.
1. Bearish Setup – Head & Shoulders Pattern Breakdown
This is the primary trade idea for the week.
✅ Trade Logic:
Price has completed a classic Left Shoulder → Head → Right Shoulder formation.
The neckline (support) will be tested.
The current price is will pulling back to retest the right shoulder resistance zone, offering an ideal short opportunity.
🔻 Entry Plan:
Wait for bearish reversal confirmation (candlestick rejection or bearish engulfing) on the 1H or 4H timeframe.
Enter short once confirmation appears near 1.7850–1.7900.
📉 Stop Loss:
Place SL above the right shoulder high, adjusting for volatility and swing high (around 1.7950).
🎯 Targets:
Target zone: 1.7450–1.7500 (profit booking zone marked on the chart)
Potential Risk/Reward Ratio: 1:2, 1:3, or even 1:4+
2. Alternative Bullish Setup – Reversal at Neckline (High Risk)
This setup is for experienced or aggressive traders who spot early reversals.
✅ Trade Logic:
Price may bounce from the neckline and 200 EMA support area.
If this happens, a temporary bullish reversal may push price back toward the right shoulder zone.
🔺 Entry Plan:
Wait for bullish confirmation (reversal candle) near the neckline and EMA support (around 1.7700).
🚨 Stop Loss:
SL must be below the neckline swing low (around 1.7650).
🎯 Targets:
Resistance zone (right shoulder): 1.7850–1.7900
R:R setups of 1:2 or 1:3 possible
⚠️ This is considered a counter-trend trade and should be traded with caution.
3. Technical Confluence and Indicators
Pattern: Head & Shoulders (bearish reversal)
EMA 200: Price reacting around the long-term trend line
Support/Resistance: Cleanly defined horizontal zones
Reversal zones: Highlighted in red (supply) and green (demand)
4. Final Thoughts
This week’s EURAUD setup is a strong example of structure-based trading. With a well-formed head and shoulders pattern and a clean neckline break, the market signals a shift in momentum.
Safe Approach: Trade the short side after resistance rejection.
Risky Approach: Try a long on neckline bounce with tight SL.
Always confirm with your system and maintain strict risk management. Trade what you see, not what you feel.
Ready to trade? Save this setup, monitor price action, and execute only with confirmation.
=================================================================
Disclosure: I am part of Trade Nation's Influencer program and receive a monthly fee for using their TradingView charts in my analysis.
=================================================================

AUD_JPY IS OVERBOUGHT|SHORT|
✅AUD_JPY is trading in a strong
Uptrend but the pair is now
Locally overbought so after the
Pair hits the horizontal resistance
Level of 97.350 we will be expecting
A pullback and a bearish correction
On Monday!
SHORT🔥
✅Like and subscribe to never miss a new idea!✅
Disclosure: I am part of Trade Nation's Influencer program and receive a monthly fee for using their TradingView charts in my analysis.

EUR-AUD Bullish Bias! Buy!
Hello,Traders!
EUR-AUD went down but
A strong horizontal support
Level is below around 1.7690
And as the pair is trading in
An uptrend we will be expecting
A round and a move up
On Monday!
Buy!
Comment and subscribe to help us grow!
Check out other forecasts below too!
Disclosure: I am part of Trade Nation's Influencer program and receive a monthly fee for using their TradingView charts in my analysis.

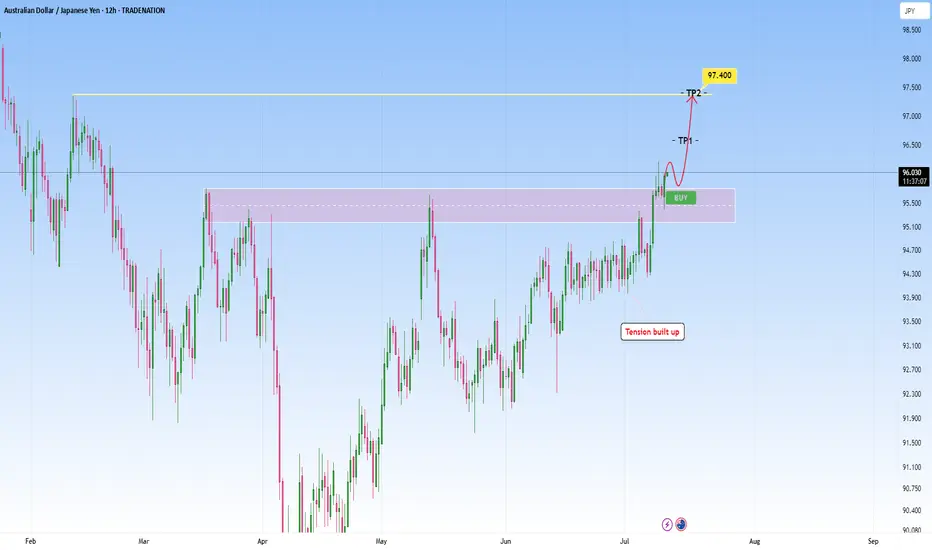
AUDJPY Technical Breakout - Targeting 97.400 Next?TRADENATION:AUDJPY has recently broken decisively above a key resistance zone that had previously capped price for several months. This breakout was preceded by a period of compression and range-bound price action, where bullish momentum steadily built up, indicated by higher lows pressing against the resistance level. This type of structure typically leads to an explosive breakout, which we are now seeing unfold.
After the breakout, price came back for a clean retest of the broken resistance zone, which has now flipped into support. The retest held firmly, suggesting strong buyer interest at this level and confirming the validity of the breakout.
With this structure in place, the bullish momentum is likely to extend further toward the next target zone around 97.400, provided price remains above the current support.
As long as the price holds above the retested zone, the bullish outlook remains intact. A breakdown back below this area, however, would be a warning sign and could open the door to a deeper pullback.
Remember, always wait for confirmation before entering trades, and maintain disciplined risk management.