AUDNZD Under Pressure! SELL!
My dear friends,
My technical analysis for AUDNZD is below:
The market is trading on 1.0985 pivot level.
Bias - Bullish
Technical Indicators: Both Super Trend & Pivot HL indicate a highly probable Bearish continuation.
Target - 1.0951
About Used Indicators:
A pivot point is a technical analysis indicator, or calculations, used to determine the overall trend of the market over different time frames.
Disclosure: I am part of Trade Nation's Influencer program and receive a monthly fee for using their TradingView charts in my analysis.
———————————
WISH YOU ALL LUCK
AUD (Australian Dollar)

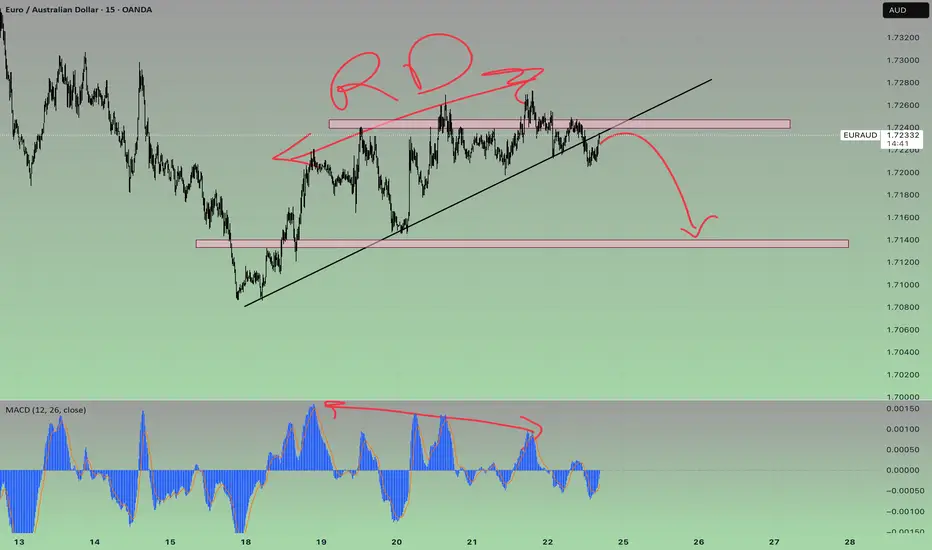
SHORT ON EUR/AUDEUR/AUD is currently at major resistance area.
It has given a nice change of character (choc) to the downside from being over brought for a long time.
I am selling EUR/AUD looking to catch over 500 pips as a swing trade.

EURAUD SELLThe overall trend of this pair is bullish 📈, but in the lower timeframe, a sell opportunity can be considered 📉. Let’s take advantage of this setup! ⚡️
#EURAUD
GBPAUD INTRADAY key trading level at 2.0520The GBPAUD currency pair is showing bullish sentiment, bolstered by the prevailing uptrend. The recent intraday price action suggests a corrective sideways consolidation, indicating a potential pause before resuming the upward movement.
Key Trading Levels:
Support Level: The critical support to monitor is 2.0520, which marks the previous consolidation price range.
Upside Targets: A corrective pullback from current levels, followed by a bullish rebound from the 2.0520 level, could set the stage for a move toward the next resistance levels at 2.0650, followed by 2.0720 and 2.0850 over a longer timeframe.
Alternative Bearish Scenario:
A confirmed break below the 2.0520 support level, with a daily close beneath this point, would invalidate the bullish outlook. In this case, the pair may experience deeper retracement, targeting the support levels at 2.0396, 2.0345, and 2.0286.
Conclusion:
While the current sentiment remains bullish, traders should keep a close watch on the 2.0520 support level. A successful bounce could reinforce the uptrend, while a breakdown and close below this level would indicate a shift to a bearish outlook, warranting caution and potential repositioning.
This communication is for informational purposes only and should not be viewed as any form of recommendation as to a particular course of action or as investment advice. It is not intended as an offer or solicitation for the purchase or sale of any financial instrument or as an official confirmation of any transaction. Opinions, estimates and assumptions expressed herein are made as of the date of this communication and are subject to change without notice. This communication has been prepared based upon information, including market prices, data and other information, believed to be reliable; however, Trade Nation does not warrant its completeness or accuracy. All market prices and market data contained in or attached to this communication are indicative and subject to change without notice.

GBPAUD Will Go Down! Short!
Take a look at our analysis for GBPAUD.
Time Frame: 5h
Current Trend: Bearish
Sentiment: Overbought (based on 7-period RSI)
Forecast: Bearish
The market is on a crucial zone of supply 2.056.
The above-mentioned technicals clearly indicate the dominance of sellers on the market. I recommend shorting the instrument, aiming at 2.044 level.
P.S
We determine oversold/overbought condition with RSI indicator.
When it drops below 30 - the market is considered to be oversold.
When it bounces above 70 - the market is considered to be overbought.
Disclosure: I am part of Trade Nation's Influencer program and receive a monthly fee for using their TradingView charts in my analysis.
Like and subscribe and comment my ideas if you enjoy them!

GBP/AUD "Pound vs Aussie" Forex Market Bearish Heist Plan🌟Hi! Hola! Ola! Bonjour! Hallo!🌟
Dear Money Makers & Robbers, 🤑 💰
Based on 🔥Thief Trading style technical and fundamental analysis🔥, here is our master plan to heist the GBP/AUD "Pound vs Aussie" Forex Market. Please adhere to the strategy I've outlined in the chart, which emphasizes short entry. Our aim is the high-risk Green Zone. Risky level, oversold market, consolidation, trend reversal, trap at the level where traders and bullish thieves are getting stronger. 🏆💸Book Profits Be wealthy and safe trade.💪🏆🎉
Entry 📈 : "The heist is on! Wait for the breakout (1.96000) then make your move - Bearish profits await!"
however I advise placing Sell Stop Orders below the breakout MA or Place Sell limit orders within a 15 or 30 minute timeframe. Entry from the most recent or closest low or high level should be in retest.
Stop Loss 🛑: Thief SL placed at 1.97300 (swing Trade Basis) Using the 4H period, the recent / swing high or low level.
SL is based on your risk of the trade, lot size and how many multiple orders you have to take.
Target 🎯: 1.93400 (or) Escape Before the Target
Scalpers, take note 👀 : only scalp on the Short side. If you have a lot of money, you can go straight away; if not, you can join swing traders and carry out the robbery plan. Use trailing SL to safeguard your money 💰.
📰🗞️Fundamental, Macro, COT, Sentimental Outlook:
GBP/AUD "Pound vs Aussie" Forex Market is currently experiencing a Bearish trend., driven by several key factors.
🟢Fundamental Analysis
- BoE Interest Rate Decision: The Bank of England's (BoE) decision to keep interest rates unchanged has led to a decrease in investor confidence, potentially impacting the GBP/AUD pair
- UK GDP Growth Rate: The UK's GDP growth rate is expected to be impacted by the BoE's dovish outlook and trade war fears, potentially leading to a decrease in the GBP/AUD pair
- Australian Employment Data: Australia's employment data is expected to be released soon, potentially impacting the AUD and the GBP/AUD pair
🔴Macroeconomic Trends
- Global Economic Trends: The ongoing trade war between the US and China is expected to impact global economic trends, potentially leading to a decrease in the GBP/AUD pair
- Inflation Rate: The UK's inflation rate is expected to be impacted by the BoE's monetary policy decisions, potentially leading to a decrease in the GBP/AUD pair
- Interest Rate Differentials: The interest rate differential between the UK and Australia is expected to impact the GBP/AUD pair, potentially leading to a decrease in the pair's value
🟣COT Report
- Institutional Traders: Institutional traders are net long on GBP/AUD, expecting a potential increase in the pair's value
- Retail Traders: Retail traders are net short on GBP/AUD, expecting a potential decrease in the pair's value
- Open Interest: Open interest is increasing, indicating a potential increase in market volatility
Non-Commercial Traders: 40% long, 60% short
Commercial Traders: 45% long, 55% short
Non-Reportable Traders: 35% long, 65% short
⚪Technical Analysis
- Trend: The current trend is bearish, with the GBP/AUD pair having declined by 5% over the past quarter.
- Moving Averages: The 50-day moving average is below the 200-day moving average, indicating a bearish trend.
🟤Market Sentiment
- Investor Sentiment: Institutional investors are 35% bullish, 45% bearish, and 20% neutral on the GBP/AUD pair.
- Retail Sentiment: Retail investors are 40% bullish, 30% bearish, and 30% neutral on the GBP/AUD pair.
- Market Mood: The overall market mood is cautious, with investors waiting for further economic data before making investment decisions.
⚫Overall Outlook
- Bearish: The GBP/AUD pair is expected to continue its downward trend, driven by a stronger AUD and a weaker GBP.
- Volatility: The GBP/AUD pair is expected to be volatile, with potential price swings of 5-10% in the short-term.
⚠️Trading Alert : News Releases and Position Management 📰 🗞️ 🚫🚏
As a reminder, news releases can have a significant impact on market prices and volatility. To minimize potential losses and protect your running positions,
we recommend the following:
Avoid taking new trades during news releases
Use trailing stop-loss orders to protect your running positions and lock in profits
📌Please note that this is a general analysis and not personalized investment advice. It's essential to consider your own risk tolerance and market analysis before making any investment decisions.
📌Keep in mind that these factors can change rapidly, and it's essential to stay up-to-date with market developments and adjust your analysis accordingly.
💖Supporting our robbery plan will enable us to effortlessly make and steal money 💰💵 Tell your friends, Colleagues and family to follow, like, and share. Boost the strength of our robbery team. Every day in this market make money with ease by using the Thief Trading Style.🏆💪🤝❤️🎉🚀
I'll see you soon with another heist plan, so stay tuned 🤑🐱👤🤗🤩

GBP/AUD "Pound vs Aussie" Forex Market Bank Heist Plan🌟Hi! Hola! Ola! Bonjour! Hallo! Marhaba!🌟
Dear Money Makers & Robbers, 🤑 💰💸✈️
Based on 🔥Thief Trading style technical and fundamental analysis🔥, here is our master plan to heist the GBP/AUD "Pound vs Aussie" Forex market. Please adhere to the strategy I've outlined in the chart, which emphasizes long entry. Our aim is the high-risk Red Zone. Risky level, overbought market, consolidation, trend reversal, trap at the level where traders and bearish robbers are stronger. 🏆💸Book Profits Be wealthy and safe trade.💪🏆🎉
Entry 📈 : "The vault is wide open! Swipe the Bullish loot at any price - the heist is on!
however I advise to Place buy limit orders within a 15 or 30 minute timeframe most recent or swing, low or high level. I Highly recommended you to put alert in your chart.
Stop Loss 🛑:
Thief SL placed at the recent / nearest low level Using the 4H timeframe (2.04000) swing trade basis.
SL is based on your risk of the trade, lot size and how many multiple orders you have to take.
Target 🎯: 2.08000 (or) Escape Before the Target
🧲Scalpers, take note 👀 : only scalp on the Long side. If you have a lot of money, you can go straight away; if not, you can join swing traders and carry out the robbery plan. Use trailing SL to safeguard your money 💰.
📰🗞️Read the Fundamental, Macro, COT Report, Quantitative Analysis, Intermarket Analysis, Sentimental Outlook:
GBP/AUD "Pound vs Aussie" Forex Market market is currently experiencing a bullish trend,., driven by several key factors.
📌Keep in mind that these factors can change rapidly, and it's essential to stay up-to-date with market developments and adjust your analysis accordingly.
⚠️Trading Alert : News Releases and Position Management 📰 🗞️ 🚫🚏
As a reminder, news releases can have a significant impact on market prices and volatility. To minimize potential losses and protect your running positions,
we recommend the following:
Avoid taking new trades during news releases
Use trailing stop-loss orders to protect your running positions and lock in profits
💖Supporting our robbery plan 💥Hit the Boost Button💥 will enable us to effortlessly make and steal money 💰💵. Boost the strength of our robbery team. Every day in this market make money with ease by using the Thief Trading Style.🏆💪🤝❤️🎉🚀
I'll see you soon with another heist plan, so stay tuned 🤑🐱👤🤗🤩

AUD/NZD "Aussie vs Kiwi" Forex Market Heist Plan🌟Hi! Hola! Ola! Bonjour! Hallo! Marhaba!🌟
⚔Dear Money Makers & Thieves, 🤑 💰✈️
Based on 🔥Thief Trading style technical and fundamental analysis🔥, here is our master plan to heist the AUD/NZD "Aussie vs Kiwi" Forex Market. Please adhere to the strategy I've outlined in the chart, which emphasizes short entry. Our aim is the high-risk Green Zone. Risky level, oversold market, consolidation, trend reversal, trap at the level where traders and bullish thieves are getting stronger. 🏆💸Book Profits Be wealthy and safe trade.💪🏆🎉
Entry 📈 : "The heist is on! Wait for the breakout (1.09900) then make your move - Bearish profits await!" however I advise placing Sell Stop Orders below the breakout MA or Place Sell limit orders within a 15 or 30 minute timeframe. Entry from the most recent or Swing high or low level should be in retest.
📌I strongly advise you to set an alert on your chart so you can see when the breakout entry occurs.
Stop Loss 🛑: Thief SL placed at (1.10500) swing Trade Basis Using the 4H period, the recent / swing high or low level.
SL is based on your risk of the trade, lot size and how many multiple orders you have to take.
🏴☠️Target 🎯: 1.09400 (or) Escape Before the Target
🧲Scalpers, take note 👀 : only scalp on the Short side. If you have a lot of money, you can go straight away; if not, you can join swing traders and carry out the robbery plan. Use trailing SL to safeguard your money 💰.
AUD/NZD "Aussie vs Kiwi" Forex Market is currently experiencing a Neutral trend (higher chance to 🐻🐼Bearishness)., driven by several key factors.
📰🗞️Get & Read the Fundamental, Macro Economics, COT Report, Quantitative Analysis, Intermarket Analysis, Sentimental Outlook, Future Trend Move:
Before start the heist plan read it.👉👉👉
📌Keep in mind that these factors can change rapidly, and it's essential to stay up-to-date with market developments and adjust your analysis accordingly.
⚠️Trading Alert : News Releases and Position Management 📰 🗞️ 🚫🚏
As a reminder, news releases can have a significant impact on market prices and volatility. To minimize potential losses and protect your running positions,
we recommend the following:
Avoid taking new trades during news releases
Use trailing stop-loss orders to protect your running positions and lock in profits
💖Supporting our robbery plan 💥Hit the Boost Button💥 will enable us to effortlessly make and steal money 💰💵. Boost the strength of our robbery team. Every day in this market make money with ease by using the Thief Trading Style.🏆💪🤝❤️🎉🚀
I'll see you soon with another heist plan, so stay tuned 🤑🐱👤🤗🤩

AUD-CAD Bearish Breakout! Sell!
Hello,Traders!
AUD-CAD made a bearish
Breakout of the key horizontal
Level of 0.9022 which is now
A resistance and the breakout
Is confirmed so we are bearish
Biased and we will be expecting
A further move down
Sell!
Comment and subscribe to help us grow!
Check out other forecasts below too!
Disclosure: I am part of Trade Nation's Influencer program and receive a monthly fee for using their TradingView charts in my analysis.

AUDCAD - Sell Trade SetupLooking to go short. Waiting for slight pullback to upside to then sell.
Leave a comment below, let me know what you think. Share with friends. Check out my profile for more awesome trade plans and setups
Trade Safe - Trade Well.
~Michael Harding CEO at LEFTURN

GBPAUD: Will Keep Falling! Here is Why:
The analysis of the GBPAUD chart clearly shows us that the pair is finally about to tank due to the rising pressure from the sellers.
Disclosure: I am part of Trade Nation's Influencer program and receive a monthly fee for using their TradingView charts in my analysis.
❤️ Please, support our work with like & comment! ❤️

AUD_CAD SHORT SIGNAL|
✅AUD_CAD is going down
And the pair made a bearish
Breakout of the key horizontal
Level of 0.9007 which is now
A resistance so we are bearish
Biased and we will be able
To enter a short trade on Monday
With the TP of 0.8970 and
The SL of 0.9030
SHORT🔥
✅Like and subscribe to never miss a new idea!✅
Disclosure: I am part of Trade Nation's Influencer program and receive a monthly fee for using their TradingView charts in my analysis.

AUDCAD Set To Grow! BUY!
My dear followers,
I analysed this chart on AUDCAD and concluded the following:
The market is trading on 0.9004 pivot level.
Bias - Bullish
Technical Indicators: Both Super Trend & Pivot HL indicate a highly probable Bullish continuation.
Target - 0.9048
Safe Stop Loss - 0.8977
About Used Indicators:
A super-trend indicator is plotted on either above or below the closing price to signal a buy or sell. The indicator changes color, based on whether or not you should be buying. If the super-trend indicator moves below the closing price, the indicator turns green, and it signals an entry point or points to buy.
Disclosure: I am part of Trade Nation's Influencer program and receive a monthly fee for using their TradingView charts in my analysis.
———————————
WISH YOU ALL LUCK

AUDCHF: Long Trade with Entry/SL/TP
AUDCHF
- Classic bullish setup
- Our team expects bullish continuation
SUGGESTED TRADE:
Swing Trade
Long AUDCHF
Entry Point - 0.5536
Stop Loss - 0.5514
Take Profit - 0.5578
Our Risk - 1%
Start protection of your profits from lower levels
Disclosure: I am part of Trade Nation's Influencer program and receive a monthly fee for using their TradingView charts in my analysis.
❤️ Please, support our work with like & comment! ❤️

EURAUD: Bearish Forecast & Outlook
Looking at the chart of EURAUD right now we are seeing some interesting price action on the lower timeframes. Thus a local move down seems to be quite likely.
Disclosure: I am part of Trade Nation's Influencer program and receive a monthly fee for using their TradingView charts in my analysis.
❤️ Please, support our work with like & comment! ❤️

AUDNZD LONG ReboundAUDNZD Rebound to the 60% fibbonacci level on daily timeframe. This is an entry against the trend. Moreover, we have Bullisgh divergence on RSI.

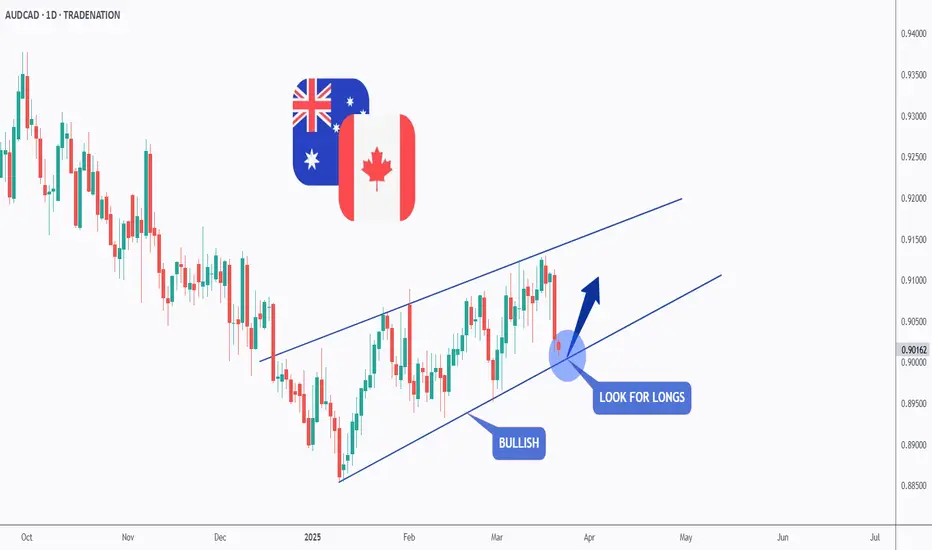
AUDCAD - Bulls Steppin in!Hello TradingView Family / Fellow Traders. This is Richard, also known as theSignalyst.
📈AUDCAD has been overall bullish trading within the rising wedge pattern marked in blue.
Today, AUDCAD is retesting the lower bound of the wedge.
Moreover, it is approaching its previous weekly low.
🏹 Thus, the highlighted blue circle is a strong area to look for buy setups as it is the intersection of weekly low and lower blue trendline acting as a non-horizontal support.
📚 As per my trading style:
As #AUDCAD approaches the blue circle zone, I will be looking for bullish reversal setups (like a double bottom pattern, trendline break , and so on...)
📚 Always follow your trading plan regarding entry, risk management, and trade management.
Good luck!
All Strategies Are Good; If Managed Properly!
~Rich
Disclosure: I am part of Trade Nation's Influencer program and receive a monthly fee for using their TradingView charts in my analysis.
GBP/AUD Ready to Fly! 🚀 GBP/AUD Ready to Fly! 🚀
🔹 Pair: GBP/AUD
🔹 Bias: Bullish ✅
🔹 Entry Zone:
🔹 Stop Loss (SL): 🔴
🔹 Take Profit (TP): 🏆
📊 Market Outlook:
✅ Sell-side liquidity grabbed – Market cleared weak hands
✅ Supply zone broken – Buyers stepping in
✅ Bullish market structure – Higher highs forming
✅ Confluence with key demand zone – Strong support holding
📈 GBP/AUD looks ready for a strong bullish move. If price holds above key levels, expect further upside momentum! 🚀
💬 Drop your thoughts below! Are you bullish too? 👇🔥
#GBPAUD #ForexTrading #SmartMoneyConcepts #LiquidityGrab #TradingView #ForexSignals

GBP/AUD Ready To Go Down , Don`t Miss This 250 Pips !Here is my analysis on GBP/AUD , We have an old res forced the price to go down before and now it`s the third touch for the re area , so i think it will be the best place to sell this pair and targeting 250 pips .
This Is An Educational + Analytic Content That Will Teach Why And How To Enter A Trade
Make Sure You Watch The Price Action Closely In Each Analysis As This Is A Very Important Part Of Our Method
Disclaimer : This Analysis Can Change At Anytime Without Notice And It Is Only For The Purpose Of Assisting Traders To Make Independent Investments Decisions.

AUD-CAD Local Long! Buy!
Hello,Traders!
AUD-CAD went down sharply
And the pair has hit a horizontal
Support of 0.9011 from
Where we are already seeing
A bullish reaction so we
Are locally bullish biased
And we think that the price
Will go up in a bullish correction
Buy!
Comment and subscribe to help us grow!
Check out other forecasts below too!
Disclosure: I am part of Trade Nation's Influencer program and receive a monthly fee for using their TradingView charts in my analysis.

AUDJPY Bearish continuation below 94.70Key Trading Level: 94.70
Bearish Scenario:
The overall sentiment remains bearish, aligned with the longer-term prevailing downtrend. Recent price action suggests a sideways consolidation, indicating potential continuation of the downtrend. A bearish rejection from 94.70 could reinforce selling pressure, targeting 92.33 as the first support level, with further downside extending toward 91.18 and 89.60 if bearish momentum strengthens.
Bullish Scenario:
A confirmed breakout above 94.70 and a daily close higher would invalidate the bearish outlook, signaling a potential shift in momentum. If buyers gain control, the next upside targets would be 95.56, followed by 96.60, where further resistance may emerge.
Conclusion:
The 94.70 level is a key pivot point in determining AUDJPY’s next directional move. A rejection at this level would reinforce the bearish outlook, while a breakout higher could indicate a potential trend reversal. Traders should monitor price action around 94.70 for confirmation of the next move.
This communication is for informational purposes only and should not be viewed as any form of recommendation as to a particular course of action or as investment advice. It is not intended as an offer or solicitation for the purchase or sale of any financial instrument or as an official confirmation of any transaction. Opinions, estimates and assumptions expressed herein are made as of the date of this communication and are subject to change without notice. This communication has been prepared based upon information, including market prices, data and other information, believed to be reliable; however, Trade Nation does not warrant its completeness or accuracy. All market prices and market data contained in or attached to this communication are indicative and subject to change without notice.

AUDCAD: Long Signal Explained
AUDCAD
- Classic bullish formation
- Our team expects pullback
SUGGESTED TRADE:
Swing Trade
Long AUDCAD
Entry - 0.9024
Sl - 0.8994
Tp - 0.9076
Our Risk - 1%
Start protection of your profits from lower levels
Disclosure: I am part of Trade Nation's Influencer program and receive a monthly fee for using their TradingView charts in my analysis.
❤️ Please, support our work with like & comment! ❤️

GBPAUD: Bearish Continuation & Short Signal
GBPAUD
- Classic bearish setup
- Our team expects bearish continuation
SUGGESTED TRADE:
Swing Trade
Short GBPAUD
Entry Point - 2.0619
Stop Loss - 2.0692
Take Profit - 2.0483
Our Risk - 1%
Start protection of your profits from lower levels
Disclosure: I am part of Trade Nation's Influencer program and receive a monthly fee for using their TradingView charts in my analysis.
❤️ Please, support our work with like & comment! ❤️
