AUDNZD Under Pressure - TA and Trade IdeaAUDNZD is facing selling pressure, as evident on the daily timeframe 📉. In this video, we analyze key support and resistance levels 📊 and explore a potential trade setup based on technical analysis, market structure, price action, and other critical factors. As always, this is not financial advice.
AUD (Australian Dollar)

Sentiment Extreme on the Yen Could Bode Well for Commodity FXI take a closer look at the Japanese yen futures market to highlight why I think the Japanese yen has reached an important inflection point. And that could further support the bounce of yen pairs such as AUD/JPY, CAD/JPY and NZD/JPY - alongside USD/JPY should the Fed not be as dovish as many hope.
Matt Simpson, Market Analyst at City index and Forex.com

Bearish reversal?AUD/JPY is rising towards the pivot which is a pullback resistance and could drop to the 1st support which is a pullback support.
Pivot: 95.54
1st Support: 93.95
1st Resistance: 96.26
Risk Warning:
Trading Forex and CFDs carries a high level of risk to your capital and you should only trade with money you can afford to lose. Trading Forex and CFDs may not be suitable for all investors, so please ensure that you fully understand the risks involved and seek independent advice if necessary.
Disclaimer:
The above opinions given constitute general market commentary, and do not constitute the opinion or advice of IC Markets or any form of personal or investment advice.
Any opinions, news, research, analyses, prices, other information, or links to third-party sites contained on this website are provided on an "as-is" basis, are intended only to be informative, is not an advice nor a recommendation, nor research, or a record of our trading prices, or an offer of, or solicitation for a transaction in any financial instrument and thus should not be treated as such. The information provided does not involve any specific investment objectives, financial situation and needs of any specific person who may receive it. Please be aware, that past performance is not a reliable indicator of future performance and/or results. Past Performance or Forward-looking scenarios based upon the reasonable beliefs of the third-party provider are not a guarantee of future performance. Actual results may differ materially from those anticipated in forward-looking or past performance statements. IC Markets makes no representation or warranty and assumes no liability as to the accuracy or completeness of the information provided, nor any loss arising from any investment based on a recommendation, forecast or any information supplied by any third-party.

Overlap resistance ahead?AUD/CHF is rising towards the pivot which is an overlap resistance and could reverse to the 1st support.
Pivot: 0.56541
1st Support: 0.55863
1st Resistance: 0.57011
Risk Warning:
Trading Forex and CFDs carries a high level of risk to your capital and you should only trade with money you can afford to lose. Trading Forex and CFDs may not be suitable for all investors, so please ensure that you fully understand the risks involved and seek independent advice if necessary.
Disclaimer:
The above opinions given constitute general market commentary, and do not constitute the opinion or advice of IC Markets or any form of personal or investment advice.
Any opinions, news, research, analyses, prices, other information, or links to third-party sites contained on this website are provided on an "as-is" basis, are intended only to be informative, is not an advice nor a recommendation, nor research, or a record of our trading prices, or an offer of, or solicitation for a transaction in any financial instrument and thus should not be treated as such. The information provided does not involve any specific investment objectives, financial situation and needs of any specific person who may receive it. Please be aware, that past performance is not a reliable indicator of future performance and/or results. Past Performance or Forward-looking scenarios based upon the reasonable beliefs of the third-party provider are not a guarantee of future performance. Actual results may differ materially from those anticipated in forward-looking or past performance statements. IC Markets makes no representation or warranty and assumes no liability as to the accuracy or completeness of the information provided, nor any loss arising from any investment based on a recommendation, forecast or any information supplied by any third-party.

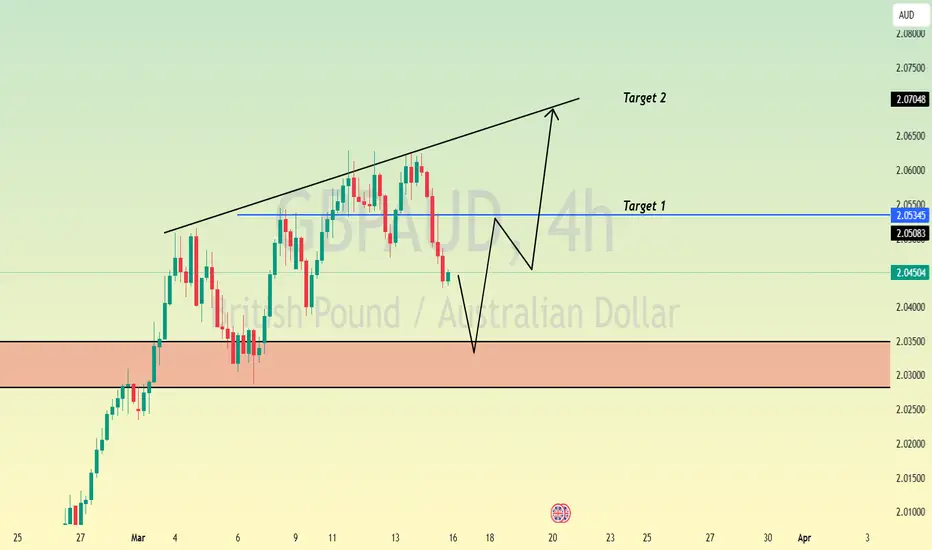
GBPAUDAlthough OANDA:GBPAUD largely remains bullish, a consolidation phase might just be in view. Looking at how price is currently attempting to create a 3 triple top on the H4 TF a breakout to the bullish side (2.06013) will mean a continued bullish move however a breakout to the lower side (2.04704) would indicate a potential market reversal. I would rather wait to see either move before making any trading decision on this pair.

AUD-NZD Free Signal! Buy!
Hello,Traders!
AUD-NZD has been falling
Recently and the pair is locally
Oversold so after it hits the
Horizontal support level
Of 1.0956 a long trade
Can be entered with the
TP of 1.0990 and SL of 1.0937
Buy!
Comment and subscribe to help us grow!
Check out other forecasts below too!
Disclosure: I am part of Trade Nation's Influencer program and receive a monthly fee for using their TradingView charts in my analysis.

GBP_AUD LONG SIGNAL|
✅GBP_AUD is moving down
Down now to retest a horizotnal
Support level of 2.0327 from
Where we can enter a long
Trade with the Take Profit
Of 2.0413 and SL of 2.0270
LONG🚀
✅Like and subscribe to never miss a new idea!✅
Disclosure: I am part of Trade Nation's Influencer program and receive a monthly fee for using their TradingView charts in my analysis.

AUDNZD Technical Analysis! SELL!
My dear followers,
I analysed this chart on AUDNZD and concluded the following:
The market is trading on 1.1089 pivot level.
Bias - Bearish
Technical Indicators: Both Super Trend & Pivot HL indicate a highly probable Bearish continuation.
Target - 1.1072
About Used Indicators:
A super-trend indicator is plotted on either above or below the closing price to signal a buy or sell. The indicator changes color, based on whether or not you should be buying. If the super-trend indicator moves below the closing price, the indicator turns green, and it signals an entry point or points to buy.
———————————
WISH YOU ALL LUCK

Bearish reversal?AUD/CHF is rising towards the resistance level which is an overlap resistance and could reverse from this level to our take profit.
Entry: 0.5654
Why we like it:
There is an overlap resistance level.
Stop loss: 0.5682
Why we like it:
There is a pullback resistance level.
Take profit: 0.5586
Why we like it:
There is a pullback support level.
Enjoying your TradingView experience? Review us!
Please be advised that the information presented on TradingView is provided to Vantage (‘Vantage Global Limited’, ‘we’) by a third-party provider (‘Everest Fortune Group’). Please be reminded that you are solely responsible for the trading decisions on your account. There is a very high degree of risk involved in trading. Any information and/or content is intended entirely for research, educational and informational purposes only and does not constitute investment or consultation advice or investment strategy. The information is not tailored to the investment needs of any specific person and therefore does not involve a consideration of any of the investment objectives, financial situation or needs of any viewer that may receive it. Kindly also note that past performance is not a reliable indicator of future results. Actual results may differ materially from those anticipated in forward-looking or past performance statements. We assume no liability as to the accuracy or completeness of any of the information and/or content provided herein and the Company cannot be held responsible for any omission, mistake nor for any loss or damage including without limitation to any loss of profit which may arise from reliance on any information supplied by Everest Fortune Group.

AUDNZD at Key Support Level - Rebound Towards 1.10100?OANDA:AUDNZD has reached a significant support zone, highlighted by previous price reactions and strong buying interest. This area has previously acted as a key demand zone, increasing the likelihood of a bounce if buyers step in.
The current market structure suggests that if the price confirms support within this zone, we could see a bullish reversal. A successful rebound could push the pair toward the 1.10100 level, a logical target based on previous price behavior and current market dynamics. Monitoring candlestick patterns and volume at this critical zone is essential for identifying buying opportunities.
Just my take on support and resistance zones, not financial advice. Always confirm your setups and trade with solid risk management.
Best of luck!

AUDJPY INTRADAY capped by resistance at 94.70Key Trading Level: 94.70
Bearish Scenario:
The overall sentiment remains bearish, aligned with the longer-term prevailing downtrend. Recent price action suggests a sideways consolidation, indicating potential continuation of the downtrend. A bearish rejection from 94.70 could reinforce selling pressure, targeting 92.33 as the first support level, with further downside extending toward 91.18 and 89.60 if bearish momentum strengthens.
Bullish Scenario:
A confirmed breakout above 94.70 and a daily close higher would invalidate the bearish outlook, signaling a potential shift in momentum. If buyers gain control, the next upside targets would be 95.56, followed by 96.60, where further resistance may emerge.
Conclusion:
The 94.70 level is a key pivot point in determining AUDJPY’s next directional move. A rejection at this level would reinforce the bearish outlook, while a breakout higher could indicate a potential trend reversal. Traders should monitor price action around 94.70 for confirmation of the next move.
This communication is for informational purposes only and should not be viewed as any form of recommendation as to a particular course of action or as investment advice. It is not intended as an offer or solicitation for the purchase or sale of any financial instrument or as an official confirmation of any transaction. Opinions, estimates and assumptions expressed herein are made as of the date of this communication and are subject to change without notice. This communication has been prepared based upon information, including market prices, data and other information, believed to be reliable; however, Trade Nation does not warrant its completeness or accuracy. All market prices and market data contained in or attached to this communication are indicative and subject to change without notice.

AUDJPY Buyers In Panic! SELL!
My dear friends,
Please, find my technical outlook for AUDJPY below:
The instrument tests an important psychological level 94.592
Bias - Bearish
Technical Indicators: Supper Trend gives a precise Bearish signal, while Pivot Point HL predicts price changes and potential reversals in the market.
Target - 93.776
About Used Indicators:
Super-trend indicator is more useful in trending markets where there are clear uptrends and downtrends in price.
———————————
WISH YOU ALL LUCK

AUDJPY Will Go Down! Sell!
Please, check our technical outlook for AUDJPY.
Time Frame: 1h
Current Trend: Bearish
Sentiment: Overbought (based on 7-period RSI)
Forecast: Bearish
The price is testing a key resistance 94.552.
Taking into consideration the current market trend & overbought RSI, chances will be high to see a bearish movement to the downside at least to 94.086 level.
P.S
Overbought describes a period of time where there has been a significant and consistent upward move in price over a period of time without much pullback.
Disclosure: I am part of Trade Nation's Influencer program and receive a monthly fee for using their TradingView charts in my analysis.
Like and subscribe and comment my ideas if you enjoy them!

AUD/NZD BULLS ARE STRONG HERE|LONG
Hello, Friends!
AUD/NZD pair is trading in a local downtrend which we know by looking at the previous 1W candle which is red. On the 3H timeframe the pair is going down too. The pair is oversold because the price is close to the lower band of the BB indicator. So we are looking to buy the pair with the lower BB line acting as support. The next target is 1.100 area.
Disclosure: I am part of Trade Nation's Influencer program and receive a monthly fee for using their TradingView charts in my analysis.
✅LIKE AND COMMENT MY IDEAS✅

AUD_JPY RESISTANCE AHEAD|SHORT|
✅AUD_JPY is going up now
But a strong resistance level is ahead at 94.800
Thus I am expecting a pullback
And a move down towards the target at 94.093
SHORT🔥
✅Like and subscribe to never miss a new idea!✅

GBPAUD The Week Ahead 17th March ‘25
The GBPAUD currency pair maintains a bullish sentiment, supported by the prevailing long-term uptrend. However, recent price action suggests an overextended bullish breakout, approaching significant resistance zones on both daily and weekly timeframes.
The key trading level to watch is 2.0227. A potential overbought pullback from current levels, followed by a bullish rebound from 2.0227, could extend the upside, targeting 2.0499, with further resistance at 2.0577 and 2.0737 over a longer timeframe.
Conversely, a confirmed break below 2.0227, with a daily close under this level, could signal a corrective pullback towards 2.0077 and 2.9937.
Conclusion:
While the broader trend remains bullish, the current overextended move suggests the possibility of short-term retracements. Holding 2.0227 as support will be critical for further upside continuation, while a breakdown below this level could trigger deeper corrections. Traders should monitor price action closely and adjust risk management accordingly.
This communication is for informational purposes only and should not be viewed as any form of recommendation as to a particular course of action or as investment advice. It is not intended as an offer or solicitation for the purchase or sale of any financial instrument or as an official confirmation of any transaction. Opinions, estimates and assumptions expressed herein are made as of the date of this communication and are subject to change without notice. This communication has been prepared based upon information, including market prices, data and other information, believed to be reliable; however, Trade Nation does not warrant its completeness or accuracy. All market prices and market data contained in or attached to this communication are indicative and subject to change without notice.

GBP/AUD Finally Made Double Top Pattern , Short Entry Valid !Here is my chart on GBP/AUD , Finally we have a very good reversal pattern after this huge movement to upside , the price made a double top reversal pattern , and the price broke the neckline and closed below it , so now i`m waiting the price to retest the broken neckline and then we can enter a sell trade if we have a good retest and targeting 250 Pips .
This Is An Educational + Analytic Content That Will Teach Why And How To Enter A Trade
Make Sure You Watch The Price Action Closely In Each Analysis As This Is A Very Important Part Of Our Method
Disclaimer : This Analysis Can Change At Anytime Without Notice And It Is Only For The Purpose Of Assisting Traders To Make Independent Investments Decisions.

AUD-CHF Move Up Expected! Buy!
Hello,Traders!
AUD-CHF made a bullish
Breakout of the key horizontal
Level of 0.5576 and the
Breakout is confirmed
Because the daily candle
Closed above the key level
So on the market open
We will be expecting a
Local pullback and then
A strong move up
Buy!
Comment and subscribe to help us grow!
Check out other forecasts below too!
Disclosure: I am part of Trade Nation's Influencer program and receive a monthly fee for using their TradingView charts in my analysis.

EUR_AUD SUPPORT AHEAD|LONG|
✅EUR_AUD is making a bearish
Correction and will soon retest a
Key support level of 1.7100
While trading in a strong uptrend
So I think that the pair will make a rebound
And go up to retest the supply level above at 1.7260
LONG🚀
✅Like and subscribe to never miss a new idea!✅
Disclosure: I am part of Trade Nation's Influencer program and receive a monthly fee for using their TradingView charts in my analysis.

AUDJPY The Teek Ahead 17th March ‘25Key Trading Level: 94.70
Bearish Scenario:
The overall sentiment remains bearish, aligned with the longer-term prevailing downtrend. Recent price action suggests a sideways consolidation, indicating potential continuation of the downtrend. A bearish rejection from 94.70 could reinforce selling pressure, targeting 92.33 as the first support level, with further downside extending toward 91.18 and 89.60 if bearish momentum strengthens.
Bullish Scenario:
A confirmed breakout above 94.70 and a daily close higher would invalidate the bearish outlook, signaling a potential shift in momentum. If buyers gain control, the next upside targets would be 95.56, followed by 96.60, where further resistance may emerge.
Conclusion:
The 94.70 level is a key pivot point in determining AUDJPY’s next directional move. A rejection at this level would reinforce the bearish outlook, while a breakout higher could indicate a potential trend reversal. Traders should monitor price action around 94.70 for confirmation of the next move.
This communication is for informational purposes only and should not be viewed as any form of recommendation as to a particular course of action or as investment advice. It is not intended as an offer or solicitation for the purchase or sale of any financial instrument or as an official confirmation of any transaction. Opinions, estimates and assumptions expressed herein are made as of the date of this communication and are subject to change without notice. This communication has been prepared based upon information, including market prices, data and other information, believed to be reliable; however, Trade Nation does not warrant its completeness or accuracy. All market prices and market data contained in or attached to this communication are indicative and subject to change without notice.

GBPAUD The Week Ahead 17th March ‘25The GBPAUD currency pair maintains a bullish sentiment, supported by the prevailing long-term uptrend. However, recent price action suggests an overextended bullish breakout, approaching significant resistance zones on both daily and weekly timeframes.
The key trading level to watch is 2.0227. A potential overbought pullback from current levels, followed by a bullish rebound from 2.0227, could extend the upside, targeting 2.0499, with further resistance at 2.0577 and 2.0737 over a longer timeframe.
Conversely, a confirmed break below 2.0227, with a daily close under this level, could signal a corrective pullback towards 2.0077 and 2.9937.
Conclusion:
While the broader trend remains bullish, the current overextended move suggests the possibility of short-term retracements. Holding 2.0227 as support will be critical for further upside continuation, while a breakdown below this level could trigger deeper corrections. Traders should monitor price action closely and adjust risk management accordingly.
This communication is for informational purposes only and should not be viewed as any form of recommendation as to a particular course of action or as investment advice. It is not intended as an offer or solicitation for the purchase or sale of any financial instrument or as an official confirmation of any transaction. Opinions, estimates and assumptions expressed herein are made as of the date of this communication and are subject to change without notice. This communication has been prepared based upon information, including market prices, data and other information, believed to be reliable; however, Trade Nation does not warrant its completeness or accuracy. All market prices and market data contained in or attached to this communication are indicative and subject to change without notice.

EURAUD The Week Ahead 17th March ‘25The EURAUD currency pair maintains a bullish sentiment, supported by the prevailing long-term uptrend. However, recent price action suggests an overextended bullish breakout, approaching significant resistance zones on both daily and weekly timeframes.
The key trading level to watch is 1.7050. A potential overbought pullback from current levels, followed by a bullish rebound from 1.7050, could extend the upside, targeting 1.7320, with further resistance at 1.7676 and 1.7800 over a longer timeframe.
Conversely, a confirmed break below 1.7050, with a daily close under this level, could signal a corrective pullback towards 1.6880 and 1.6800.
Conclusion:
While the broader trend remains bullish, the current overextended move suggests the possibility of short-term retracements. Holding 1.7050 as support will be critical for further upside continuation, while a breakdown below this level could trigger deeper corrections. Traders should monitor price action closely and adjust risk management accordingly.
This communication is for informational purposes only and should not be viewed as any form of recommendation as to a particular course of action or as investment advice. It is not intended as an offer or solicitation for the purchase or sale of any financial instrument or as an official confirmation of any transaction. Opinions, estimates and assumptions expressed herein are made as of the date of this communication and are subject to change without notice. This communication has been prepared based upon information, including market prices, data and other information, believed to be reliable; however, Trade Nation does not warrant its completeness or accuracy. All market prices and market data contained in or attached to this communication are indicative and subject to change without notice.

GBPAUD buy Trade IdeaHello Traders
In This Chart GBP/AUD 4 HOURLY Forex Forecast By FOREX PLANET
today GBP/AUD analysis 👆
🟢This Chart includes_ (GBP/AUD market update)
🟢What is The Next Opportunity on GBP/AUD Market
🟢how to Enter to the Valid Entry With Assurance Profit
This CHART is For Trader's that Want to Improve Their Technical Analysis Skills and Their Trading By Understanding How To Analyze The Market Using Multiple Timeframes and Understanding The Bigger Picture on the Charts