AUD/JPY: Rejection at Key ResistanceThis is a high-conviction short setup on AUD/JPY based on a powerful rejection pattern that has formed on the 4-hour chart. As you can see, the price spiked into the critical resistance zone between 95.00 and 95.55 but was immediately and forcefully rejected, leaving behind a long "Exhaustion Spike."
This is a classic sign of buyer exhaustion and seller dominance. It tells us that despite the recent rally, there is significant supply waiting at these higher levels. This price action provides a clear opportunity to short the pair in anticipation of a significant move down.
🏦 Fundamental Analysis
The fundamental backdrop provides a strong tailwind for this trade, with two key drivers:
1️⃣ Central Bank Divergence: The Reserve Bank of Australia (RBA) is in an easing cycle, having recently cut rates to 3.85% with more cuts expected. In stark contrast, the Bank of Japan (BoJ) is on a path of normalization, having already raised its rate to 0.50%. This divergence in monetary policy is structurally bearish for AUD/JPY.
2️⃣ Imminent Catalysts: This week is packed with event risk that is skewed to the downside for this pair. We have the RBA interest rate decision on Tuesday, July 8th , and the U.S. tariff deadline on Wednesday, July 9th . A dovish RBA or a "risk-off" move from the tariff news would likely accelerate the decline in AUD (a risk currency) and strengthen the JPY (a safe-haven currency).
📊 Technical Analysis
The price action on the chart confirms the bearish bias:
1️⃣ 4-Hour Rejection: The "Exhaustion Spike" at the 95.00 - 95.55 supply zone is the primary signal. It shows a clear failure by buyers and a strong takeover by sellers at a key level.
2️⃣ Long-Term Trend: On the daily chart, the price is trading below the critical 200-day moving average , confirming the long-term trend remains bearish.
3️⃣ Waning Momentum: There is a clear bearish divergence on the daily RSI. The price made a higher high, but the momentum indicator made a lower high, signaling that the rally is internally weak and losing steam.
📋 Trading Setup
This is a swing trade designed to capture a significant correction with a simple "set and forget" plan.
📉 Direction: SHORT / SELL
👉 Entry: Sell Limit @ 94.85
⛔️ Stop Loss: 95.60
🎯 Take Profit: 91.10
💡 Rationale: The entry is placed strategically to capitalize on a potential retest of the rejection area. The stop loss is placed safely above the rejection wick and the major resistance zone. The take profit targets the major structural support from the May 2025 lows, offering an excellent risk-to-reward ratio.
AUD (Australian Dollar)

EUR-AUD Will Fall! Sell!
Hello,Traders!
EUR-AUD keeps trading in
A strong uptrend and the pair
Is locally overbought so as the
Pair is retesting a horizontal
Resistance of 1.8019 from
Where we will be expecting
A local pullback on Monday
Sell!
Comment and subscribe to help us grow!
Check out other forecasts below too!
Disclosure: I am part of Trade Nation's Influencer program and receive a monthly fee for using their TradingView charts in my analysis.

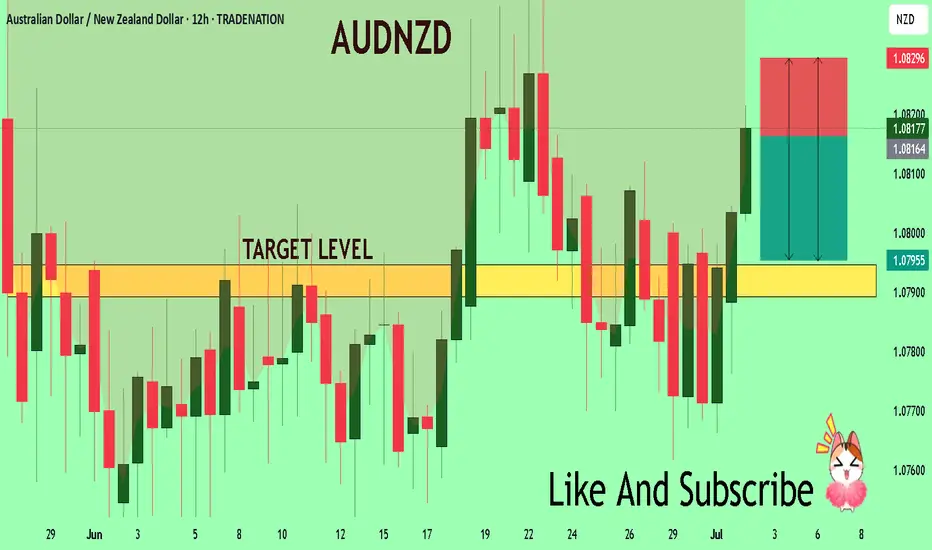
AUD-NZD Local Long! Buy!
Hello,Traders!
AUD-NZD is already making
A bullish rebound from the
Horizontal support of 1.0810
So we are locally bullish biased
And we will be expecting a
Further bullish move up
Buy!
Comment and subscribe to help us grow!
Check out other forecasts below too!
Disclosure: I am part of Trade Nation's Influencer program and receive a monthly fee for using their TradingView charts in my analysis.

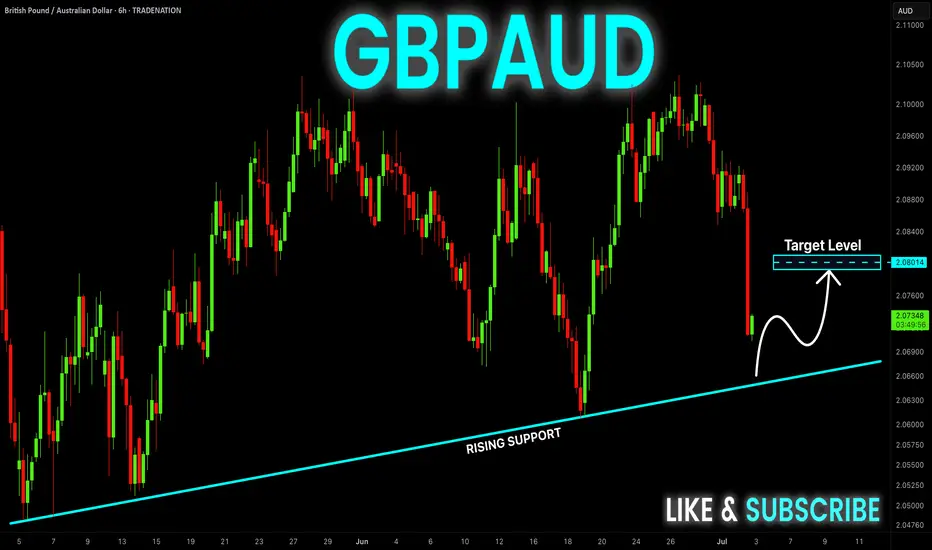
GBP_AUD BEARISH BIAS|SHORT|
✅GBP_AUD is going up to retest
A horizontal resistance of 2.0892
Which makes me locally bearish biased
And I think that we will see a pullback
And a move down from the level
Towards the target below at 2.0805
SHORT🔥
✅Like and subscribe to never miss a new idea!✅
Disclosure: I am part of Trade Nation's Influencer program and receive a monthly fee for using their TradingView charts in my analysis.

EUR_AUD LOCAL CORRECTION|SHORT|
✅EUR_AUD is set to retest a
Strong resistance level above at 1.8020
After trading in a local uptrend for some time
Which makes a bearish pullback a likely scenario
With the target being a local support below at 1.7940
SHORT🔥
✅Like and subscribe to never miss a new idea!✅
Disclosure: I am part of Trade Nation's Influencer program and receive a monthly fee for using their TradingView charts in my analysis.

AUD_NZD WILL GROW|LONG|
✅AUD_NZD made a bullish
Rebound so we are bullish
Biased and we will be expecting
A further bullish move up
LONG🚀
✅Like and subscribe to never miss a new idea!✅
Disclosure: I am part of Trade Nation's Influencer program and receive a monthly fee for using their TradingView charts in my analysis.

GBP-AUD Short From Resistance! Sell!
Hello,Traders!
GBP-AUD made a retest of
The horizontal resistance
Around 2.0800 from where
We will be expecting a
Local bearish move down
Sell!
Comment and subscribe to help us grow!
Check out other forecasts below too!
Disclosure: I am part of Trade Nation's Influencer program and receive a monthly fee for using their TradingView charts in my analysis.

EUR/AUD 1H – Decision Point Ahead Breakout or Fakeout? Eyes on Confirmation Zone 👁️
EUR/AUD has finally tapped into a critical resistance at 1.79900, a level previously rejected with high volatility. The current price action is testing this ceiling, with signs of strength — but smart money waits for confirmation.
What We’re Seeing:
🔹 Uptrend Intact: All EMAs are aligned in bullish order.
🔹 Bullish Fair Value Gap (FVG) formed below — a potential area of demand.
🔹 Price now hovering inside the Confirmation Zone — marked by previous highs and psychological resistance.
🔹 Volume building gradually — but breakout volume not confirmed yet.
⚖️ Summary:
Trend: Upward
Structure: Breakout under test
Momentum: Bullish
Market Phase: Confirmation / decision point
Key Behavior: Watch for commitment or rejection without predicting it

AUDJPY SHORT FORECAST Q3 W27 D4 Y25AUDJPY SHORT FORECAST Q3 W27 D4 Y25
Professional Risk Managers👋
Welcome back to another FRGNT chart update📈
Diving into some Forex setups using predominantly higher time frame order blocks alongside confirmation breaks of structure.
Let’s see what price action is telling us today! 👀
💡Here are some trade confluences📝
✅Weekly Order Block Identified
✅Daily Order block identified
✅4H Order Block identified
✅15' Order block identified
🔑 Remember, to participate in trading comes always with a degree of risk, therefore as professional risk managers it remains vital that we stick to our risk management plan as well as our trading strategies.
📈The rest, we leave to the balance of probabilities.
💡Fail to plan. Plan to fail.
🏆It has always been that simple.
❤️Good luck with your trading journey, I shall see you at the very top.
🎯Trade consistent, FRGNT X

AUDCAD BUYBy utilizing Fibonacci retracement levels, historical patterns, , we can formulate a hypothesis that the market might follow a similar trajectory if bullish sentiment prevails.

AUD_JPY RISKY SHORT|
✅AUD_JPY is set to retest a
Strong resistance level above at 95.600
After trading in a local uptrend for some time
Which makes a bearish pullback a likely scenario
With the target being a local support below at 95.081
SHORT🔥
✅Like and subscribe to never miss a new idea!✅
Disclosure: I am part of Trade Nation's Influencer program and receive a monthly fee for using their TradingView charts in my analysis.

GBPAUD – Swing Trade OpportunityGBPAUD has confirmed another bounce from long-term trendline support, combining technical signals with a supportive macro backdrop to set up a bullish swing opportunity.
Technical Highlights:
🔹Trendline support holding with multiple rejections, reinforcing bullish structure.
🔹Stochastic RSI has crossed up from oversold, signaling bullish momentum building.
🔹RSI recovering above 45, showing improving sentiment.
📰 Fundamental Backdrop:
The Bank of England remains hawkish on inflation, keeping GBP supported.
Australian Dollar under pressure as China growth concerns weigh on commodity demand.
Broader risk-on environment limits AUD’s safe-haven appeal compared to GBP.
🎯 Bullish Targets:
✔️ TP1: 2.0727 – First key resistance zone for partial take profit.
✔️ TP2: 2.0874 – Major resistance and next swing target.
✔️ TP3: 2.1000+ – Full potential if momentum extends.
🔒 Stop-Loss: Below 2.0461 – Clear invalidation if support fails.
📝 This setup provides a healthy Risk/Reward ratio with defined invalidation and multi-target upside. Manage actively as the trade develops.

EUR-AUD Bearish Breakout! Sell!
Hello,Traders!
EUR-AUD was trading along
The rising support line but
Now we are seeing a bearish
Breakout so we are bearish
Biased and we will be expecting
A further bearish move down
Sell!
Comment and subscribe to help us grow!
Check out other forecasts below too!
Disclosure: I am part of Trade Nation's Influencer program and receive a monthly fee for using their TradingView charts in my analysis.

AUDNZD: Short Trading Opportunity
AUDNZD
- Classic bearish setup
- Our team expects bearish continuation
SUGGESTED TRADE:
Swing Trade
Short AUDNZD
Entry Point - 1.0834
Stop Loss - 1.0850
Take Profit - 1.0802
Our Risk - 1%
Start protection of your profits from lower levels
Disclosure: I am part of Trade Nation's Influencer program and receive a monthly fee for using their TradingView charts in my analysis.
❤️ Please, support our work with like & comment! ❤️
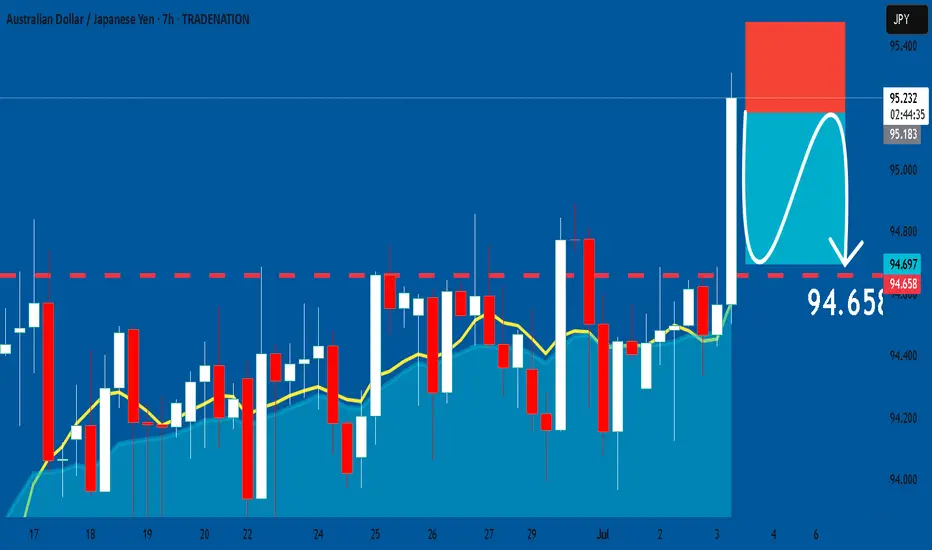
AUDJPY: Short Trade Explained
AUDJPY
- Classic bearish formation
- Our team expects fall
SUGGESTED TRADE:
Swing Trade
Sell AUDJPY
Entry Level - 95.193
Sl - 95.477
Tp - 94.658
Our Risk - 1%
Start protection of your profits from lower levels
Disclosure: I am part of Trade Nation's Influencer program and receive a monthly fee for using their TradingView charts in my analysis.
❤️ Please, support our work with like & comment! ❤️
GBPAUD: Growth & Bullish Continuation
It is essential that we apply multitimeframe technical analysis and there is no better example of why that is the case than the current GBPAUD chart which, if analyzed properly, clearly points in the upward direction.
Disclosure: I am part of Trade Nation's Influencer program and receive a monthly fee for using their TradingView charts in my analysis.
❤️ Please, support our work with like & comment! ❤️

GBPAUD - Trading The Range!Hello TradingView Family / Fellow Traders. This is Richard, also known as theSignalyst.
📈GA has been hovering within a big range.
This week, GA is retesting the upper bound of the range acting as a resistance.
As long as the resistance holds, we will be looking for shorts on lower timeframes, targeting the lower bound of the range.
📚 Always follow your trading plan regarding entry, risk management, and trade management.
Good luck!
All Strategies Are Good; If Managed Properly!
~Rich
Disclosure: I am part of Trade Nation's Influencer program and receive a monthly fee for using their TradingView charts in my analysis.

We hit. We failed. Now we drop.OANDA:GBPAUD
Inside this price channel, the market is forming a flag in an attempt to break out.
But given the market cycle and three failed breakout attempts,
I believe it's time for sellers to take control.
📉 I’m siding with the bears on this one!

AUD_NZD LOCAL LONG|
✅AUD_NZD made a retest
And a bullish rebound from
The horizontal support level
Around 1.0805 so we are
Locally bullish biased and we
Will be expecting a further
Bullish move up
LONG🚀
✅Like and subscribe to never miss a new idea!✅
Disclosure: I am part of Trade Nation's Influencer program and receive a monthly fee for using their TradingView charts in my analysis.

GBPAUD Short From Resistance!
HI,Traders !
#GBPAUD went up sharply
Made a retest of the
Horizontal resistance level
Of 2.10010 from where we
Are already seeing a local
Bearish reaction so we
Are locally bearish biased
And we will be expecting
A local bearish correction !
Comment and subscribe to help us grow !

GBP-AUD Rising Support Ahead! Buy!
Hello,Traders!
GBP-AUD made a sharp
And sudden move down
And the pair is oversold
So after it retest the rising
Support line we will be
Expecting a local bullish
Correction and a move up
Buy!
Comment and subscribe to help us grow!
Check out other forecasts below too!
Disclosure: I am part of Trade Nation's Influencer program and receive a monthly fee for using their TradingView charts in my analysis.

AUDNZD Will Collapse! SELL!
My dear friends,
Please, find my technical outlook for AUDNZD below:
The price is coiling around a solid key level - 1.0816
Bias - Bearish
Technical Indicators: Pivot Points Low anticipates a potential price reversal.
Super trend shows a clear sell, giving a perfect indicators' convergence.
Goal - 1.0794
Safe Stop Loss - 1.0829
About Used Indicators:
The pivot point itself is simply the average of the high, low and closing prices from the previous trading day.
Disclosure: I am part of Trade Nation's Influencer program and receive a monthly fee for using their TradingView charts in my analysis.
———————————
WISH YOU ALL LUCK