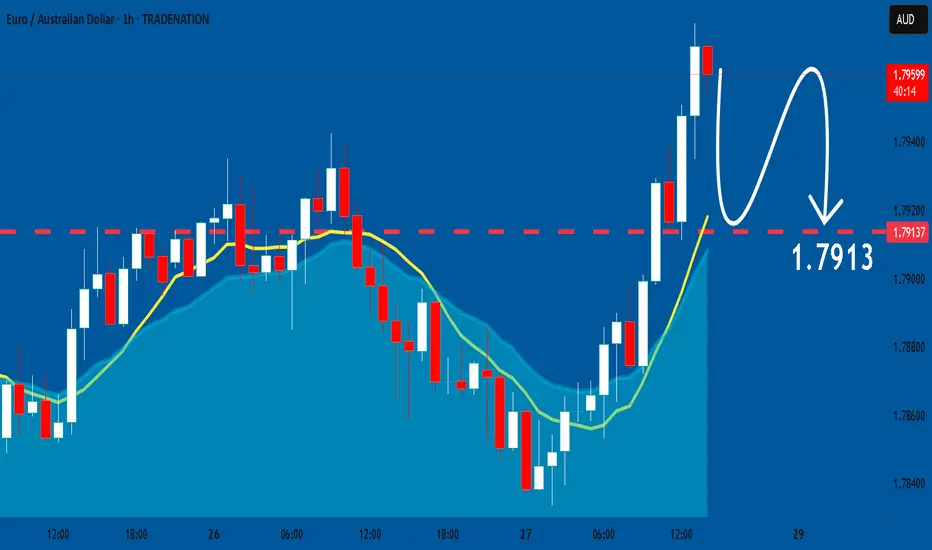
EUR_AUD LOCAL SHORT|
✅EUR_AUD is going up now
But a strong resistance level is ahead at 1.8018
Thus I am expecting a pullback
And a move down towards the target of 1.7900
SHORT🔥
✅Like and subscribe to never miss a new idea!✅
Disclosure: I am part of Trade Nation's Influencer program and receive a monthly fee for using their TradingView charts in my analysis.
AUD (Australian Dollar)

AUDJPY 4hour TF - June 29th, 2025AUDJPY 4hour Neutral Idea
Monthly - Bullish
Weekly - Bearish
Dailly - Bearish
4hour - Ranging
AJ is currently sitting at a major daily resistance area around 94.500. We have to wait for price action to make a move and show some conviction before we can become confident in a setup.
Lucky us, price action is usually easy to follow when waiting for a break of a range. The way I see it, we have two great options.
Bullish Breakout - In the scenario where we see price action break above the 94.500 zone we will look for long setups. Ideally, we spot some clear higher lows above 94.500 with strong bullish conviction. Look to target higher resistance levels like 96.500.
Bearish Continuation - If we see this resistance level at 94.500 continue to hold we could see a daily bearish continuation happen. Look for strong bearish candles rejecting the current zone followed by clear lower highs. We’re targeting lower if that happens to around the 92.000 area.

AUDJPY WEEKLY HIGHER TIME FRAME FORECAST Q3 W27 Y25AUDJPY WEEKLY HIGHER TIME FRAME FORECAST Q3 W27 Y25
Professional Risk Managers👋
Welcome back to another FRGNT chart update📈
Diving into some Forex setups using predominantly higher time frame order blocks alongside confirmation breaks of structure.
Let’s see what price action is telling us today! 👀
💡Here are some trade confluences📝
✅Weekly 50EMA Rejection
✅Daily Order block identified
✅1H Order Block identified
🔑 Remember, to participate in trading comes always with a degree of risk, therefore as professional risk managers it remains vital that we stick to our risk management plan as well as our trading strategies.
📈The rest, we leave to the balance of probabilities.
💡Fail to plan. Plan to fail.
🏆It has always been that simple.
❤️Good luck with your trading journey, I shall see you at the very top.
🎯Trade consistent, FRGNT X

AUD_NZD LOCAL LONG|
✅AUD_NZD is trading along the rising support line
And as the pair is going up now
After the retest of the line
I am expecting the price to keep growing
To retest the supply levels above at 1.0789
LONG🚀
✅Like and subscribe to never miss a new idea!✅
Disclosure: I am part of Trade Nation's Influencer program and receive a monthly fee for using their TradingView charts in my analysis.

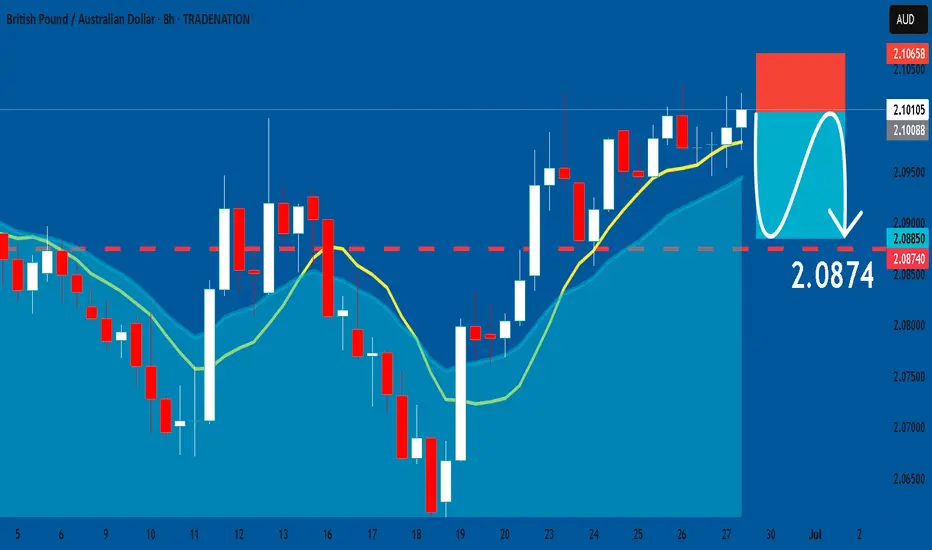
GBPAUD: Short Trade Explained
GBPAUD
- Classic bearish formation
- Our team expects fall
SUGGESTED TRADE:
Swing Trade
Sell GBPAUD
Entry Level - 2.1010
Sl - 2.1065
Tp - 2.0874
Our Risk - 1%
Start protection of your profits from lower levels
Disclosure: I am part of Trade Nation's Influencer program and receive a monthly fee for using their TradingView charts in my analysis.
❤️ Please, support our work with like & comment! ❤️
EUR/AUD BEST PLACE TO SELL FROM|SHORT
Hello, Friends!
We are going short on the EUR/AUD with the target of 1.772 level, because the pair is overbought and will soon hit the resistance line above. We deduced the overbought condition from the price being near to the upper BB band. However, we should use low risk here because the 1W TF is green and gives us a counter-signal.
Disclosure: I am part of Trade Nation's Influencer program and receive a monthly fee for using their TradingView charts in my analysis.
✅LIKE AND COMMENT MY IDEAS✅

AUDNZD The Target Is DOWN! SELL!
My dear followers,
I analysed this chart on AUDNZD and concluded the following:
The market is trading on 1.0803 pivot level.
Bias - Bearish
Technical Indicators: Both Super Trend & Pivot HL indicate a highly probable Bearish continuation.
Target - 1.0792
About Used Indicators:
A super-trend indicator is plotted on either above or below the closing price to signal a buy or sell. The indicator changes color, based on whether or not you should be buying. If the super-trend indicator moves below the closing price, the indicator turns green, and it signals an entry point or points to buy.
Disclosure: I am part of Trade Nation's Influencer program and receive a monthly fee for using their TradingView charts in my analysis.
———————————
WISH YOU ALL LUCK

EURAUD: Weak Market & Bearish Continuation
The charts are full of distraction, disturbance and are a graveyard of fear and greed which shall not cloud our judgement on the current state of affairs in the EURAUD pair price action which suggests a high likelihood of a coming move down.
Disclosure: I am part of Trade Nation's Influencer program and receive a monthly fee for using their TradingView charts in my analysis.
❤️ Please, support our work with like & comment! ❤️
AUDNZD On The Rise! BUY!
My dear followers,
This is my opinion on the AUDNZD next move:
The asset is approaching an important pivot point 1.0782
Bias - Bullish
Technical Indicators: Supper Trend generates a clear long signal while Pivot Point HL is currently determining the overall Bullish trend of the market.
Goal - 1.0797
About Used Indicators:
For more efficient signals, super-trend is used in combination with other indicators like Pivot Points.
Disclosure: I am part of Trade Nation's Influencer program and receive a monthly fee for using their TradingView charts in my analysis.
———————————
WISH YOU ALL LUCK

AUDCHF - ShortI have been short on AUDCHF for a few days. Here's my breakdown:
Technical:
- Descending channel
- Strong resistance on the upper channel line
- Potential descending triangle forming, suggesting continuation of this downtrend
- Following the overall trend of this pair, which is bearish
Fundamental:
- Risk off mood globally, CHF is a safe haven currency
- Dovish RBA
- Commodity pressure on AUD
- SNB stability

AUDJPY SHORT FORECAST Q2 W26 D27 Y25AUDJPY SHORT FORECAST Q2 W26 D27 Y25
Professional Risk Managers👋
Welcome back to another FRGNT chart update📈
Diving into some Forex setups using predominantly higher time frame order blocks alongside confirmation breaks of structure.
Let’s see what price action is telling us today! 👀
💡Here are some trade confluences📝
✅Weekly Order Block Identified
✅Daily Order block identified
✅4H Order Block identified
✅15' Order block identified
🔑 Remember, to participate in trading comes always with a degree of risk, therefore as professional risk managers it remains vital that we stick to our risk management plan as well as our trading strategies.
📈The rest, we leave to the balance of probabilities.
💡Fail to plan. Plan to fail.
🏆It has always been that simple.
❤️Good luck with your trading journey, I shall see you at the very top.
🎯Trade consistent, FRGNT X

AUD_CHF LONG SIGNAL|
✅AUD_CHF was trading in a
Strong downtrend but then
Has reached a strong horizontal
Demand area around 0.5215
And failed to break the level
Which means that the bearish
Impulse might be absorbed
And we will finally see a
Bullish move up so we can
Enter a long trade with the
TP of 0.5276 and the SL of 0.5212
LONG🚀
✅Like and subscribe to never miss a new idea!✅
Disclosure: I am part of Trade Nation's Influencer program and receive a monthly fee for using their TradingView charts in my analysis.

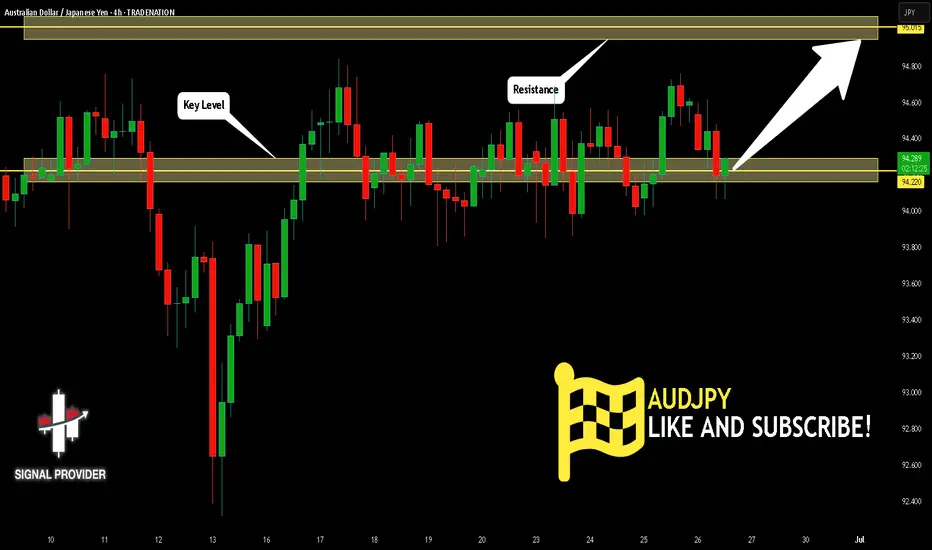
AUDJPY Is Bullish! Long!
Here is our detailed technical review for AUDJPY.
Time Frame: 4h
Current Trend: Bullish
Sentiment: Oversold (based on 7-period RSI)
Forecast: Bullish
The market is trading around a solid horizontal structure 94.220.
The above observations make me that the market will inevitably achieve 95.015 level.
P.S
Please, note that an oversold/overbought condition can last for a long time, and therefore being oversold/overbought doesn't mean a price rally will come soon, or at all.
Disclosure: I am part of Trade Nation's Influencer program and receive a monthly fee for using their TradingView charts in my analysis.
Like and subscribe and comment my ideas if you enjoy them!
AUDCHF at Make-or-Break Zone: Smart Money Reversal or Breakdown?1. Price Action
Price is currently trading within a descending channel, with 0.5244 hovering near a key demand zone (0.5150–0.5200), where a first bullish reaction has already occurred.
The structure suggests a potential fake breakdown, with room for a rebound toward static resistances at 0.5330, and possibly 0.5450.
RSI is rising from oversold, showing signs of a potential bullish divergence.
📌 Technical bias: Waiting for confirmation of a reversal at key support.
Upside targets: 0.5330 > 0.5450.
Ideal stop-loss below 0.5160.
2. Retail Sentiment
72% of retail traders are long, with an average entry at 0.5551, now facing a 300+ pip drawdown.
This increases short-term contrarian bearish pressure, but also signals liquidity above the highs, which could be targeted before a true bullish reversal.
3. Commitment of Traders (as of June 17, 2025)
AUD – Bearish
Massive drop in both commercial longs (-60k) and shorts (-60k) suggests broad disengagement.
Non-commercials remain net short (-69k), with overall open interest declining.
CHF – Neutral to Bullish
CHF also sees declines in positioning, but commercial traders remain firmly net long (+51.7k).
Non-commercials are net short (-25.5k).
📌 COT Conclusion: AUD remains structurally weaker than CHF, but both currencies are showing signs of positioning uncertainty. This compression phase may precede a technical rebound on AUDCHF.
4. Seasonality
AUD
June historically shows modest strength on 10Y and 5Y averages.
However, 2Y data points to weakness → any rally may be short-lived or fragile.
CHF
CHF tends to be strong in June, especially on 20Y and 10Y views.
Yet, short-term (2Y) data shows end-of-month weakness, suggesting possible profit-taking ahead.
✅ Operational Outlook
Short-term bias: Long AUDCHF (corrective rebound)
Medium/long-term bias: Bearish (still in a downtrend)

AUDJPY SHORT FORECAST Q2 W26 D26 Y25AUDJPY SHORT FORECAST Q2 W26 D26 Y25
Professional Risk Managers👋
Welcome back to another FRGNT chart update📈
Diving into some Forex setups using predominantly higher time frame order blocks alongside confirmation breaks of structure.
Let’s see what price action is telling us today! 👀
💡Here are some trade confluences📝
✅Weekly Order Block Identified
✅Daily Order block identified
✅4H Order Block identified
✅15' Order block identified
🔑 Remember, to participate in trading comes always with a degree of risk, therefore as professional risk managers it remains vital that we stick to our risk management plan as well as our trading strategies.
📈The rest, we leave to the balance of probabilities.
💡Fail to plan. Plan to fail.
🏆It has always been that simple.
❤️Good luck with your trading journey, I shall see you at the very top.
🎯Trade consistent, FRGNT X

EURAUD to continue in the sequence of higher lows?EURAUD - 24h expiry
The primary trend remains bullish.
Short term RSI is moving lower.
Preferred trade is to buy on dips.
Risk/Reward would be poor to call a buy from current levels.
Bespoke support is located at 1.7840.
We look to Buy at 1.7840 (stop at 1.7805)
Our profit targets will be 1.7980 and 1.8000
Resistance: 1.7920 / 1.7990 / 1.8020
Support: 1.7800 / 1.7750 / 1.7710
Risk Disclaimer
The trade ideas beyond this page are for informational purposes only and do not constitute investment advice or a solicitation to trade. This information is provided by Signal Centre, a third-party unaffiliated with OANDA, and is intended for general circulation only. OANDA does not guarantee the accuracy of this information and assumes no responsibilities for the information provided by the third party. The information does not take into account the specific investment objectives, financial situation, or particular needs of any particular person. You should take into account your specific investment objectives, financial situation, and particular needs before making a commitment to trade, including seeking advice from an independent financial adviser regarding the suitability of the investment, under a separate engagement, as you deem fit.
You accept that you assume all risks in independently viewing the contents and selecting a chosen strategy.
Where the research is distributed in Singapore to a person who is not an Accredited Investor, Expert Investor or an Institutional Investor, Oanda Asia Pacific Pte Ltd (“OAP“) accepts legal responsibility for the contents of the report to such persons only to the extent required by law. Singapore customers should contact OAP at 6579 8289 for matters arising from, or in connection with, the information/research distributed.

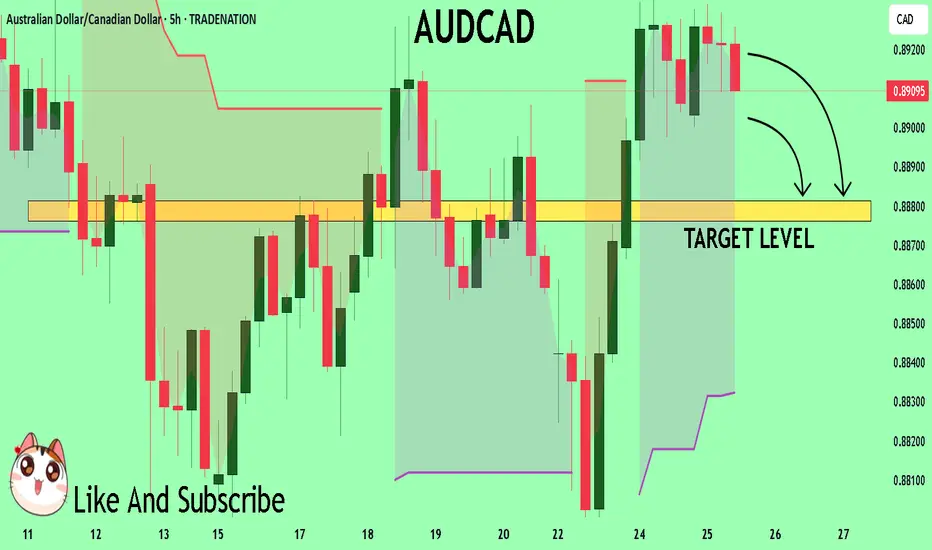
Bullish momentum to extend?AUD/CAD has bounced off the support level which is a pullback support and could potentially rise from this level to our take profit.
Entry: 0.89033
Why we like it:
There is a pullback support level.
Stop loss: 0.8858
Why we like it:
There is a pullback support level.
Take profit: 0.9009
Why we like it:
There is a pullback resistance that is slightly below the 161.8% Fibonacci extension.
Enjoying your TradingView experience? Review us!
Please be advised that the information presented on TradingView is provided to Vantage (‘Vantage Global Limited’, ‘we’) by a third-party provider (‘Everest Fortune Group’). Please be reminded that you are solely responsible for the trading decisions on your account. There is a very high degree of risk involved in trading. Any information and/or content is intended entirely for research, educational and informational purposes only and does not constitute investment or consultation advice or investment strategy. The information is not tailored to the investment needs of any specific person and therefore does not involve a consideration of any of the investment objectives, financial situation or needs of any viewer that may receive it. Kindly also note that past performance is not a reliable indicator of future results. Actual results may differ materially from those anticipated in forward-looking or past performance statements. We assume no liability as to the accuracy or completeness of any of the information and/or content provided herein and the Company cannot be held responsible for any omission, mistake nor for any loss or damage including without limitation to any loss of profit which may arise from reliance on any information supplied by Everest Fortune Group.

AUD-NZD Long From Rising Support! Buy!
Hello,Traders!
AUD-NZD went down but
Will soon retest a rising
Support line from where
We will be expecting a
Bullish rebound and a move up
Buy!
Comment and subscribe to help us grow!
Check out other forecasts below too!
Disclosure: I am part of Trade Nation's Influencer program and receive a monthly fee for using their TradingView charts in my analysis.

AUD_JPY LOCAL SHORT|
✅AUD_JPY made a retest of the
Strong horizontal resistance level of 94.800
And as you can see the pair is already
Making a local pullback from
The level which sends a clear
Bearish signal to us therefore
We will be expecting a
Further bearish correction
SHORT🔥
✅Like and subscribe to never miss a new idea!✅
Disclosure: I am part of Trade Nation's Influencer program and receive a monthly fee for using their TradingView charts in my analysis.

AUDCAD Massive Short! SELL!
My dear friends,
AUDCAD looks like it will make a good move, and here are the details:
The market is trading on 0.8911 pivot level.
Bias - Bearish
Technical Indicators: Supper Trend generates a clear short signal while Pivot Point HL is currently determining the overall Bearish trend of the market.
Goal - 0.8881
About Used Indicators:
Pivot points are a great way to identify areas of support and resistance, but they work best when combined with other kinds of technical analysis
Disclosure: I am part of Trade Nation's Influencer program and receive a monthly fee for using their TradingView charts in my analysis.
———————————
WISH YOU ALL LUCK
AUDJPY Under Pressure! SELL!
My dear subscribers,
This is my opinion on the AUDJPY next move:
The instrument tests an important psychological level 94.650
Bias - Bearish
Technical Indicators: Supper Trend gives a precise Bearish signal, while Pivot Point HL predicts price changes and potential reversals in the market.
Target - 94.434
About Used Indicators:
On the subsequent day, trading above the pivot point is thought to indicate ongoing bullish sentiment, while trading below the pivot point indicates bearish sentiment.
Disclosure: I am part of Trade Nation's Influencer program and receive a monthly fee for using their TradingView charts in my analysis.
———————————
WISH YOU ALL LUCK

AUDJPY DETAILED ANALYSISAUDJPY has successfully completed a breakout from a bullish pennant structure on the 4H timeframe, signaling the beginning of a strong upward continuation move. After a sustained consolidation below descending resistance, price action has now pierced through the upper trendline with volume and follow-through momentum. The breakout is aligned with the prior bullish leg from mid-June, indicating trend continuation. I’m now targeting 96.500 as the next key price level, with current price holding firm at 94.500.
Fundamentally, the Australian Dollar remains supported by recent hawkish RBA expectations. Traders are now pricing in the possibility of another rate hike following sticky inflation data out of Australia. The latest CPI print showed an annualized rise above 4%, exceeding forecasts, and reinforcing the case for tighter monetary policy. In contrast, the Japanese Yen continues to weaken as the Bank of Japan maintains its dovish tone, with no immediate signs of rate normalization. The ongoing yield divergence continues to fuel bullish flows into AUDJPY.
Today’s market sentiment favors risk-on assets, and AUD typically benefits in such conditions. Global equity strength and higher commodity prices are further backing AUD's upside momentum. Moreover, with carry trade flows increasing as investors seek higher-yielding currencies, AUDJPY is well-positioned to benefit from both fundamental tailwinds and technical breakout confirmation.
This setup is technically clean and fundamentally strong. Pullbacks toward the 94.100–93.900 zone could be retested as new support before the pair extends higher. As long as price holds above the breakout level, I remain bullish with 96.500 as my primary upside target. This pair is offering a high-probability continuation play in alignment with both macro and micro structure.

AUD/USD, AUD/JPY: Soft CPI A Gift For RBA Doves?I have long said that the RBA could cut in July, and today's CPI figures all but confirm one is on tap. But with AUD/USD and AUD/JPY are rising, will bears get their say?
Matt Simpson, Market Analyst at City Index and Forex.com
