AUD-CAD Will Go Down! Sell!
Hello,Traders!
AUD-CAD made a retest
Of the wide horizontal
Resistance around 0.8934
And we are already seeing a
Local bearish reaction so
We will be expecting a
Further bearish move down
Sell!
Comment and subscribe to help us grow!
Check out other forecasts below too!
Disclosure: I am part of Trade Nation's Influencer program and receive a monthly fee for using their TradingView charts in my analysis.
AUD (Australian Dollar)

GBP/AUD Triple-Top Resistance Test – Watch for Reversal or BreakThe GBP/AUD pair is currently testing a strong horizontal resistance zone near 2.1000, which has been rejected multiple times in the past. The chart clearly highlights a triple-top formation (marked by red arrows), signaling repeated failures to break above this supply area. Meanwhile, the price action has been respecting an upward trendline support, forming a broad ascending channel or rising wedge-like structure.
This setup is now at a critical juncture — with the potential for either a strong bullish breakout or a bearish reversal.
📉 Bearish Rejection Scenario
If the resistance holds once again, we may see a pullback toward the rising support line around 2.0700. This would maintain the overall sideways-to-bullish bias within the structure. A firm rejection pattern (e.g., bearish engulfing or long upper wick) near 2.1000 could provide confirmation for short entries targeting that support.
📈 Bullish Breakout Scenario
On the other hand, a decisive breakout above 2.1000 — especially with strong volume and candle close — could trigger a breakout rally. If confirmed, the next leg up may drive GBP/AUD toward 2.1250–2.1300, based on the previous swing expansion zones.
🧭 Strategic Outlook
Sell near resistance: Target 2.0750–2.0700 with SL above 2.1020.
Buy on breakout: Enter above 2.1010–2.1025 with targets near 2.1250.
Confirmation required: Wait for candle confirmation (break or rejection) before acting.
This setup offers a clear risk-managed opportunity in either direction, ideal for breakout traders or reversal players.
=================================================================
Disclosure: I am part of Trade Nation's Influencer program and receive a monthly fee for using their TradingView charts in my analysis.
=================================================================

#EURAUD: Two Swing Bullish Entry Worth Thousands Pips! EURAUD is currently at a critical level, and the price isn’t yet decided for the next move. However, the current price behaviour suggests strong bullish volume presence in the market. There are two areas to buy from. The first is activated, and we think price could just be starting the next bull run from this point. The second entry is a safe point if price does decide to drop further and fill up the daily Fair Value Gap.
We wish you the best in trading.
If you want to support us, you can do the following:
- Like the idea
- Comment on the idea
- Share the idea
If you have any questions or concerns about the analysis or trading in general, please let us know in the comment box.
Team Setupsfx_
❤️🚀

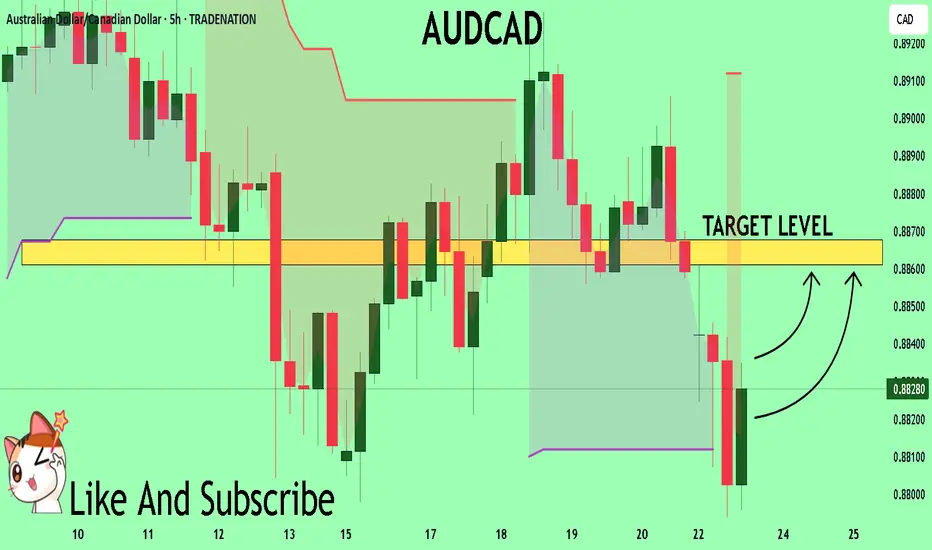
AUDCAD The Target Is UP! BUY!
My dear subscribers,
AUDCAD looks like it will make a good move, and here are the details:
The market is trading on 0.8830 pivot level.
Bias - Bullish
Technical Indicators: Both Super Trend & Pivot HL indicate a highly probable Bullish continuation.
Target - 0.8861
About Used Indicators:
The average true range (ATR) plays an important role in 'Supertrend' as the indicator uses ATR to calculate its value. The ATR indicator signals the degree of price volatility.
Disclosure: I am part of Trade Nation's Influencer program and receive a monthly fee for using their TradingView charts in my analysis.
———————————
WISH YOU ALL LUCK
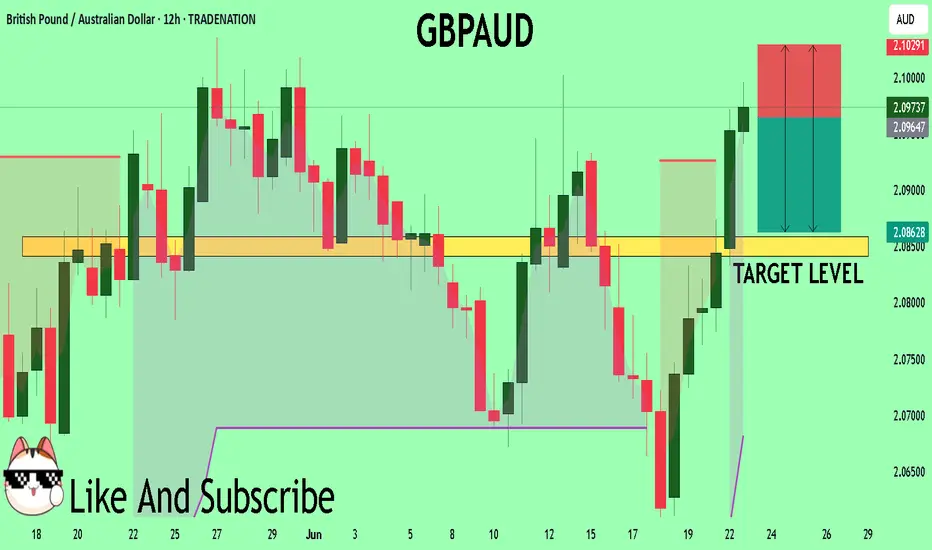
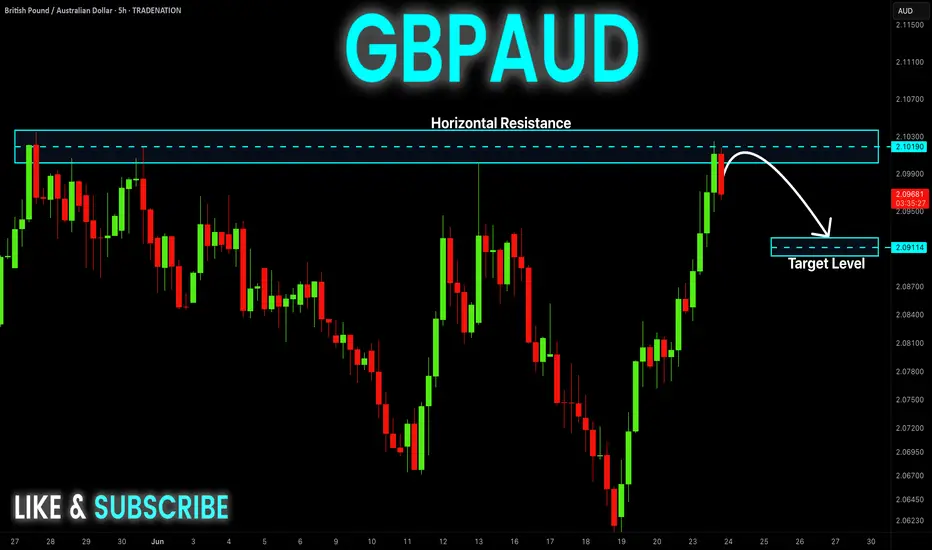
GBPAUD Trading Opportunity! SELL!
My dear friends,
Please, find my technical outlook for GBPAUD below:
The price is coiling around a solid key level - 2.0968
Bias - Bearish
Technical Indicators: Pivot Points Lowanticipates a potential price reversal.
Super trend shows a clear sell, giving a perfect indicators' convergence.
Goal - 2.0858
Safe Stop Loss - 2.1029
About Used Indicators:
The pivot point itself is simply the average of the high, low and closing prices from the previous trading day.
Disclosure: I am part of Trade Nation's Influencer program and receive a monthly fee for using their TradingView charts in my analysis.
———————————
WISH YOU ALL LUCK
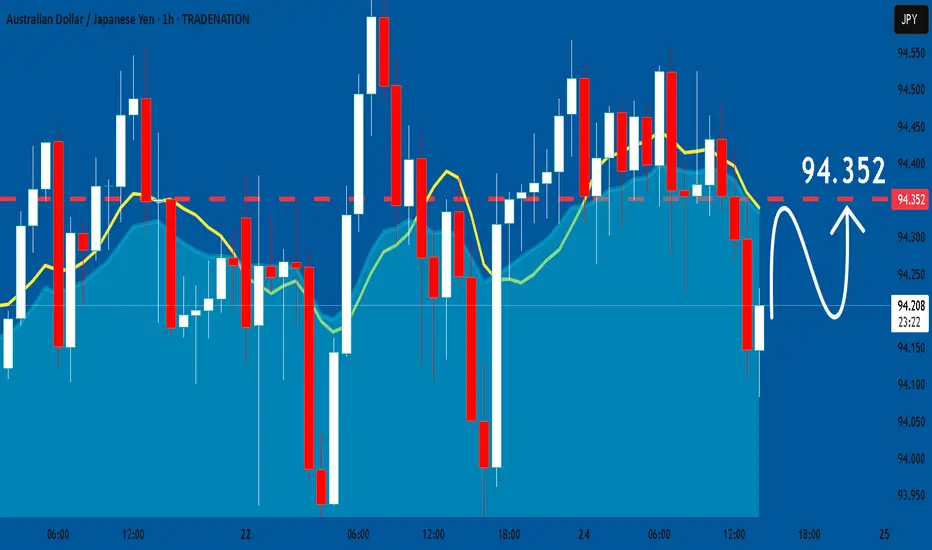
AUDJPY: Bulls Will Push Higher
The analysis of the AUDJPY chart clearly shows us that the pair is finally about to go up due to the rising pressure from the buyers.
Disclosure: I am part of Trade Nation's Influencer program and receive a monthly fee for using their TradingView charts in my analysis.
❤️ Please, support our work with like & comment! ❤️
EURAUD: Possible Swing Movement of 660 pips expected! FX:EURAUD on daily candles of last few days breakthrough and now dropping back to demand zone where we expect price to bounce strongly and at least we expect target one to accomplished by end of January. While target two and three remain a long away from our current price area. Stop Loss should be below the strong wick of daily candle.
From fundamentals side AUD will be weaken and EURO can be bullish for next few months, taking entry will require a strict risk management as this is a swing trade, do not expect to achieve the target in couple of hours or days.
Good luck and trade safe.

#EURAUD: Daily Timeframe Suggest Major Price Correction! EURAUD is currently implementing a significant correction, which could potentially be advantageous for swing traders like ourselves. This correction presents an opportunity to execute swing trades.
There are two potential entry points for swing trades: a risky trade and a safer trade option.
Best of luck and trade safely!
Warm regards ❤️
Team Setupsfx_

#EURAUD: Two Major Buying Zones|, Which One Are You In? Hey Everyone
Following a substantial bullish candle, the price failed to maintain the bullish momentum and swiftly transitioned into a bearish position, effectively eradicating the bullish gain. Nevertheless, we remain optimistic that the price will retain its bullish trend in the upcoming weeks. We have identified two potential areas where price may reverse from either of the two zones. You are welcome to set take profit and stop loss orders based on your own investment strategy. It is advisable to closely monitor the prices before making any trading decisions.
We extend our sincere best wishes and best of luck in your trading endeavours. Your unwavering support is greatly valued.
If you wish to contribute, we have provided several avenues for your assistance:
- Liking our ideas
- Commenting on our ideas
- Sharing our ideas
Team Setupsfx_🚀❤️

EURAUD – Rejection From Resistance: Bearish Momentum BuildingThe recent rally on EURAUD has met strong rejection near the 1.7980–1.8000 supply zone, signaling exhaustion of bullish momentum. With price forming a clear lower high and pushing away from the upper range, traders may be eyeing short setups targeting deeper fib retracements. Here's how the fundamentals align with the technical picture:
🔻 Bias: Bearish
🔑 Key Fundamentals
Eurozone: While the German Ifo business sentiment has improved, hard data (like industrial output) remains weak. ECB speakers such as Panetta and Knot continue to lean dovish, signaling no urgency for further tightening.
Australia: The AUD is finding strength from a risk-on global environment, falling oil prices (positive for AUD importers), and stability in China-sensitive commodities. The RBA remains relatively hawkish versus the ECB.
Yield Spread: Euro-Australia rate differentials are narrowing, reducing EUR’s relative appeal.
⚠️ Risks to Bias
Unexpected Hawkish ECB Commentary
Risk-Off Event (e.g., equity sell-off or new geopolitical tensions) that could weaken AUD
China PMI Miss dragging AUD if demand outlook sours
📅 News/Events to Watch
June 28: U.S. Core PCE (Fed impact → EURUSD spillover)
June 30: China PMIs (key for AUD demand outlook)
Ongoing: ECB member speeches, Eurozone CPI prelims
🔄 Potential Leader
AUD Crosses (e.g., AUDJPY, AUDUSD) may lead broader moves if China PMI surprises or if commodities rebound further.
This technical rejection from the key resistance zone aligns with the macro shift favoring AUD strength over EUR. As long as price stays below the 1.7980–1.8000 zone, EURAUD may slide toward 1.7730, 1.7595, and even 1.7460 in extension.
🔔 Trade idea: Watch for bearish confirmation on the H4 close below 1.7830 to validate momentum continuation.

EURAUD corrective pullback support at 1.7740Trend Overview:
The EURAUD currency pair maintains a bullish outlook, supported by an established rising trend. Recent intraday movement reflects a corrective pullback, potentially offering a buying opportunity within the broader uptrend.
Key Levels to Watch:
Support (Key Level):
1.7740 – former consolidation zone and a pivotal support level
Below that: 1.7700, then 1.7640 as deeper pullback zones
Resistance:
Initial upside target: 1.7950
Further resistance at 1.7990 and 1.8040
Scenarios:
Bullish Continuation:A rebound from 1.7740 would affirm ongoing bullish sentiment
Expected to push price toward 1.7950, followed by 1.7990 and 1.8040 in the medium term
Bearish Reversal:
A daily close below 1.7740 would weaken the bullish case
Opens the door for a broader correction targeting 1.7700, then 1.7640
Conclusion:
EURAUD remains bullish within a rising trend, with 1.7740 acting as the key level for near-term direction. A successful defense of this support may trigger a renewed rally. Conversely, a break and close below it could lead to further downside pressure. Traders should monitor price action closely around this zone for confirmation.
This communication is for informational purposes only and should not be viewed as any form of recommendation as to a particular course of action or as investment advice. It is not intended as an offer or solicitation for the purchase or sale of any financial instrument or as an official confirmation of any transaction. Opinions, estimates and assumptions expressed herein are made as of the date of this communication and are subject to change without notice. This communication has been prepared based upon information, including market prices, data and other information, believed to be reliable; however, Trade Nation does not warrant its completeness or accuracy. All market prices and market data contained in or attached to this communication are indicative and subject to change without notice.

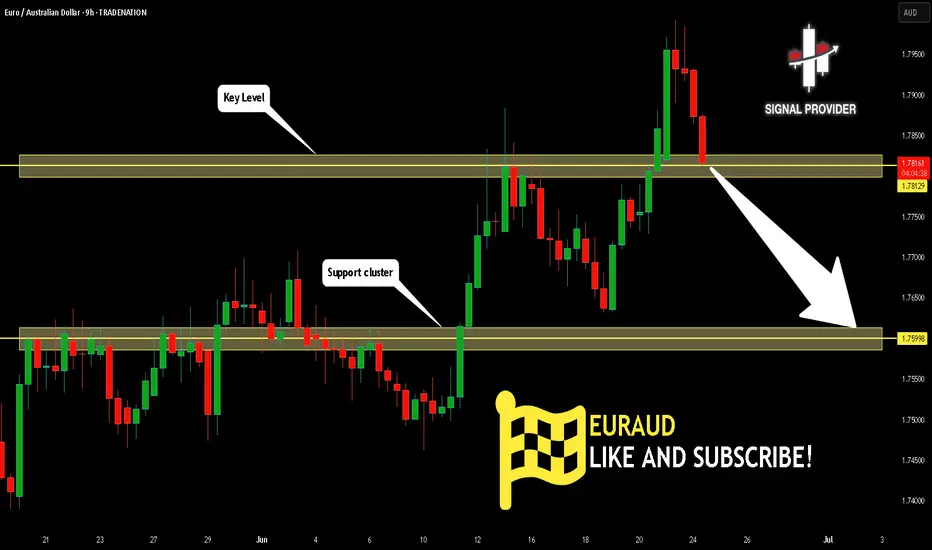
EURAUD Is Bearish! Short!
Here is our detailed technical review for EURAUD.
Time Frame: 9h
Current Trend: Bearish
Sentiment: Overbought (based on 7-period RSI)
Forecast: Bearish
The market is approaching a significant resistance area 1.781.
Due to the fact that we see a positive bearish reaction from the underlined area, I strongly believe that sellers will manage to push the price all the way down to 1.759 level.
P.S
The term oversold refers to a condition where an asset has traded lower in price and has the potential for a price bounce.
Overbought refers to market scenarios where the instrument is traded considerably higher than its fair value. Overvaluation is caused by market sentiments when there is positive news.
Disclosure: I am part of Trade Nation's Influencer program and receive a monthly fee for using their TradingView charts in my analysis.
Like and subscribe and comment my ideas if you enjoy them!
AUD/CAD BEST PLACE TO SELL FROM|SHORT
Hello, Friends!
We are now examining the AUD/CAD pair and we can see that the pair is going up locally while also being in a uptrend on the 1W TF. But there is also a powerful signal from the BB upper band being nearby, indicating that the pair is overbought so we can go short from the resistance line above and a target at 0.885 level.
Disclosure: I am part of Trade Nation's Influencer program and receive a monthly fee for using their TradingView charts in my analysis.
✅LIKE AND COMMENT MY IDEAS✅

GBPAUD XABCD Short from PRZ/D TP1/TP2 Swing Trade🔸Hello traders, let's review the 20 MINUTE chart for GBPAUD. Strong gains off the lows recently, however price getting overextended and expecting reversal later at/near PRZ/D.
🔸Speculative XABCD structure defined by point X 1000 point A 0700 point B 0930 point C 0640 point D/PRZ 1080 still pending.
🔸Currently most points validated, point D/PRZ still pending 1080, so traders should wait until we hit D before SHORTING.
🔸Recommended strategy for GA traders: wait for price to max out to complete at point D near 1080, short/hold, SL 80 pips, TP1/TP2/TP3 0940/0840/0780. SHORT/HOLD at point D/PRZ at 1080 swing trade setup. keep in mind this is a swing trade setup, patience required.
🎁Please hit the like button and
🎁Leave a comment to support our team!
RISK DISCLAIMER:
Trading Futures , Forex, CFDs and Stocks involves a risk of loss.
Please consider carefully if such trading is appropriate for you.
Past performance is not indicative of future results.
Always limit your leverage and use tight stop loss.

AUDJPY SHORT FORECAST Q2 W26 D24 Y25AUDJPY SHORT FORECAST Q2 W26 D24 Y25
Professional Risk Managers👋
Welcome back to another FRGNT chart update📈
Diving into some Forex setups using predominantly higher time frame order blocks alongside confirmation breaks of structure.
Let’s see what price action is telling us today! 👀
💡Here are some trade confluences📝
✅Weekly Order Block Identified
✅Daily Order block identified
✅4H Order Block identified
✅15' Order block identified
🔑 Remember, to participate in trading comes always with a degree of risk, therefore as professional risk managers it remains vital that we stick to our risk management plan as well as our trading strategies.
📈The rest, we leave to the balance of probabilities.
💡Fail to plan. Plan to fail.
🏆It has always been that simple.
❤️Good luck with your trading journey, I shall see you at the very top.
🎯Trade consistent, FRGNT X

EUR_AUD WILL KEEP GROWING|LONG|
✅EUR_AUD is trading in an
Uptrend and the pair is
About to retest the broken
Key level of 1.7850 which is
Now a support so we are
Bullish biased and we will be
Expecting a local bullish rebound
LONG🚀
✅Like and subscribe to never miss a new idea!✅
Disclosure: I am part of Trade Nation's Influencer program and receive a monthly fee for using their TradingView charts in my analysis.

AUDJPY - Potential Short at the upper supply liquidity levelLooking for the potential short, only valid with bearish PA around the upper supply level, ideally sweeping the upper level of liquidity around 94.400-94.405. Bearish PA then bring this trade down.

AUD_CHF POTENTIAL LONG|
✅AUD_CHF fell down sharply
But a strong support level was hit at 0.5214
Thus as a rebound is already happening
A move up towards the target of 0.5255 shall follow
LONG🚀
✅Like and subscribe to never miss a new idea!✅
Disclosure: I am part of Trade Nation's Influencer program and receive a monthly fee for using their TradingView charts in my analysis.

AUD_NZD LOCAL LONG|
✅AUD_NZD has retested a key support level of 1.0800
And as the pair is already making a bullish rebound
A move up to retest the supply level above at 1.0820 is likely
LONG🚀
✅Like and subscribe to never miss a new idea!✅
Disclosure: I am part of Trade Nation's Influencer program and receive a monthly fee for using their TradingView charts in my analysis.

GBP-AUD Local Short! Sell!
Hello,Traders!
GBP-AUD made a retest of
The horizontal resistance
Of 2.1037 from where we
Are already seeing a bearish
Pullback so we will be
Expecting a further local
Move down
Sell!
Comment and subscribe to help us grow!
Check out other forecasts below too!
Disclosure: I am part of Trade Nation's Influencer program and receive a monthly fee for using their TradingView charts in my analysis.
AUDCAD: Long Signal with Entry/SL/TP
AUDCAD
- Classic bullish pattern
- Our team expects retracement
SUGGESTED TRADE:
Swing Trade
Buy AUDCAD
Entry - 0.8836
Stop -0.8817
Take - 0.8871
Our Risk - 1%
Start protection of your profits from lower levels
Disclosure: I am part of Trade Nation's Influencer program and receive a monthly fee for using their TradingView charts in my analysis.
❤️ Please, support our work with like & comment! ❤️

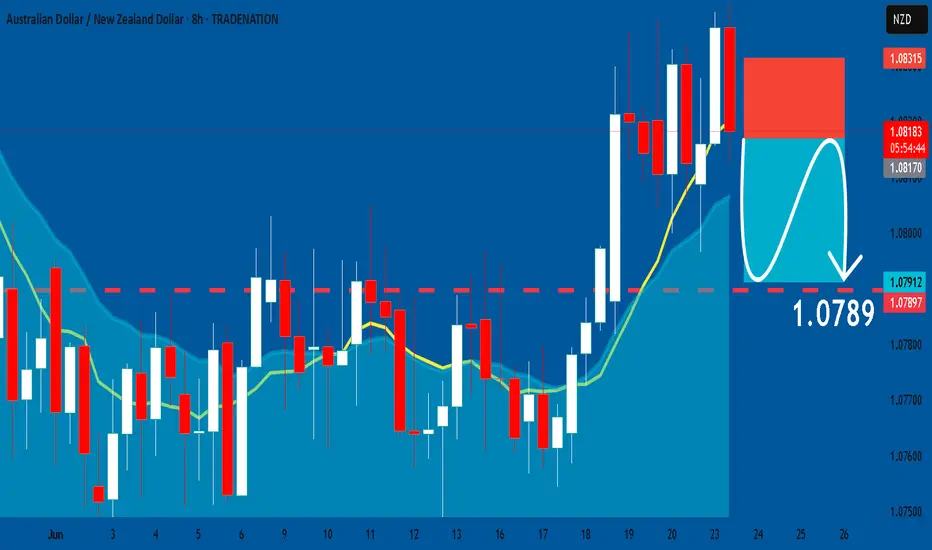
AUDNZD: Short Trading Opportunity
AUDNZD
- Classic bearish formation
- Our team expects pullback
SUGGESTED TRADE:
Swing Trade
Short AUDNZD
Entry - 1.0817
Sl - 1.0831
Tp - 1.0789
Our Risk - 1%
Start protection of your profits from lower levels
Disclosure: I am part of Trade Nation's Influencer program and receive a monthly fee for using their TradingView charts in my analysis.
❤️ Please, support our work with like & comment! ❤️
AUDCHF: Growth & Bullish Forecast
Looking at the chart of AUDCHF right now we are seeing some interesting price action on the lower timeframes. Thus a local move up seems to be quite likely.
Disclosure: I am part of Trade Nation's Influencer program and receive a monthly fee for using their TradingView charts in my analysis.
❤️ Please, support our work with like & comment! ❤️
