AUDJPY to see a temporary move lower?AUDJPY - 24h expiry - We look to Buy at 87.30 (stop at 86.60)
Previous support located at 87.50.
Previous resistance located at 88.50.
Price action has stalled at good support levels and currently trades just above here (87.50).
The correction lower is assessed as being complete.
We expect a reversal in this move.
Risk/Reward would be poor to call a buy from current levels.
A move through 88.50 will confirm the bullish momentum.
Our profit targets will be 89.00 and 89.30
Resistance: 88.50 / 89.00 / 89.50
Support: 87.50 / 87.30 / 87.00
Risk Disclaimer
The trade ideas beyond this page are for informational purposes only and do not constitute investment advice or a solicitation to trade. This information is provided by Signal Centre, a third-party unaffiliated with OANDA, and is intended for general circulation only. OANDA does not guarantee the accuracy of this information and assumes no responsibilities for the information provided by the third party. The information does not take into account the specific investment objectives, financial situation, or particular needs of any particular person. You should take into account your specific investment objectives, financial situation, and particular needs before making a commitment to trade, including seeking advice from an independent financial adviser regarding the suitability of the investment, under a separate engagement, as you deem fit.
You accept that you assume all risks in independently viewing the contents and selecting a chosen strategy.
Where the research is distributed in Singapore to a person who is not an Accredited Investor, Expert Investor or an Institutional Investor, Oanda Asia Pacific Pte Ltd (“OAP“) accepts legal responsibility for the contents of the report to such persons only to the extent required by law. Singapore customers should contact OAP at 6579 8289 for matters arising from, or in connection with, the information/research distributed.
Aud-jpy

AUDJPY Potential downsidesHey Traders, in today's trading session we are monitoring AUDJPY for a selling opportunity around 91.400 zone, AUDJPY is trading in a downtrend and now seems to be in a correction phase in which extending pullbacks are approaching the major trend around 91 resistance area. i would consider the descending channel support area as a target once bears are confirmed
Trade safe, Joe.

Joe Gun2Head Trade - Intraday reversal on AUDJPYTrade Idea: Selling AUDJPY
Reasoning: Intraday reverseal, break of a short term channel.
Entry Level: 88.906
Take Profit Level: 87.44
Stop Loss: 89.42
Risk/Reward: 2.8:1
Disclaimer – Signal Centre. Please be reminded – you alone are responsible for your trading – both gains and losses. There is a very high degree of risk involved in trading. The technical analysis , like all indicators, strategies, columns, articles and other features accessible on/though this site is for informational purposes only and should not be construed as investment advice by you. Your use of the technical analysis , as would also your use of all mentioned indicators, strategies, columns, articles and all other features, is entirely at your own risk and it is your sole responsibility to evaluate the accuracy, completeness and usefulness (including suitability) of the information. You should assess the risk of any trade with your financial adviser and make your own independent decision(s) regarding any tradable products which may be the subject matter of the technical analysis or any of the said indicators, strategies, columns, articles and all other features.

AUDJPY long idea — ascending channelAUDJPY is now in a major uptrend. It has shown to go up for a while, and it just recently broke above a major high with a push from something that looks like an ascending channel. With that being said, the best bets are to buy as long as the market keeps showing bullish power.

audjpyin my opinion aud jpy will falldown from this point or the next resistance so we have to entery point each have stop loss

Bearish Elliott Wave Sequence in AUDJPY Suggest Further DownsideAUDJPY shows a 5 swing bearish sequence from September 2022 peak favoring further downside. Cycle from 2.15.2023 high is currently in progress as a 5 waves impulse Elliott Wave structure. This cycle is mature and expected to end soon. Down from 2.15.2023 high, wave 1 ended at 91.91 and rally in wave 2 ended at 93. Pair then resumes lower again in wave 3 towards 87.33 as the 1 hour chart below shows. Rally in wave 4 ended at 89.509 with internal subdivision as a zigzag structure. Up from wave 3, wave ((a)) ended at 88.719 and wave ((b)) ended at 87.37. Final leg wave ((c)) ended at 89.509 which completed wave 4.
Wave 5 lower is now in progress with subdivision as another 5 waves impulse in lesser degree. Down from wave 4, wave ((i)) ended at 87.115 and rally in wave ((ii)) ended at 89. Pair resumes lower in wave ((iii)) towards 86.04, and wave ((iv)) is proposed complete at 87.53. Near term, as far as pivot at 89.509 high stays intact, pair has scope to extend lower before ending wave ((v)) of 5. This should also complete cycle from 2.15.2023 high and then pair should see larger degree correction higher in 3, 7, 11 swing.

AUDJPY feels a need of correction before further downsidesHey Traders, in the coming week we are monitoring AUDJPY for a selling opportunity around 88.300 zone, AUDJPY is trading in a bearish channel and now seems to reject the channel support and feels a need of correction before hitting the channel resistance around 88 resistance zone. Fundamentally we still see that JPY and CHF are attracted by investors as they are considered both a safe haven currencies in time of uncertainty in the market and not forgetting the banking sector crisis.
Trade safe, Joe.

AUDJPY - Over-Sold Zone ↗️Hello TradingView Family / Fellow Traders. This is Richard, also known as theSignalyst.
AUDJPY has been overall bearish trading inside the falling orange channel, however it is currently approaching the lower orange trendline. So we will be looking for buy setups.
Moreover, the green zone is a strong support and demand.
🏹 So the highlighted purple circle is a strong area to look for buy setups as it is the intersection of the green support and lower orange trendline. (acting as non-horizontal support)
As per my trading style:
As AUDJPY approaches the purple circle zone, I will be looking for bullish reversal setups (like a double bottom pattern, trendline break , and so on...)
📚 Always follow your trading plan regarding entry, risk management, and trade management.
Good luck!
All Strategies Are Good; If Managed Properly!
~Rich

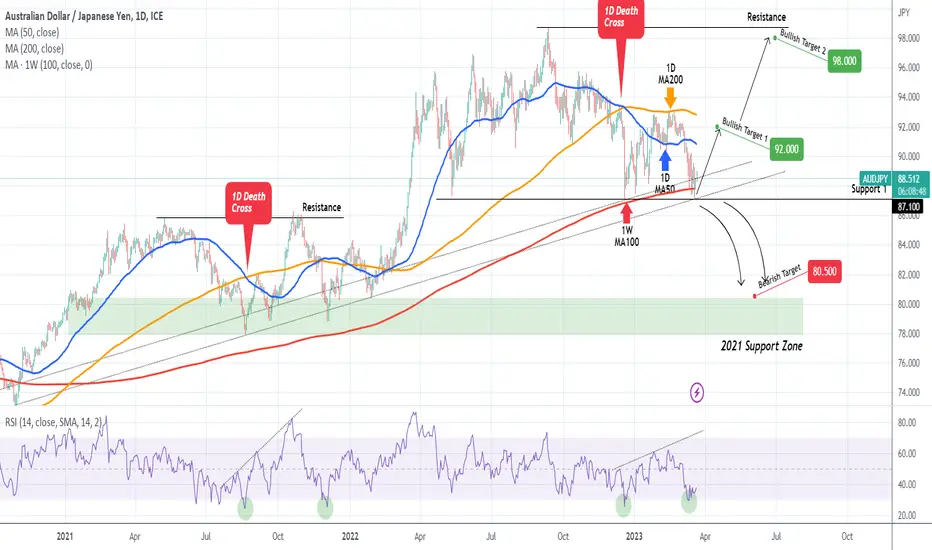
AUDJPY Testing the 2-year Higher Lows Zone.The AUDJPY pair hit last week the 1W MA100 (red trend-line) for the first time since November 04 2020, while entering the Higher Lows (dotted) Zone that started around the same time. As you understand this is a critical Support cluster, considering that Support 1 (87.100) is also holding. If broken, we will sell aiming at the top of the 2021 Support Zone at 80.500. As long as it holds, we are bullish targeting the 1D MA200 (orange trend-line) at 92.000.
Keep in mind that it was the 1D MA200 which made an exact double rejection on a potential bullish break-out on February 14 and 21. A 1D candle close above it will be a buy break-out signal for us, targeting 98.000.
-------------------------------------------------------------------------------
** Please LIKE 👍, FOLLOW ✅, SHARE 🙌 and COMMENT ✍ if you enjoy this idea! Also share your ideas and charts in the comments section below! **
-------------------------------------------------------------------------------
💸💸💸💸💸💸
👇 👇 👇 👇 👇 👇
AUDJPY - a key barometer of risk - is holding above key supportDespite the turbulence across global assets these past two weeks, AUD/JPY is opting to hold above key support and resistance levels including the 2022 low and 2021 high.
Investors remain on edge as they cannot be sure that the worst is behind us, and there is a risk that another bank will 'break' under the pressure of higher rates, bad management and / or face another bank run. But what if none of this materialises? Or the Fed is not as dovish as market pricing currently implies. Perhaps the real risk is that it's not that risky, and that could leave room for an upside surprise.
Even if AUD/JPY does break below 87.00, we'd prefer to see a break beneath the 2021 high of 86.26 before calling a major top on the weekly charts.
The fly in the ointment is the FOMC meeting, because if they're not as dovish as hoped it could pressure risk assets such as indices and AUD/JPY. Yet a dovish meeting could support sentiment and send it higher.
Either way, it is worth watching AUD/JPY around current levels as it could help signal the next likely directional move for risk assets in general.

AUDJPY: Reversal pattern on 4-hour chartOn the daily chart, the AUD/JPY pair is in a strong support area, where the yearly trendline intersects with the monthly uptrend line and a monthly zone, in addition to a bearish weekly trendline, Fibonacci 61.8%, and the 100-week moving average.
This indicates a high likelihood of strong price support at the level of 87.6. However, on the 4-hour timeframe, there are three consecutive bottoms and divergence on momentum indicators, which is a strong reversal pattern. The price needs to break through three obstacles, including a local downtrend line, a resistance level of 89.5, and the 50-period moving average on the 4-hour timeframe, before it can rise. Once these obstacles are overcome and the price stabilizes above 89.55, there will be a strong and rapid selling signal towards 91.5 as the first target and 92.8 as the second target.
-------------------------------------------------------------------------
Let me know your thoughts in the comments, and show your support by liking the idea.
Please follow if you're interested in more ideas like this.
Your support is greatly appreciated!

AUDJPY Potential DownsidesHey Traders, AUDJPY is trading in a descending channel, in the coming week i expect JPY to continue outperforming AUD as JPY is considered a safe haven in time of uncertainty in the Forex Market so it may continue to strengthen against commodity currencies and as Reserve Bank of Australia attend an 11 Years interest rate high that open a door for a pause and signals dovish interest rates hikes the coming meeting. so AUDJPY shorts should be a perfect catch.
Technically we have noticed that AUDJPY is approaching the descending channel resistance so i will be watching a potential reversal around 89 resistance zone. and i would be targeting the channel support.
feel free to ask any question in the comment section.
Trade safe, Joe.

AUDJPY to stall at current swing high.AUDJPY - Intraday - We look to Sell at 90.00 (stop at 90.75)
Previous support located at 89.00.
Previous resistance located at 89.50.
Broken out of the channel formation to the downside.
A higher correction is expected.
Further downside is expected.
Risk/Reward would be poor to call a sell from current levels.
A move through 89.00 will confirm the bearish momentum.
Our profit targets will be 88.00 and 87.00
Resistance: 89.50 / 90.00 / 90.50
Support: 89.00 / 88.00 / 87.00
Risk Disclaimer
The trade ideas beyond this page are for informational purposes only and do not constitute investment advice or a solicitation to trade. This information is provided by Signal Centre, a third-party unaffiliated with OANDA, and is intended for general circulation only. OANDA does not guarantee the accuracy of this information and assumes no responsibilities for the information provided by the third party. The information does not take into account the specific investment objectives, financial situation, or particular needs of any particular person. You should take into account your specific investment objectives, financial situation, and particular needs before making a commitment to trade, including seeking advice from an independent financial adviser regarding the suitability of the investment, under a separate engagement, as you deem fit.
You accept that you assume all risks in independently viewing the contents and selecting a chosen strategy.
Where the research is distributed in Singapore to a person who is not an Accredited Investor, Expert Investor or an Institutional Investor, Oanda Asia Pacific Pte Ltd (“OAP“) accepts legal responsibility for the contents of the report to such persons only to the extent required by law. Singapore customers should contact OAP at 6579 8289 for matters arising from, or in connection with, the information/research distributed.

AUDJPY: Buy opportunity on a 10 month Support.The AUDJPY pair hit S1 (87.350), which is a Support level that is holding for 10 months. With the 1D time frame turning momentarily oversold (RSI = 32.308, MACD = -0.610, ADX = 52.239), we regards this as a strong long term buy opportunity. TP = 92.000, some points lower than R1, as the 1D MA200 may be lowered by the time it rises to that point, and it has caused the last rejection on February 15th.
## If you like our free content follow our profile to get more daily ideas. ##
## Comments and likes are greatly appreciated. ##

AUDJPY:Breakout and Potential Retrace along with JPY strengthHey Traders, AUDJPY was trading in an uptrend and then successfully managed to break it out and now is in a correction phase. i expect a potential retrace around 89 supply and demand zone at the trend as JPY shows some strength. one of the reasons JPY is strength simply as it's considered a classic safe haven in this type of environment in which we have multiple sentiments, global inflations in which most central banks are heading into a rate hike.
Feel free to ask any question in the comment section.
Trade safe, Joe.

audjpynow there is no entry point now we have to wait the price and then enter i think it will reach the next support and we will buy then our target will be more than 400 point

AUDJPY - Quick ScalpOANDA:AUDJPY
Quick short 10pip TP scalp a few hours into Asian session.
When the signals line up, nothing to do but enjoy the ride.
Trade well
(now we stalk another one....)

AUDJPYAUDJPY has been examined in different dimensions:
1- Strong supply and demand levels that I identify with my own indicator and system.
2- The structure of recently formed waves
3- Current market momentum
4- The structure of classical and price patterns
In this idea, I identified the direction of the market in different ways and in the second step, I analyzed the potential of continuation or reversal. Usually, paying attention to the trend and strength of the trend can greatly increase the accuracy of the analysis.
In general, I tried to describe the continuation of the movement in the simplest possible way in the diagram.
⚠️ Disclaimer:
This is a personal opinion and you are responsible for any trading decisions.

AUDJPY attempting to breakoutHey traders, in the coming week we are monitoring AUDJPY for a buying opportunity around 91.8 zone, once we will receive any bullish confirmation the trade will be executed.
Trade safe, Joe.

AUDJPY - Possible H&S or Double Bottom? A double bottom is a bullish reversal pattern that forms after a downtrend, where the price hits a support level twice and bounces back up. A head and shoulders pattern is a bearish reversal pattern that forms after an uptrend, where the price makes three peaks, with the middle peak being the highest, and then drops down.
We saw price break out and above the bearish trend we had been in to then hit a resistance level at 93.00 before retesting down to 91.925 because of the volatility we saw from the news which then created a double bottom support zone. Or a right shoulder? What do you think?
📈📉 Is AUDJPY forming a double bottom or head and shoulders pattern? 🤔 This bullish and bearish reversal patterns, respectively, can provide insight into potential market moves. 📊 Keep an eye on the support levels and price action to confirm the pattern formation. 🧐 Don't forget to use other forms of analysis to make informed trading decisions. 📚 #AUDJPY #doublebottom #headandshoulders #technicalanalysis #forextrading #marketanalysis #tradingstrategy #financialmarkets #investing #tradingtips #chartpatterns

AUDJPY Potential for Bullish Rise | 14th February 2023Looking at the H4 chart, my overall bias for AUDJPY is bullish due to the current price being above the Ichimoku cloud , indicating a bullish market.
Looking for a pullback buy entry at 91.730, where the intermediary overlap support is. Stop loss will be at 90.678, where the recent low is. Take profit will be at 93.182, where the overlap resistance is.
Any opinions, news, research, analyses, prices, other information, or links to third-party sites contained on this website are provided on an "as-is" basis, as general market commentary, and do not constitute investment advice. The market commentary has not been prepared in accordance with legal requirements designed to promote the independence of investment research, and it is therefore not subject to any prohibition on dealing ahead of dissemination. Although this commentary is not produced by an independent source, FXCM takes all sufficient steps to eliminate or prevent any conflicts of interest arising out of the production and dissemination of this communication. The employees of FXCM commit to acting in the clients' best interests and represent their views without misleading, deceiving, or otherwise impairing the clients' ability to make informed investment decisions. For more information about the FXCM's internal organizational and administrative arrangements for the prevention of conflicts, please refer to the Firms' Managing Conflicts Policy. Please ensure that you read and understand our Full Disclaimer and Liability provision concerning the foregoing Information, which can be accessed on the website.

Possible bullish run for AUDJPYFocusing on the daily timeframe and spotting a bullish flag pattern on the 4H timeframe.
AUDJPY could possibly resume a bullish trend alongside YEN-related pairs like CADJPY & SHFJPY.
The pair flag pattern formation stays a little around the golden ratio of the Fibonacci level 50% and 61.6%, making a very continuation level.
There is an alternative possibility of retesting the demand area again since it left on 19 Jan.
However, I am generally bullish and that is my bullish setup, if you find it helpful you might just want to check it out.

AUDJPY Potential for Bearish Drop | 13th February 2023Looking at the H4 chart, my overall bias for AUDJPY is bearish due to the current price being below the Ichimoku cloud , indicating a bearish market.
With price tapping into my pullback sell entry at 91.259, where the overlap resistance is. Stop loss will be at 92.162, where the recent high is. Take profit will be at 88.118, where the previous swing low is.
Any opinions, news, research, analyses, prices, other information, or links to third-party sites contained on this website are provided on an "as-is" basis, as general market commentary, and do not constitute investment advice. The market commentary has not been prepared in accordance with legal requirements designed to promote the independence of investment research, and it is therefore not subject to any prohibition on dealing ahead of dissemination. Although this commentary is not produced by an independent source, FXCM takes all sufficient steps to eliminate or prevent any conflicts of interest arising out of the production and dissemination of this communication. The employees of FXCM commit to acting in the clients' best interests and represent their views without misleading, deceiving, or otherwise impairing the clients' ability to make informed investment decisions. For more information about the FXCM's internal organizational and administrative arrangements for the prevention of conflicts, please refer to the Firms' Managing Conflicts Policy. Please ensure that you read and understand our Full Disclaimer and Liability provision concerning the foregoing Information, which can be accessed on the website.
