Weekly FX Wrap: markets still hooked on Brexit saga...Weekly FX Wrap: markets still hooked on Brexit saga and gripped by pandemic
DXY
The Dollar remains on track to post solid safe haven gains vs G10 counterparts and most EM currencies, bar the YUAN that has resumed its upward trajectory with the aid of decent Chinese data and PBoC support via an aggressive reduction in the RRR for FX Forwards and forecast for a more pronounced GDP rebound in Q3. In response, the Cny and Cnh have both rebounded firmly from sub-7.7600 territory to around 6.6900 irrespective of more geopolitical, diplomatic and trade tensions between Beijing and various global peers. Back to the Buck, failure to resolve differences on US fiscal stimulus and polls pointing to a more convincing Biden victory vs Trump in early November with potential for a so called Blue clean sweep, have not hampered the Greenback for more than short, intermittent periods, while data has been mixed overall (benign CPI, firm PPI, bumper retail sales and feeble IP). Indeed, the index is midway between 93.910-005 parameters having tested both sides of the range several times and the principle factor keep the Dollar in demand is the more acute resurgence of COVID-19 spreading across Europe.
GBP
Sterling is still one of, if not the most volatile major, and largely at the whim UK-EU trade headlines that arguably reached new heights and frequency on ascent to the (mainly) Brexit Summit, with negligible slowdown in the pace or regularity in the aftermath. In short, UK PM Johnson was adamant that October 15 was the deadline to reach a deal or make meaningful progress on the 3 big issues at the very least, but a draft on Day 1 revealed shortcomings and crucially no breakthrough on fishing, and officials from both sides proceeded to lay blame for the lack of compromise on one another. Nevertheless, UK chief negotiator Frost and his EU equivalent Barnier saw enough grounds to extend talks further and the former met with Johnson to convince him to continue discussions, but evidently with only a degree of success as the PM subsequently declared that a Canada style deal will not work for Britain’s partners and its time for the nation’s businesses to prepare for the Australian version of an FTA that equates to no deal at all. But the drama did not stop there, and more episodes are in production as Brussels believes Johnson has not walked away from talks altogether even though a spox for Downing Street contends that negotiations are over and Barnier should only return to London next week if he and the EU are ready to fundamentally change stance and prepared to discuss all elements regarding a legal text or the practicalities about travel and haulage. Meanwhile, reports circulated that the EU may dangle energy as a carrot or rod to prize some leeway/flexibility from the UK on fisheries. Cable is currently circa 1.2930 within a 1.3082-1.2864 range and Eur/Gbp around 0.9065 compared to 0.9121 and 0.9008 at either end of the spectrum.
AUD/NZD
Aside from tracking broad risk sentiment and gleaning some consolation from a jobs report that was not as weak as expected, the Aussie has been undermined by RBA policy guidance from Governor Lowe all but signalling a 15 bp rate cut at the November meeting and latest curbs or bans on exports to China. On that note, Beijing imposed more stringent supervision on thermal and coking coal, while informing mills to stop importing cotton that could have a tariff of up to 40% slapped on. In response, Aud/Usd is hovering near the base of a 0.7248-0.7057 band and Aud/Nzd closer to 1.0704 than 1.0859 as the Kiwi managed to hold up a bit better than its Antipodean neighbour on cross tailwinds to large extent, but also an acceleration in NZ’s manufacturing PMI. Nzd/Usd is just above 0.6600 awaiting the outcome of weekend elections.
EUR/JPY/CAD/CHF
All taking leads from the general market tone and related moves in their US rival, though the Euro also had a somewhat disappointing ZEW survey to digest alongside the worrying rise in coronavirus cases that has reached new record levels in some of the bloc’s member states. Eur/Usd is barely maintaining grip of 1.1700 vs 1.1690 at worst and 1.1826 at one stage, in keeping with the Loonie clutching at 1.3200+ compared to 1.3259 and 1.3099 at best on return from Canada’s Thanksgiving holiday and before crude prices backtracked and manufacturing sales missed consensus. Elsewhere, mixed fortunes for the non-US Dollar safe havens, Yen and Franc, as Usd/Jpy traded towards the bottom end of a 105.86-05 corridor for the most part amidst dovish BoJ rhetoric, but Usd/Chf only veered under 0.9100 briefly to 0.9088 and was more active either side of 0.9150 before reaching an apex on Friday at 0.9163.
Aud-nzd


AUDNZD on the break of the channel 🦐AUDNZD on the weekly chart looks extremely bearish with a double top lower close candle formation.
ON the daily chart the market is testing the support around 1.07300 near the ascending lower trendline of the channel.
We can expect some minor retracement until the 4h resistance before the market will break below the daily structure.
When the price will break below we can set a nice short order according to Plancton's strategy.
–––––
Follow the Shrimp 🦐
Keep in mind.
• 🟣 Purple structure -> Monthly structure.
• 🔴 Red structure -> Weekly structure.
• 🔵 Blue structure -> Daily structure.
• 🟡 Yellow structure -> 4h structure.
• ⚫️ Black structure -> >4h structure.
Here is the Plancton0618 technical analysis , please comment below if you have any question.
The ENTRY in the market will be taken only if the condition of the Plancton0618 strategy will trigger.

AUD_NZD LONG|3:1 Risk Reward
AUD_NZD LONG NOW
PUSHBACK FROM BROKEN RESISTANCE RETEST
Like and Subscribe for more!
AUDNZD going for 1.11Looks like we are in an acending channel here and are just above support. i believe we have a big chance of moving up towards 1.11 in the upper part of the channel.

AUD_NZD BREAKOUT LONG|
AUD_NZD STANDS ON KEY LEVEL.
BROKE DOWNWARD TRENDLINE
LONG ON PULLBACK
Like and Subscribe for more!


Don't miss the great buy opportunity in AUDNZDTrading suggestion:
". There is a possibility of temporary retracement to suggested support line (1.0851).
. if so, traders can set orders based on Price Action and expect to reach short-term targets."
Technical analysis:
. AUDNZD is in a range bound and the beginning of uptrend is expected.
. The price is above the 21-Day WEMA which acts as a dynamic support.
. The RSI is at 66.
Take Profits:
TP1= @ 1.0905
TP2= @ 1.0933
TP3= @ 1.0957
TP4= @ 1.0993
TP5= @ 1.1041
SL= Break below S3
❤️ If you find this helpful and want more FREE forecasts in TradingView
. . . . . Please show your support back,
. . . . . . . . Hit the 👍 LIKE button,
. . . . . . . . . . Drop some feedback below in the comment!
❤️ Your Support is very much 🙏 appreciated! ❤️
💎 Want us to help you become a better Forex trader ?
Now, It's your turn !
Be sure to leave a comment let us know how you see this opportunity and forecast.
Trade well, ❤️
ForecastCity English Support Team ❤️

AUD_NZD STRUCTURE LONG|DOUBLE BREAKOUT
AUD_NZD BROKE UPWARDS FROM A CONFLUENCE OF DIAGONAL AND HORIZONTAL RESISTANCE
The breakout is confirmed
Now long on pullback+some reversal pattern.
__________________________________
LIKE and SUBSCRIBE for QUALITY

AUDNZD: Potential Harmonic Bat Pattern
AUDNZD is very close to a significant zone of confluence.
on a daily we see a perfect match between a major falling trend line and horizontal structure resistance.
that resistance cluster coincides with a projected completion point of a harmonic bearish bat pattern.
1.082 - 1.083 will be the area from where a pullback will be expected.
goals:
1.0802
1.0785

AUDNZD testing a minor resitance 🦐AUDNZD on the daily chart is moving inside a descending channel.
The market hit the top part and try to break below the structure at 1.08 before being pushed back above.
Currently the market is breaking below again and if the 4h candle will close below, at the reset of the structure we can set a nice short order according to Plancton's strategy.
–––––
Follow the Shrimp 🦐
Keep in mind.
• 🟣 Purple structure -> Monthly structure.
• 🔴 Red structure -> Weekly structure.
• 🔵 Blue structure -> Daily structure.
• 🟡 Yellow structure -> 4h structure.
• ⚫️ Black structure -> >4h structure.
Here is the Plancton0618 technical analysis , please comment below if you have any question.
The ENTRY in the market will be taken only if the condition of the Plancton0618 strategy will trigger.

AudNzd short ideaAudNzd formes an inverted head and shoulders, then rejected the neckline...
Price now appears to have formed a bearish triangle and could possibly break out on the 4h time Frame..
I am considering a short position if price breaks out

AUD_NZD STRUCTRE SHORT| BREAKOUT TRADING PLAN
AUD_NZD HIT RESISTANCE, TRADING ALONG SUPPORT, WAIT FOR BREAKOUT
(1) Short after breakout confirmed
(2) SL, tp as on the chart
(3) No breakout no trade
___________________________
LIKE and SUBSCRIBE for LUV


$AUDNZD - Moves inside the flagHi guys!
Wave 2 may result in investments in safe-haven assets as Gold and Bitcoin (as it seems).
Since the Australian Dollar is correlated to Gold, we should expect a contemporary moves of the AUD against it's quoting currencies.
Gold as the Australian Dollar against major pairs had tested an important dynamic support and rebounced, this might bring in some singnificant signals to investors among the Covid wave 2 to purchase Gold right now. As the US Election is getting close, the volatility may as well rise.
Despite the fact that a regular Bullish flag pattern implies a 5-wave move inside the flag before the breakout, however I think that the pattern here is complete and AUD may break the resistance soon enough.
Follow me for more ideas.
If you like the idea, do not hesitate to hit that Like button!

AUDNZD Trading Plan on the Daily chartMain items we can see on the chart:
a) Currently, the price is on the edge of a resistance zone + a descending trendline
b) There we can see a corrective structure (yellow lines)
c) The first thing we will wait for before trading is a clear breakout of the corrective structure
d) IF that happens we will look for corrective structures on the 1H chart, we will trade towards the next bullish target

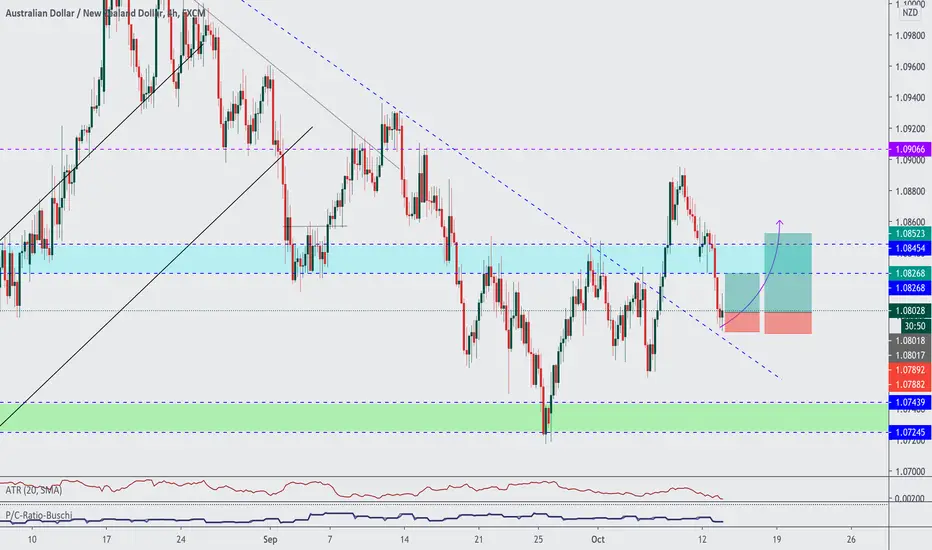
AUDNZD tesding a daily structure 🦐AUDNZD after a bounce over the weekly structure around 1.07300 is now testing a daily structure.
Price retraced till the 0.382 fib level on a support structure and now will go for a second test of the daily resistance.
IF the price will manage to break and close above the daily structure we can set a nice long order according to Plancton's strategy.
–––––
Follow the Shrimp 🦐
Here is the Plancton0618 technical analysis, please comment below if you have any question.
The ENTRY in the market will be taken only if the condition of Plancton0618 strategy will trigger.


AUDNZD bounce over the 0.618 🦐After our last analysis on this pair we check what we expect next from AUDNZD pair.
The price has been moving inside a descending channel.
After breaking the resistance at 1.08300 price tested the support at 1.07800 and retest the upper structure.
Recently the market created a spike till exactly the 0.618 fib level of the previous upper leg before going back over the daily structure.
IF the price will break and close below the 1.07800 level we can set a nice short order according to Plancton's strategy.
–––––
Follow the Shrimp 🦐
Here is the Plancton0618 technical analysis, please comment below if you have any question.
The ENTRY in the market will be taken only if the condition of Plancton0618 strategy will trigger.
