AUD/USD: Further decline appears on the cardsA breakout dynamic trendline and new short signal appear on the AUD/USD chart. The price may fall to the support levels. We are looking for a new short setup in this scenario.
Aud-usd

AUDUSD low risk for shortHi guys!"
AUDUSD has been examined in different dimensions:
1- Strong supply and demand levels that I identify with my own indicator and system.
2- The structure of recently formed waves
3- Current market momentum
4- The structure of classical and price patterns
In this idea, I identified the direction of the market in different ways and in the second step, I analyzed the potential of continuation or reversal. Usually, paying attention to the trend and strength of the trend can greatly increase the accuracy of the analysis.
In general, I tried to describe the continuation of the movement in the simplest possible way in the diagram.
⚠️ Disclaimer:
This is a personal opinion and you are responsible for any trading decisions.

j.Hejazi | AUDUSD Wedge PatternThe Australian dollar is moving in a descending wedge pattern. Currently, the price is heading towards a corrective phase to test the upper edge of the wedge, which is also a convergence of an ascending annual trendline and a 100-period moving average on the 4-hour timeframe, at a level of 0.69400. I anticipate a price reversal from this level to continue its trajectory inside the pattern, with the next potential target being 0.6800.
-------------------------------------------------------------------------
Let me know your thoughts in the comments, and show your support by liking the idea.
Please follow if you're interested in more ideas like this.
Your support is greatly appreciated!

AUDUSD bias is still for lower levels.AUDUSD - Intraday - We look to Sell at 0.6885 (stop at 0.6925)
Buying pressure from 0.6794 resulted in prices rejecting the dip.
We are trading at oversold extremes.
A higher correction is expected.
The bias is still for lower levels and we look for any gains to be limited.
We therefore, prefer to fade into the rally with a tight stop in anticipation of a move back lower.
Our profit targets will be 0.6785 and 0.6765
Resistance: 0.6925 / 0.7160 / 0.7400
Support: 0.6780 / 0.6665 / 0.6550
Risk Disclaimer
The trade ideas beyond this page are for informational purposes only and do not constitute investment advice or a solicitation to trade. This information is provided by Signal Centre, a third-party unaffiliated with OANDA, and is intended for general circulation only. OANDA does not guarantee the accuracy of this information and assumes no responsibilities for the information provided by the third party. The information does not take into account the specific investment objectives, financial situation, or particular needs of any particular person. You should take into account your specific investment objectives, financial situation, and particular needs before making a commitment to trade, including seeking advice from an independent financial adviser regarding the suitability of the investment, under a separate engagement, as you deem fit.
You accept that you assume all risks in independently viewing the contents and selecting a chosen strategy.
Where the research is distributed in Singapore to a person who is not an Accredited Investor, Expert Investor or an Institutional Investor, Oanda Asia Pacific Pte Ltd (“OAP“) accepts legal responsibility for the contents of the report to such persons only to the extent required by law. Singapore customers should contact OAP at 6579 8289 for matters arising from, or in connection with, the information/research distributed.

AUDUSD Potential for Bearish Drop | 23rd February 2023Looking at the H4 chart, my overall bias for AUDUSD is bearish due to the current price being below the Ichimoku cloud , indicating a bearish market.
Looking for a sell stop entry at 0.68118, to ride the bearish momentum. Stop loss will be at 0.68963, where the 38.2% Fibonacci line and overlap resistance is. Take profit will be at 0.66862, where the overlap support is.
Any opinions, news, research, analyses, prices, other information, or links to third-party sites contained on this website are provided on an "as-is" basis, as general market commentary, and do not constitute investment advice. The market commentary has not been prepared in accordance with legal requirements designed to promote the independence of investment research, and it is therefore not subject to any prohibition on dealing ahead of dissemination. Although this commentary is not produced by an independent source, FXCM takes all sufficient steps to eliminate or prevent any conflicts of interest arising out of the production and dissemination of this communication. The employees of FXCM commit to acting in the clients' best interests and represent their views without misleading, deceiving, or otherwise impairing the clients' ability to make informed investment decisions. For more information about the FXCM's internal organizational and administrative arrangements for the prevention of conflicts, please refer to the Firms' Managing Conflicts Policy. Please ensure that you read and understand our Full Disclaimer and Liability provision concerning the foregoing Information, which can be accessed on the website.

AUD/USD long tradeWe enter a strong zone of support, this might give us some strength to go higher.
Short term, long trade. It also looks like we forgot to fill some short orders at the last down push.
Let's try to get these ;-)

AUDUSD Potential for Bearish Drop to Overlap Support Looking at the H4 chart, my overall AUDUSD is bearish, as the current price is above the Ichimoku Cloud. Looking for a pullback sell entry at 0.69231 where the overlap resistance is, take profit at 0.66746 where the overlap support is, and stop loss at 0.70428 which is the recent swing high.
Please be advised that the information presented on TradingView is provided to Vantage (‘Vantage Global Limited’, ‘we’) by a third-party provider (‘Everest Fortune Group’). Please be reminded that you are solely responsible for the trading decisions on your account. There is a very high degree of risk involved in trading. Any information and/or content is intended entirely for research, educational and informational purposes only and does not constitute investment or consultation advice or investment strategy. The information is not tailored to the investment needs of any specific person and therefore does not involve a consideration of any of the investment objectives, financial situation or needs of any viewer that may receive it. Kindly also note that past performance is not a reliable indicator of future results. Actual results may differ materially from those anticipated in forward-looking or past performance statements. We assume no liability as to the accuracy or completeness of any of the information and/or content provided herein and the Company cannot be held responsible for any omission, mistake nor for any loss or damage including without limitation to any loss of profit which may arise from reliance on any information supplied by Everest Fortune Group.

AUDUSD Potential for Bearish Drop | 22nd February 2023Looking at the H4 chart, my overall bias for AUDUSD is bearish due to the current price being below the Ichimoku cloud , indicating a bearish market.
Looking for a sell stop entry at 0.68118, to ride the bearish momentum. Stop loss will be at 0.68963, where the 38.2% Fibonacci line and overlap resistance is. Take profit will be at 0.66862, where the overlap support is.
Any opinions, news, research, analyses, prices, other information, or links to third-party sites contained on this website are provided on an "as-is" basis, as general market commentary, and do not constitute investment advice. The market commentary has not been prepared in accordance with legal requirements designed to promote the independence of investment research, and it is therefore not subject to any prohibition on dealing ahead of dissemination. Although this commentary is not produced by an independent source, FXCM takes all sufficient steps to eliminate or prevent any conflicts of interest arising out of the production and dissemination of this communication. The employees of FXCM commit to acting in the clients' best interests and represent their views without misleading, deceiving, or otherwise impairing the clients' ability to make informed investment decisions. For more information about the FXCM's internal organizational and administrative arrangements for the prevention of conflicts, please refer to the Firms' Managing Conflicts Policy. Please ensure that you read and understand our Full Disclaimer and Liability provision concerning the foregoing Information, which can be accessed on the website.

AUDUSD Potential DownsidesHey Traders, in today's trading session we are monitoring AUDUSD for a selling opportunity around 0.693 zone, once we will receive any bearish confirmation the trade will be executed.
Trade safe, Joe.

AUDUSD H1: Bearish outlook seen, further downside below 0.6920On the H1 time frame, prices are facing bearish pressure from the resistance zone at 0.6920, in line with the 61.8% Fibonacci retracement. A pullback to this zone presents an opportunity to play the drop to the support zone at 0.6820, in line with the graphical low and 50% Fibonacci extension. Stochastic is approaching resistance as well where we could see a further downside below this level.

AUDUSD Potential for Bearish Drop | 21st February 2023Looking at the H4 chart, my overall bias for AUDUSD is bearish due to the current price being below the Ichimoku cloud , indicating a bearish market.
Looking for a pullback sell entry at 0.68963, where the 38.2% Fibonacci line and overlap resistance is. Stop loss will be at 0.70114, where the 50% Fibonacci line and overlap resistance is. Take profit will be at 0.66862, where the overlap support is.
Any opinions, news, research, analyses, prices, other information, or links to third-party sites contained on this website are provided on an "as-is" basis, as general market commentary, and do not constitute investment advice. The market commentary has not been prepared in accordance with legal requirements designed to promote the independence of investment research, and it is therefore not subject to any prohibition on dealing ahead of dissemination. Although this commentary is not produced by an independent source, FXCM takes all sufficient steps to eliminate or prevent any conflicts of interest arising out of the production and dissemination of this communication. The employees of FXCM commit to acting in the clients' best interests and represent their views without misleading, deceiving, or otherwise impairing the clients' ability to make informed investment decisions. For more information about the FXCM's internal organizational and administrative arrangements for the prevention of conflicts, please refer to the Firms' Managing Conflicts Policy. Please ensure that you read and understand our Full Disclaimer and Liability provision concerning the foregoing Information, which can be accessed on the website.

AUDUSD Potential for Bearish drop to 50% Fibonacci Line Looking at the H4 chart, my overall bias for AUDUSD is bearish due to the current price being below the Ichimoku cloud, and the ascending trend line has been broken, indicating a change in market structure.
Looking for a sell entry at 0.68797 which is the overlap support, take profit at 0.66578 where the 50% Fibonacci line is, and stop loss at 0.70110 where the recent swing high is.
Please be advised that the information presented on TradingView is provided to Vantage (‘Vantage Global Limited’, ‘we’) by a third-party provider (‘Everest Fortune Group’). Please be reminded that you are solely responsible for the trading decisions on your account. There is a very high degree of risk involved in trading. Any information and/or content is intended entirely for research, educational and informational purposes only and does not constitute investment or consultation advice or investment strategy. The information is not tailored to the investment needs of any specific person and therefore does not involve a consideration of any of the investment objectives, financial situation or needs of any viewer that may receive it. Kindly also note that past performance is not a reliable indicator of future results. Actual results may differ materially from those anticipated in forward-looking or past performance statements. We assume no liability as to the accuracy or completeness of any of the information and/or content provided herein and the Company cannot be held responsible for any omission, mistake nor for any loss or damage including without limitation to any loss of profit which may arise from reliance on any information supplied by Everest Fortune Group.

AUDUSD Potential for Bearish Drop | 20th February 2023Looking at the H4 chart, my overall bias for AUDUSD is bearish due to the current price being below the Ichimoku cloud , indicating a bearish market.
Looking for a pullback sell entry at 0.68963, where the 38.2% Fibonacci line and overlap resistance is. Stop loss will be at 0.70114, where the 50% Fibonacci line and overlap resistance is. Take profit will be at 0.66862, where the overlap support is.
Any opinions, news, research, analyses, prices, other information, or links to third-party sites contained on this website are provided on an "as-is" basis, as general market commentary, and do not constitute investment advice. The market commentary has not been prepared in accordance with legal requirements designed to promote the independence of investment research, and it is therefore not subject to any prohibition on dealing ahead of dissemination. Although this commentary is not produced by an independent source, FXCM takes all sufficient steps to eliminate or prevent any conflicts of interest arising out of the production and dissemination of this communication. The employees of FXCM commit to acting in the clients' best interests and represent their views without misleading, deceiving, or otherwise impairing the clients' ability to make informed investment decisions. For more information about the FXCM's internal organizational and administrative arrangements for the prevention of conflicts, please refer to the Firms' Managing Conflicts Policy. Please ensure that you read and understand our Full Disclaimer and Liability provision concerning the foregoing Information, which can be accessed on the website.

AUDUSD:Potential Breakout due to strong USD envrionmentHey Traders, based on the last strong NFP numbers that were out of expectations with 517,000 new jobs created in January, retail sales smashing expectations of 1.9% with 3%, CPI and other strong USD data we can notice that the market is pricing more rate hikes, and we expect the USD to continue outperforming until the next fed decision on March that will clarify more the USD path. in case of a breakout on AUDUSD chart i would monitor a retrace around 0.685 zone.
i would also like to give a risk management advice to traders, i personally risk between 0.5% to 2% per trade so even if i'm in the wrong path that would take me a bunch of consecutive losing trades to get my account marginated which is too far. so for example if you risk 1% per trade that will take you more than a hundred consecutive losing trades to lose your account. but if you risk 10 times the recommended amount for example a 20% risk per trade that means 4-5 consecutive losing trades will knock your account out from the market.
Please feel free to ask me questions regarding fundamentals and technicals in the comment section!
Trade safe, Joe.
source of USD data: www.forexfactory.com

AUDUSD potential for Bearish Drop to recent swing low Looking at the H4 chart, my overall bias for AUDUSD is bearish due to the current price being below the Ichimoku cloud, and the ascending trend line has been broken, indicating a change in market structure.
Looking for a pullback sell entry at 0.69308 where the 23.6% Fibonacci line is, and take profit at intermediate support at 0.68847 where the 38.2% Fibonacci line is and stop loss placed at 0.70129 where the recent swing high is.
Please be advised that the information presented on TradingView is provided to Vantage (‘Vantage Global Limited’, ‘we’) by a third-party provider (‘Everest Fortune Group’). Please be reminded that you are solely responsible for the trading decisions on your account. There is a very high degree of risk involved in trading. Any information and/or content is intended entirely for research, educational and informational purposes only and does not constitute investment or consultation advice or investment strategy. The information is not tailored to the investment needs of any specific person and therefore does not involve a consideration of any of the investment objectives, financial situation or needs of any viewer that may receive it. Kindly also note that past performance is not a reliable indicator of future results. Actual results may differ materially from those anticipated in forward-looking or past performance statements. We assume no liability as to the accuracy or completeness of any of the information and/or content provided herein and the Company cannot be held responsible for any omission, mistake nor for any loss or damage including without limitation to any loss of profit which may arise from reliance on any information supplied by Everest Fortune Group.

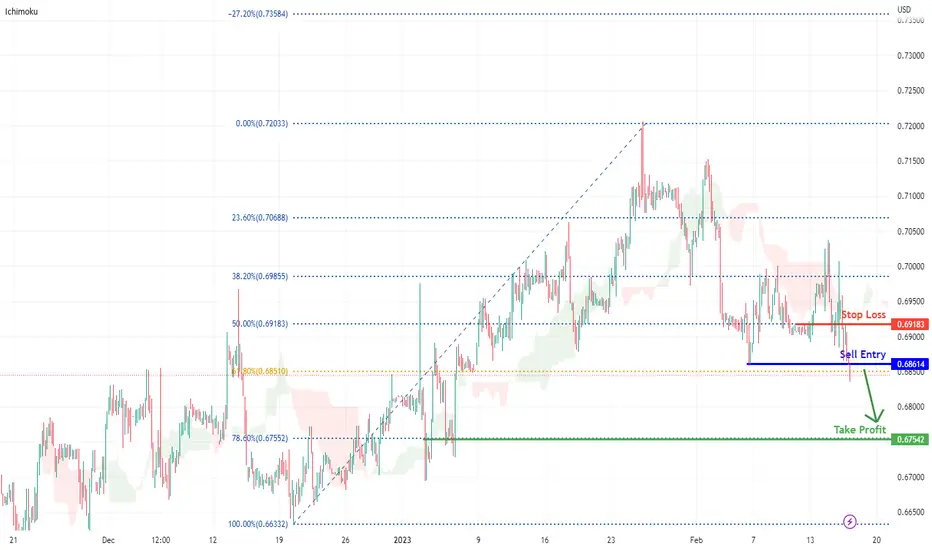
AUDUSD Potential for Bearish Drop to 78.6% Fibonacci line Looking at the H4 chart, my overall bias for AUDUSD is bearish due to the current price being below the Ichimoku cloud, and the ascending trend line has been broken, indicating a change in market structure. Looking for a pullback sell entry at 0.68535, stop loss at 0.69183 where the 50% Fibonacci line is, and take profit at 0.67541 where the 78.6% Fibonacci line is.
Any opinions, news, research, analyses, prices, other information, or links to third-party sites contained on this website are provided on an "as-is" basis, as general market commentary, and do not constitute investment advice. The market commentary has not been prepared in accordance with legal requirements designed to promote the independence of investment research, and it is therefore not subject to any prohibition on dealing ahead of dissemination. Although this commentary is not produced by an independent source, FXCM takes all sufficient steps to eliminate or prevent any conflicts of interest arising out of the production and dissemination of this communication. The employees of FXCM commit to acting in the clients' best interests and represent their views without misleading, deceiving, or otherwise impairing the clients' ability to make informed investment decisions. For more information about the FXCM's internal organizational and administrative arrangements for the prevention of conflicts, please refer to the Firms' Managing Conflicts Policy. Please ensure that you read and understand our Full Disclaimer and Liability provision concerning the foregoing Information, which can be accessed on the website.
AUDUSD - Buy This long position may not look very convincing, but there is a lot more context to this trade.
Price was at a high of 0.76500 in April, and has been dropping ever since.
Now, price is at 0.68730, which is our entry price in this trade.
The pair has been trying to increase, but encountered a small downtrend in the lower timeframes. However, the higher highs and higher lows on the 1D chart are still intact.
Today, US news was very positive. However, the pair did not allow price to go lower and had a massive rejection to keep price above the support level.
That rejection is the main reason behind our entry point. Especially because it is at a major support level.
In addition to that, Gov Lowe of Australia has a speech today. It is expected that he will be hawkish to help the AUD gain strength.
Those are the reasons behind this trade.

AUDUSD Potential for Bullish Rise to recent swing high Looking at the H4 chart, my overall bias for AUDUSD is slightly bullish as there is a key support level, the price tested and bounced from the 1st support level. Looking for a pullback buy entry at 0.68760 below the 1st support level. We are looking to take profit at0.70097, which is the recent swing high, Stop loss will be placed at 0.68325, where the 61.8% Fibonacci retracement is.
Please be advised that the information presented on TradingView is provided to Vantage (‘Vantage Global Limited’, ‘we’) by a third-party provider (‘Everest Fortune Group’). Please be reminded that you are solely responsible for the trading decisions on your account. There is a very high degree of risk involved in trading. Any information and/or content is intended entirely for research, educational and informational purposes only and does not constitute investment or consultation advice or investment strategy. The information is not tailored to the investment needs of any specific person and therefore does not involve a consideration of any of the investment objectives, financial situation or needs of any viewer that may receive it. Kindly also note that past performance is not a reliable indicator of future results. Actual results may differ materially from those anticipated in forward-looking or past performance statements. We assume no liability as to the accuracy or completeness of any of the information and/or content provided herein and the Company cannot be held responsible for any omission, mistake nor for any loss or damage including without limitation to any loss of profit which may arise from reliance on any information supplied by Everest Fortune Group.

AUDUSD Potential for Bearish Drop | 16th February 2023Looking at the H4 chart, my overall bias for AUDUSD is bearish due to the current price being below the Ichimoku cloud , indicating a bearish market. Looking for a pullback sell entry at 0.69098, where the overlap resistance and 23.6% Fibonacci line is. Stop loss will be at 0.70159, where the overlap resistance and 50% Fibonacci line is. Take profit will be at 0.66690, where the overlap support is.
Any opinions, news, research, analyses, prices, other information, or links to third-party sites contained on this website are provided on an "as-is" basis, as general market commentary, and do not constitute investment advice. The market commentary has not been prepared in accordance with legal requirements designed to promote the independence of investment research, and it is therefore not subject to any prohibition on dealing ahead of dissemination. Although this commentary is not produced by an independent source, FXCM takes all sufficient steps to eliminate or prevent any conflicts of interest arising out of the production and dissemination of this communication. The employees of FXCM commit to acting in the clients' best interests and represent their views without misleading, deceiving, or otherwise impairing the clients' ability to make informed investment decisions. For more information about the FXCM's internal organizational and administrative arrangements for the prevention of conflicts, please refer to the Firms' Managing Conflicts Policy. Please ensure that you read and understand our Full Disclaimer and Liability provision concerning the foregoing Information, which can be accessed on the website.

AUD/USDLong scenario for this pair.
Recent downmove was fast and powerfull.
However in order to get lower, we might get a retracement up again.
Also form a right shoulder on the D chart.

AUDUSD Potential for Bearish Drop to recent swing low
Looking at the H4 chart, my overall bias for AUDUSD is slightly bearish as there is a key resistance level, Looking for a sell entry at 0.69969 where below the overlap resistance and 23.6% Fibonacci retracement. We are looking to take a profit at 0.68592, which is the recent swing low, Stop loss will be placed at 0.71414, where the recent swing high is.

AUDUSD Potential for Bearish Drop | 15th February 2023Looking at the H4 chart, my overall bias for AUDUSD is bearish due to the current price being below the Ichimoku cloud , indicating a bearish market. Looking for a pullback sell entry at 0.70159, where the overlap resistance and 50% Fibonacci line is. Stop loss will be at 0.71577, where the previous high is. Take profit will be at 0.68660, where the overlap support is.
Any opinions, news, research, analyses, prices, other information, or links to third-party sites contained on this website are provided on an "as-is" basis, as general market commentary, and do not constitute investment advice. The market commentary has not been prepared in accordance with legal requirements designed to promote the independence of investment research, and it is therefore not subject to any prohibition on dealing ahead of dissemination. Although this commentary is not produced by an independent source, FXCM takes all sufficient steps to eliminate or prevent any conflicts of interest arising out of the production and dissemination of this communication. The employees of FXCM commit to acting in the clients' best interests and represent their views without misleading, deceiving, or otherwise impairing the clients' ability to make informed investment decisions. For more information about the FXCM's internal organizational and administrative arrangements for the prevention of conflicts, please refer to the Firms' Managing Conflicts Policy. Please ensure that you read and understand our Full Disclaimer and Liability provision concerning the foregoing Information, which can be accessed on the website.

AUDUSD Potential ReversalHey Traders, in today's trading session we are monitoring AUDUSD for a buying opportunity around 0.69 zone, once we will receive any bullish confirmation the trade will be executed.
Trade safe, Joe.
