AUDJPY: Sell opportunity.AUDJPY is basically neutral on its 1D technical outlook (RSI = 56.422, MACD = 0.430, ADX = 19.989), ranging inside the 1D MA200 and 1D MA50 since the start of May. The last bullish wave top of the Channel Down got rejected around those levels and targeted the S1 Zone. Short, TP = 90.150.
## If you like our free content follow our profile to get more daily ideas. ##
## Comments and likes are greatly appreciated. ##
Aud

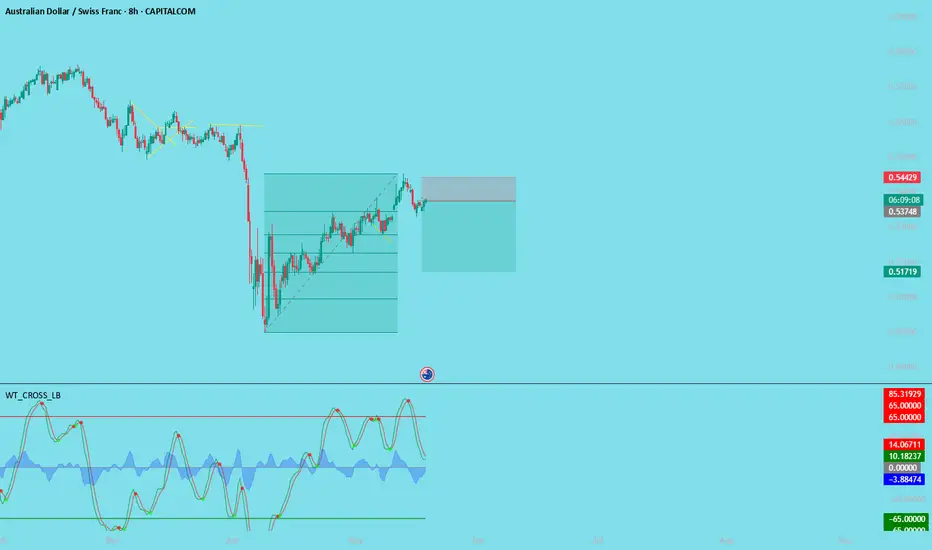
AUDCHF - Wait For it!Hello TradingView Family / Fellow Traders. This is Richard, also known as theSignalyst.
📈AUDCHF has been overall bearish trading within the flat falling broadening wedge pattern marked in red.
Moreover, the green zone is a supply.
🏹 Thus, the highlighted red circle is a strong area to look for sell setups as it is the intersection of the upper red trendline and supply.
📚 As per my trading style:
As #AUDCHF approaches the red circle zone, I will be looking for bearish reversal setups (like a double top pattern, trendline break , and so on...)
📚 Always follow your trading plan regarding entry, risk management, and trade management.
Good luck!
All Strategies Are Good; If Managed Properly!
~Rich
Disclosure: I am part of Trade Nation's Influencer program and receive a monthly fee for using their TradingView charts in my analysis.

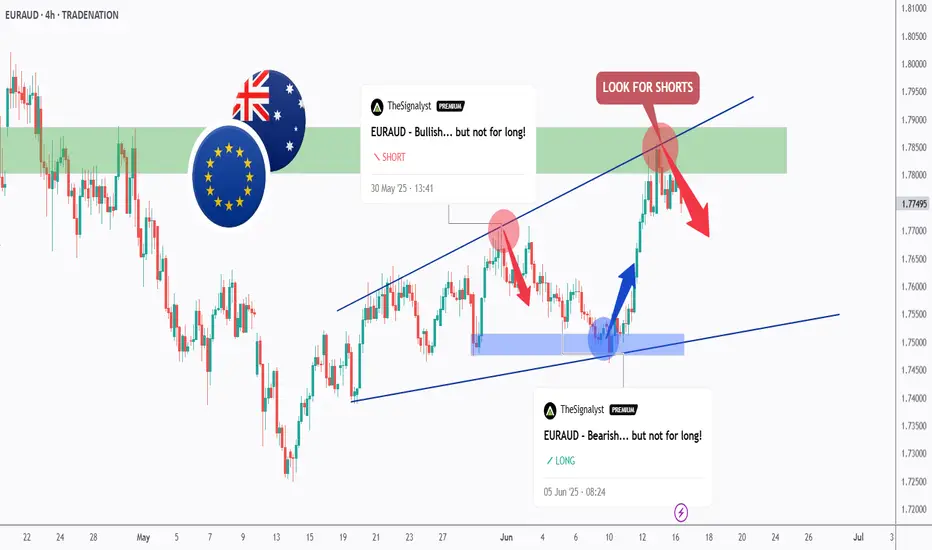
We Are Milking EURAUD... Again!Hello TradingView Family / Fellow Traders. This is Richard, also known as theSignalyst.
As per our two EURAUD analysis, we looked for shorts around the green structure and longs around the blue demand.
What's next?
📈EURAUD has been trading within the rising broadening wedge marked in blue, and it is currently rejecting the upper bound of the wedge which we consider an over-bought zone.
Moreover, the green zone is a strong structure and resistance.
🏹 Thus, the latest highlighted red circle is a strong area to look for sell setups as it is the intersection of the upper blue trendline and resistance.
📚 As per my trading style:
As #EURAUD is around the red circle zone, I will be looking for bearish reversal setups (like a double top pattern, trendline break , and so on...)
📚 Always follow your trading plan regarding entry, risk management, and trade management.
Good luck!
All Strategies Are Good; If Managed Properly!
~Rich
Disclosure: I am part of Trade Nation's Influencer program and receive a monthly fee for using their TradingView charts in my analysis.
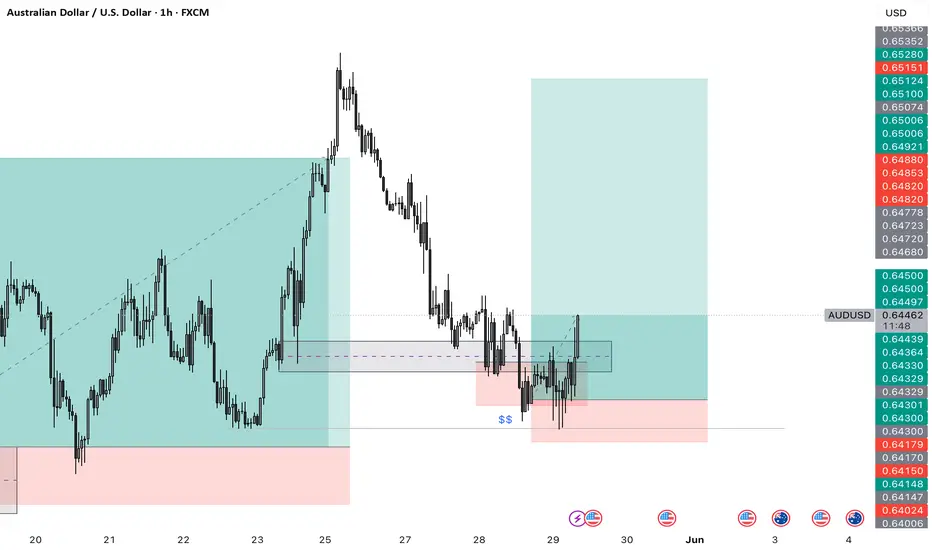
AUDUSD Potential UpsidesHey Traders, in today's trading session we are monitoring AUDUSD for a buying opportunity around 0.64600 zone, AUDUSD is trading in an uptrend and currently is in a correction phase in which it is approaching the trend at 0.64600 support and resistance area.
Trade safe, Joe.

AUDCAD SHORT FORECAST Q2 W25 D19 Y25AUDCAD SHORT FORECAST Q2 W25 D19 Y25
Professional Risk Managers👋
Welcome back to another FRGNT chart update📈
Diving into some Forex setups using predominantly higher time frame order blocks alongside intraday confirmation breaks of structure.
💡Here are some trade confluences📝
✅Weekly 50 EMA
✅Weekly order block rejection
✅Daily order block rejection
✅15’ order block identification
🔑 Remember, to participate in trading comes always with a degree of risk, therefore as professional risk managers it remains vital that we stick to our risk management plan as well as our trading strategies.
📈The rest, we leave to the balance of probabilities.
💡Fail to plan. Plan to fail.
🏆It has always been that simple.
❤️Good luck with your trading journey, I shall see you at the very top.
🎯Trade consistent, FRGNT X

Bearish drop?The Aussie (AUD/USD) is rising towards the pivot and could drop to the pullback support.
Pivot: 0.6497
1st Support: 0.6466
1st Resistance: 0.6510
Risk Warning:
Trading Forex and CFDs carries a high level of risk to your capital and you should only trade with money you can afford to lose. Trading Forex and CFDs may not be suitable for all investors, so please ensure that you fully understand the risks involved and seek independent advice if necessary.
Disclaimer:
The above opinions given constitute general market commentary, and do not constitute the opinion or advice of IC Markets or any form of personal or investment advice.
Any opinions, news, research, analyses, prices, other information, or links to third-party sites contained on this website are provided on an "as-is" basis, are intended only to be informative, is not an advice nor a recommendation, nor research, or a record of our trading prices, or an offer of, or solicitation for a transaction in any financial instrument and thus should not be treated as such. The information provided does not involve any specific investment objectives, financial situation and needs of any specific person who may receive it. Please be aware, that past performance is not a reliable indicator of future performance and/or results. Past Performance or Forward-looking scenarios based upon the reasonable beliefs of the third-party provider are not a guarantee of future performance. Actual results may differ materially from those anticipated in forward-looking or past performance statements. IC Markets makes no representation or warranty and assumes no liability as to the accuracy or completeness of the information provided, nor any loss arising from any investment based on a recommendation, forecast or any information supplied by any third-party.

EURAUD to find buyers close to market price?EURAUD - 24h expiry
The primary trend remains bullish.
The selloff is close to an exhaustion count on the daily chart.
Preferred trade is to buy on dips.
Risk/Reward would be poor to call a buy from current levels.
Bespoke support is located at 1.7620.
We look to Buy at 1.7620 (stop at 1.7585)
Our profit targets will be 1.7760 and 1.7790
Resistance: 1.7750 / 1.7800 / 1.7850
Support: 1.7670 / 1.7620 / 1.7580
Risk Disclaimer
The trade ideas beyond this page are for informational purposes only and do not constitute investment advice or a solicitation to trade. This information is provided by Signal Centre, a third-party unaffiliated with OANDA, and is intended for general circulation only. OANDA does not guarantee the accuracy of this information and assumes no responsibilities for the information provided by the third party. The information does not take into account the specific investment objectives, financial situation, or particular needs of any particular person. You should take into account your specific investment objectives, financial situation, and particular needs before making a commitment to trade, including seeking advice from an independent financial adviser regarding the suitability of the investment, under a separate engagement, as you deem fit.
You accept that you assume all risks in independently viewing the contents and selecting a chosen strategy.
Where the research is distributed in Singapore to a person who is not an Accredited Investor, Expert Investor or an Institutional Investor, Oanda Asia Pacific Pte Ltd (“OAP“) accepts legal responsibility for the contents of the report to such persons only to the extent required by law. Singapore customers should contact OAP at 6579 8289 for matters arising from, or in connection with, the information/research distributed.

Potential bearish drop?AUD/USD is reacting off the resistance level which is an overlap resistance that aligns with the 61.8% Fibonacci retracement and could drop from this level to our take profit.
Entry: 0.6512
Why we like it:
There is an overlap resistance level that lines up with the 61.8% Fibonacci retracement.
Stop loss: 0.6537
Why we like it:
There is a pullback resistance level.
Take profit: 0.6487
Why we like it:
There is a pullback support level that aligns with the 61.8% Fibonacci retracement.
Enjoying your TradingView experience? Review us!
Please be advised that the information presented on TradingView is provided to Vantage (‘Vantage Global Limited’, ‘we’) by a third-party provider (‘Everest Fortune Group’). Please be reminded that you are solely responsible for the trading decisions on your account. There is a very high degree of risk involved in trading. Any information and/or content is intended entirely for research, educational and informational purposes only and does not constitute investment or consultation advice or investment strategy. The information is not tailored to the investment needs of any specific person and therefore does not involve a consideration of any of the investment objectives, financial situation or needs of any viewer that may receive it. Kindly also note that past performance is not a reliable indicator of future results. Actual results may differ materially from those anticipated in forward-looking or past performance statements. We assume no liability as to the accuracy or completeness of any of the information and/or content provided herein and the Company cannot be held responsible for any omission, mistake nor for any loss or damage including without limitation to any loss of profit which may arise from reliance on any information supplied by Everest Fortune Group.

AUDCAD SHORT FORECAST Q2 W25 D18 Y25AUDCAD SHORT FORECAST Q2 W25 D18 Y25
Professional Risk Managers👋
Welcome back to another FRGNT chart update📈
Diving into some Forex setups using predominantly higher time frame order blocks alongside intraday confirmation breaks of structure.
💡Here are some trade confluences📝
✅Weekly 50 EMA
✅Weekly order block rejection
✅Daily order block rejection
✅15’ order block identification
🔑 Remember, to participate in trading comes always with a degree of risk, therefore as professional risk managers it remains vital that we stick to our risk management plan as well as our trading strategies.
📈The rest, we leave to the balance of probabilities.
💡Fail to plan. Plan to fail.
🏆It has always been that simple.
❤️Good luck with your trading journey, I shall see you at the very top.
🎯Trade consistent, FRGNT X

Major resistance ahead?The Aussie (AUD/USD) is rising towards the pivot which has been identified as an overlap resistance and could reverse to the 1st support.
Pivot: 0.6512
1st Support: 0.6466
1st Resistance: 0.6545
Risk Warning:
Trading Forex and CFDs carries a high level of risk to your capital and you should only trade with money you can afford to lose. Trading Forex and CFDs may not be suitable for all investors, so please ensure that you fully understand the risks involved and seek independent advice if necessary.
Disclaimer:
The above opinions given constitute general market commentary, and do not constitute the opinion or advice of IC Markets or any form of personal or investment advice.
Any opinions, news, research, analyses, prices, other information, or links to third-party sites contained on this website are provided on an "as-is" basis, are intended only to be informative, is not an advice nor a recommendation, nor research, or a record of our trading prices, or an offer of, or solicitation for a transaction in any financial instrument and thus should not be treated as such. The information provided does not involve any specific investment objectives, financial situation and needs of any specific person who may receive it. Please be aware, that past performance is not a reliable indicator of future performance and/or results. Past Performance or Forward-looking scenarios based upon the reasonable beliefs of the third-party provider are not a guarantee of future performance. Actual results may differ materially from those anticipated in forward-looking or past performance statements. IC Markets makes no representation or warranty and assumes no liability as to the accuracy or completeness of the information provided, nor any loss arising from any investment based on a recommendation, forecast or any information supplied by any third-party.

AUD/USD- Bullish moveThe AUD/USD recently broke below a key swing low, tapping into the liquidity in that area, and has since shown a clear rejection from that level. The next likely target is the swing high, where significant liquidity resides. Overall, it's a solid setup with a 15-pip stop loss.
Could the Aussie bounce from here?The price is falling towards the support level which is an overlap support that is slightly below the 61.8% Fibonacci retracement and could reverse from this level to our take profit.
Entry: 0.6455
Why we like it:
There is an overlap support that is slightly below the 61.8% Fibonacci retracement.
Stop loss: 0.6407
Why we like it:
There is a pullback support that aligns with the 145% Fibonacci extension.
Take profit: 0.6513
Why we like it:
There is an overlap resistance.
Enjoying your TradingView experience? Review us!
Please be advised that the information presented on TradingView is provided to Vantage (‘Vantage Global Limited’, ‘we’) by a third-party provider (‘Everest Fortune Group’). Please be reminded that you are solely responsible for the trading decisions on your account. There is a very high degree of risk involved in trading. Any information and/or content is intended entirely for research, educational and informational purposes only and does not constitute investment or consultation advice or investment strategy. The information is not tailored to the investment needs of any specific person and therefore does not involve a consideration of any of the investment objectives, financial situation or needs of any viewer that may receive it. Kindly also note that past performance is not a reliable indicator of future results. Actual results may differ materially from those anticipated in forward-looking or past performance statements. We assume no liability as to the accuracy or completeness of any of the information and/or content provided herein and the Company cannot be held responsible for any omission, mistake nor for any loss or damage including without limitation to any loss of profit which may arise from reliance on any information supplied by Everest Fortune Group.

AUDJPY SHORT FORECAST Q2 W25 D17 Y25AUDJPY SHORT FORECAST Q2 W25 D17 Y25
Professional Risk Managers👋
Welcome back to another FRGNT chart update📈
Diving into some Forex setups using predominantly higher time frame order blocks alongside confirmation breaks of structure.
Let’s see what price action is telling us today! 👀
💡Here are some trade confluences📝
✅Weekly Order block rejection
✅15' Order block
✅Daily order block identified
🔑 Remember, to participate in trading comes always with a degree of risk, therefore as professional risk managers it remains vital that we stick to our risk management plan as well as our trading strategies.
📈The rest, we leave to the balance of probabilities.
💡Fail to plan. Plan to fail.
🏆It has always been that simple.
❤️Good luck with your trading journey, I shall see you at the very top.
🎯Trade consistent, FRGNT X

AUD/JPY Bulls Eye 95+ After Bullish ReversalAUD/JPY bounced sharply on Thursday, snapping a 3-day losing streak with a solid bullish-range session. The rally kicked off from a bullish pinbar above 92, where the higher low reinforces support and the broader bullish case.
The 1-hour chart shows a clean breakout from an inverted head and shoulders pattern, pointing to a target around 95.50. With resistance at the April high (95.30), March high (95.75), and the 96 handle, there’s still room for bulls to run.
Dips toward 94 may offer opportunities to join the trend — but a break back below the neckline would shift the tone back to risk-off.
Matt Simpson, Market Analyst at City Index and Forex.com

AUDJPY Potential UpsidesHey Traders, in today's trading session we are monitoring AUDJPY for a buying opportunity around 93.600 zone, AUDJPY is trading in an uptrend and currently is in a correction phase in which it is approaching the trend at 93.600 support and resistance area.
Trade safe, Joe.

Potential bearish breakout?AUD/USD is falling towards a support level, which acts as a pullback support. A breakout below this level could lead the price to drop further towards our take-profit target
Entry: 0.6533
Why we like it:
There is a pullback support level.
Stop loss: 0.6560
Why we like it:
There is a resistance level at the 138.2% Fibonacci extension.
Take profit: 0.6492
Why we like it:
There is a pullback support level that aligns with the 71% Fibonacci retracement.
Enjoying your TradingView experience? Review us!
Please be advised that the information presented on TradingView is provided to Vantage (‘Vantage Global Limited’, ‘we’) by a third-party provider (‘Everest Fortune Group’). Please be reminded that you are solely responsible for the trading decisions on your account. There is a very high degree of risk involved in trading. Any information and/or content is intended entirely for research, educational and informational purposes only and does not constitute investment or consultation advice or investment strategy. The information is not tailored to the investment needs of any specific person and therefore does not involve a consideration of any of the investment objectives, financial situation or needs of any viewer that may receive it. Kindly also note that past performance is not a reliable indicator of future results. Actual results may differ materially from those anticipated in forward-looking or past performance statements. We assume no liability as to the accuracy or completeness of any of the information and/or content provided herein and the Company cannot be held responsible for any omission, mistake nor for any loss or damage including without limitation to any loss of profit which may arise from reliance on any information supplied by Everest Fortune Group.

AUDJPY SHORT FORECAST Q2 W25 D16 Y25AUDJPY SHORT FORECAST Q2 W25 D16 Y25
Professional Risk Managers👋
Welcome back to another FRGNT chart update📈
Diving into some Forex setups using predominantly higher time frame order blocks alongside confirmation breaks of structure.
Let’s see what price action is telling us today! 👀
💡Here are some trade confluences📝
✅Weekly Order block rejection
✅15' Order block
✅Daily order block identified
🔑 Remember, to participate in trading comes always with a degree of risk, therefore as professional risk managers it remains vital that we stick to our risk management plan as well as our trading strategies.
📈The rest, we leave to the balance of probabilities.
💡Fail to plan. Plan to fail.
🏆It has always been that simple.
❤️Good luck with your trading journey, I shall see you at the very top.
🎯Trade consistent, FRGNT X

Potential bearish drop?AUD/USD has reacted off the resistance level which is a pullback resistance and could drop from this level to our take profit.
Entry: 0.6498
Why we like it:
There is a pullback resistance level.
Stop loss: 0.6519
Why we like it:
There is a pullback resistance level.
Take profit: 0.6468
Why we like it:
There is a pullback support that is slightly above the 61.8% Fibonacci projection.
Enjoying your TradingView experience? Review us!
Please be advised that the information presented on TradingView is provided to Vantage (‘Vantage Global Limited’, ‘we’) by a third-party provider (‘Everest Fortune Group’). Please be reminded that you are solely responsible for the trading decisions on your account. There is a very high degree of risk involved in trading. Any information and/or content is intended entirely for research, educational and informational purposes only and does not constitute investment or consultation advice or investment strategy. The information is not tailored to the investment needs of any specific person and therefore does not involve a consideration of any of the investment objectives, financial situation or needs of any viewer that may receive it. Kindly also note that past performance is not a reliable indicator of future results. Actual results may differ materially from those anticipated in forward-looking or past performance statements. We assume no liability as to the accuracy or completeness of any of the information and/or content provided herein and the Company cannot be held responsible for any omission, mistake nor for any loss or damage including without limitation to any loss of profit which may arise from reliance on any information supplied by Everest Fortune Group.

AUDUSD Potential UpsidesHey Traders, in the coming week we are monitoring AUDUSD for a buying opportunity around 0.64500 zone, AUDUSD is trading in an uptrend and currently is in a correction phase in which it is approaching the trend at 0.64500 support and resistance area.
Trade safe, Joe.

EURAUD forming a top?EURAUD - 24h expiry
Price action looks to be forming a top.
Although the bulls are in control, the stalling positive momentum indicates a turnaround is possible.
Preferred trade is to sell into rallies.
Risk/Reward would be poor to call a sell from current levels.
Bespoke resistance is located at 1.7805.
We look to Sell at 1.7805 (stop at 1.7840)
Our profit targets will be 1.7705 and 1.7680
Resistance: 1.7830 / 1.7850 / 1.7880
Support: 1.7710 / 1.7680 / 1.7650
Risk Disclaimer
The trade ideas beyond this page are for informational purposes only and do not constitute investment advice or a solicitation to trade. This information is provided by Signal Centre, a third-party unaffiliated with OANDA, and is intended for general circulation only. OANDA does not guarantee the accuracy of this information and assumes no responsibilities for the information provided by the third party. The information does not take into account the specific investment objectives, financial situation, or particular needs of any particular person. You should take into account your specific investment objectives, financial situation, and particular needs before making a commitment to trade, including seeking advice from an independent financial adviser regarding the suitability of the investment, under a separate engagement, as you deem fit.
You accept that you assume all risks in independently viewing the contents and selecting a chosen strategy.
Where the research is distributed in Singapore to a person who is not an Accredited Investor, Expert Investor or an Institutional Investor, Oanda Asia Pacific Pte Ltd (“OAP“) accepts legal responsibility for the contents of the report to such persons only to the extent required by law. Singapore customers should contact OAP at 6579 8289 for matters arising from, or in connection with, the information/research distributed.

SHORT AUD CHF Investment OpportunityDear traders, I am Andrea Russo, a Forex expert and market analyst. Today I want to share with you a short opportunity on the AUDCHF pair, based on solid technical analysis and current market dynamics.
📌 Entry level: 0.5374 🎯 Take Profit (TP): 0.5173 🛑 Stop Loss (SL): 0.5440
The AUDCHF has shown signs of weakness after a consolidation phase. The bearish pressure, fueled by the strength of the Swiss franc and a climate of risk aversion, could favor a decline towards the indicated target levels.
Technical indicators confirm the strategy: 🔹 Key resistance near 0.5440, invalidation level of the position. 🔹 Bearish momentum with decreasing volumes on bullish pressures. 🔹 Short-term moving average suggesting a possible continuation of the decline.
📊 We will monitor the market to confirm the movement. Always remember to apply proper risk management!
! Audnzd Sell !audnzd is currently in a bearish trend on the Daily tf. its also trading inside of a Daily Supply zone. at the moment price is rejecting off a 30 and 15 poi levels. giving they are also in the Daily supply zone we have confluence added strength the Daily bearish bias. there are 4hr key levels underneath. im waiting to under for a close under the area where theres a 4hr and 15m key level close to each other.

GBPAUD to find sellers at current market price?GBPAUD - 24h expiry
The medium term bias remains bearish.
The sequence for trading is lower lows and highs.
Bullish divergence is expected to support prices.
Preferred trade is to sell into rallies.
Bespoke resistance is located at 2.0810.
We look to Sell at 2.0830 (stop at 2.0860)
Our profit targets will be 2.0710 and 2.0670
Resistance: 2.0790 / 2.0820 / 2.0880
Support: 2.0670 / 2.0630 / 2.0580
Risk Disclaimer
The trade ideas beyond this page are for informational purposes only and do not constitute investment advice or a solicitation to trade. This information is provided by Signal Centre, a third-party unaffiliated with OANDA, and is intended for general circulation only. OANDA does not guarantee the accuracy of this information and assumes no responsibilities for the information provided by the third party. The information does not take into account the specific investment objectives, financial situation, or particular needs of any particular person. You should take into account your specific investment objectives, financial situation, and particular needs before making a commitment to trade, including seeking advice from an independent financial adviser regarding the suitability of the investment, under a separate engagement, as you deem fit.
You accept that you assume all risks in independently viewing the contents and selecting a chosen strategy.
Where the research is distributed in Singapore to a person who is not an Accredited Investor, Expert Investor or an Institutional Investor, Oanda Asia Pacific Pte Ltd (“OAP“) accepts legal responsibility for the contents of the report to such persons only to the extent required by law. Singapore customers should contact OAP at 6579 8289 for matters arising from, or in connection with, the information/research distributed.
