AUDCAD SHORT FORECAST Q2 W25 D18 Y25AUDCAD SHORT FORECAST Q2 W25 D18 Y25
Professional Risk Managers👋
Welcome back to another FRGNT chart update📈
Diving into some Forex setups using predominantly higher time frame order blocks alongside intraday confirmation breaks of structure.
💡Here are some trade confluences📝
✅Weekly 50 EMA
✅Weekly order block rejection
✅Daily order block rejection
✅15’ order block identification
🔑 Remember, to participate in trading comes always with a degree of risk, therefore as professional risk managers it remains vital that we stick to our risk management plan as well as our trading strategies.
📈The rest, we leave to the balance of probabilities.
💡Fail to plan. Plan to fail.
🏆It has always been that simple.
❤️Good luck with your trading journey, I shall see you at the very top.
🎯Trade consistent, FRGNT X
AUDCAD

AUDCAD: Will Start Falling! Here is Why:
Looking at the chart of AUDCAD right now we are seeing some interesting price action on the lower timeframes. Thus a local move down seems to be quite likely.
Disclosure: I am part of Trade Nation's Influencer program and receive a monthly fee for using their TradingView charts in my analysis.
❤️ Please, support our work with like & comment! ❤️

AUDCAD: The Real Move Happens After the TrapNot every trade needs to be flashy.
This one was clean. Simple. Intentional.
And it came after most traders got taken out.
What I Saw :
Price swept PDL: textbook sell-side liquidity.
But instead of jumping in too early, I waited.
Why?
Because I’ve learned something:
👉 The first reaction is often just noise.
👉 The second one, the one that fills into structure. That’s where clarity lives.
My Entry Logic:
After the sweep, price broke minor structure. That was my Change of Character. I will just have to wait for price to pull into the FVG below 50% fibs retracement. Stop below the low. Target at the PDH.
Nothing fancy. Just discipline .
Psychology Check:
I’ve taken this setup before and watched it run without me. Why? Because I used to hesitate. I wanted more confirmation… or feared being wrong.
But here’s the truth:
Your edge is only real if you’re willing to take the shot when it appears .
This wasn’t a guess.
It was system + structure + emotional control.

AUDCAD SHORT FORECAST Q2 W24 D13 Y25AUDCAD SHORT FORECAST Q2 W24 D13 Y25
Professional Risk Managers👋
Welcome back to another FRGNT chart update📈
Diving into some Forex setups using predominantly higher time frame order blocks alongside intraday confirmation breaks of structure.
💡Here are some trade confluences📝
✅Weekly 50 EMA
✅Weekly order block rejection
✅Daily order block rejection
✅15’ order block identification
🔑 Remember, to participate in trading comes always with a degree of risk, therefore as professional risk managers it remains vital that we stick to our risk management plan as well as our trading strategies.
📈The rest, we leave to the balance of probabilities.
💡Fail to plan. Plan to fail.
🏆It has always been that simple.
❤️Good luck with your trading journey, I shall see you at the very top.
🎯Trade consistent, FRGNT X

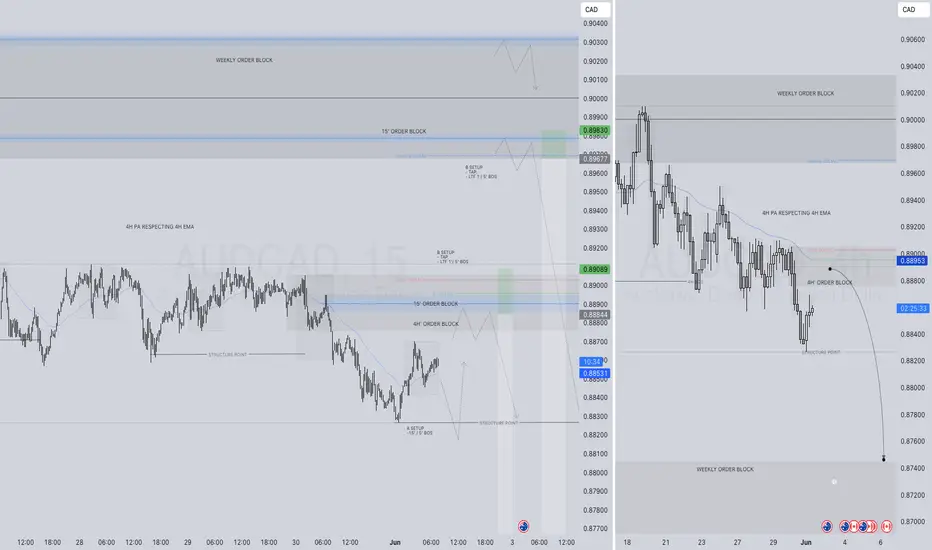
Why AUDCAD is On My Watchlist for a Short Trade🔎 AUDCAD Trade Idea Overview 🔎
Currently watching AUDCAD closely 👀 — and here’s what I’m seeing across the key timeframes:
📉 On the weekly timeframe, the pair remains in a clear bearish trend, with lower highs and lower lows forming consistently.
🕰️ Dropping down to the daily, we’re seeing continued bearish momentum in alignment with the higher timeframe bias.
⏳ On the 4-hour chart, there’s been a clean break of market structure, confirming short-term weakness.
🎯 I’m eyeing a pullback into equilibrium within the current price range for a potential short entry.
🔹 Entry: On retracement into a key value zone
🔹 Stop loss: Positioned above recent swing highs
🔹 Take profit: Targeting previous lows and liquidity pockets 💧
Patience is key here — waiting for the right setup to align across multiple timeframes. 📊
⚠️ Disclaimer: This is not financial advice. This analysis is for educational and informational purposes only. Always do your own research and manage risk responsibly. 💼

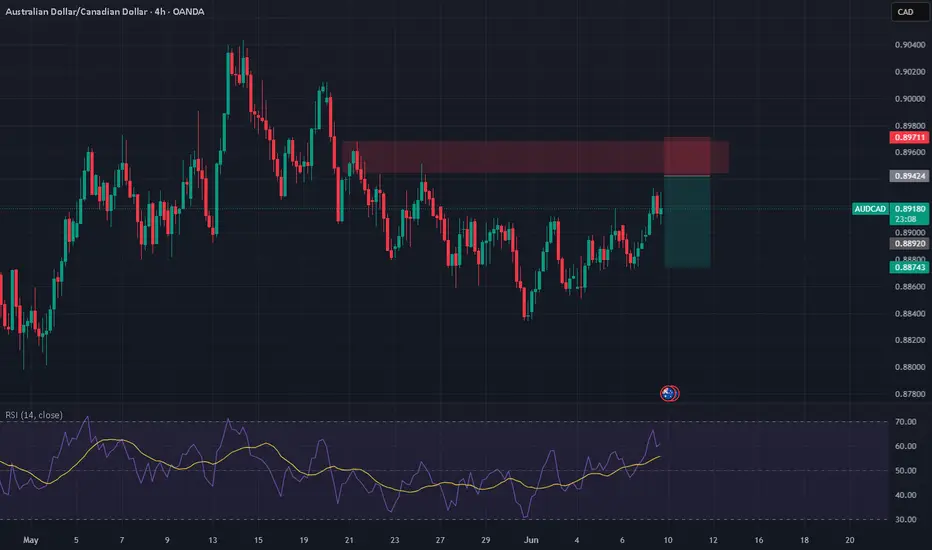
AUDCAD - Fundamentals vs Momentum – Betting on CAD🕓 Timeframe: 4H | ⚠️ Bias: Bearish From Supply Zone
AUDCAD is rejecting the 0.8940–0.8960 supply zone, a key resistance that's been respected multiple times. With RSI turning over near overbought and CAD fundamentals improving, this looks like a clean short opportunity.
📊 Technical Confluence
🔴 Resistance Zone: 0.8940–0.8960 (historical supply zone)
📉 Bearish Structure Intact: Still in a broader HTF downtrend (lower highs)
⚠️ RSI Divergence: Slowing near 62, suggesting momentum exhaustion
🕯️ Price Action: Current candle showing indecision – early signs of rejection
🌍 Fundamental Confluence
🇦🇺 AUD Weakness:
RBA paused rates, inflation easing → Dovish
AUD overextended after sentiment shift (conditional score ↑ too fast)
AUD vulnerable if sentiment shifts risk-off
🇨🇦 CAD Strength:
BoC holding firm on rates, hawkish tone
Oil production recovering → CAD-positive
COT net long position + seasonal strength
🎯 Trade Plan
📍 Entry: 0.8940–0.8955 (on bearish confirmation: engulfing/pin bar)
🛑 Stop Loss: 0.8975 (above resistance zone)
🎯 Take Profit 1: 0.8870 (mid-range)
🎯 Take Profit 2: 0.8830 (into demand zone)
⏱️ Optional: Partial entry now, scale in at 0.8960 if tapped
🧠 “Don’t chase the move. Sell the retest when momentum fades and fundamentals align.”
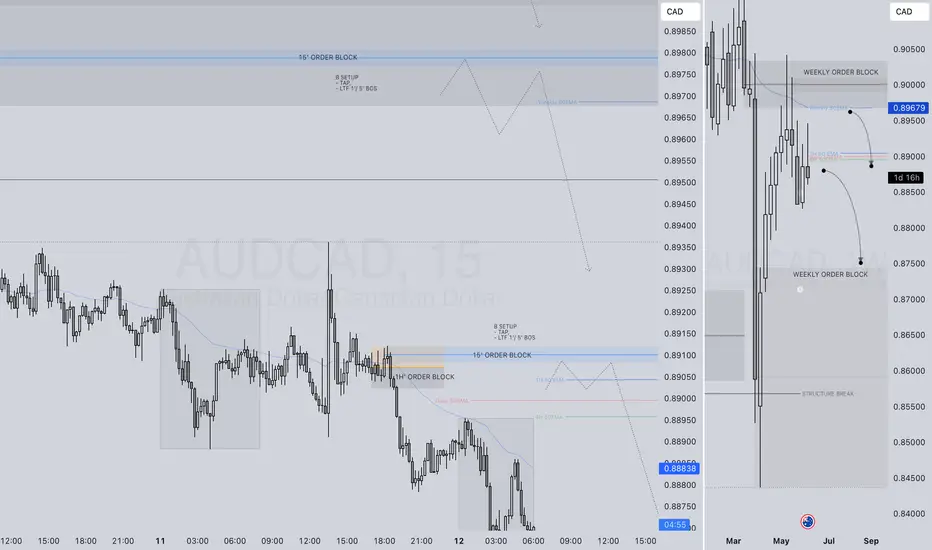
AUDCAD SHORT FORECAST Q2 W24 D12 Y25AUDCAD SHORT FORECAST Q2 W24 D12 Y25
Professional Risk Managers👋
Welcome back to another FRGNT chart update📈
Diving into some Forex setups using predominantly higher time frame order blocks alongside intraday confirmation breaks of structure.
💡Here are some trade confluences📝
✅Weekly 50 EMA
✅Weekly order block rejection
✅Daily order block rejection
✅15’ order block identification
🔑 Remember, to participate in trading comes always with a degree of risk, therefore as professional risk managers it remains vital that we stick to our risk management plan as well as our trading strategies.
📈The rest, we leave to the balance of probabilities.
💡Fail to plan. Plan to fail.
🏆It has always been that simple.
❤️Good luck with your trading journey, I shall see you at the very top.
🎯Trade consistent, FRGNT X
AUDCAD SHORT FORECAST Q2 W24 D10 Y25AUDCAD SHORT FORECAST Q2 W24 D10 Y25
Professional Risk Managers👋
Welcome back to another FRGNT chart update📈
Diving into some Forex setups using predominantly higher time frame order blocks alongside intraday confirmation breaks of structure.
💡Here are some trade confluences📝
✅Weekly 50 EMA
✅Weekly order block rejection
✅Daily order block rejection
✅15’ order block identification
🔑 Remember, to participate in trading comes always with a degree of risk, therefore as professional risk managers it remains vital that we stick to our risk management plan as well as our trading strategies.
📈The rest, we leave to the balance of probabilities.
💡Fail to plan. Plan to fail.
🏆It has always been that simple.
❤️Good luck with your trading journey, I shall see you at the very top.
🎯Trade consistent, FRGNT X

Bearish drop?AUD/CAD has rejected off the pivot and could drop to the 1st support.
Pivot: 0.89082
1st Support: 0.87895
1st Resistance: 0.89646
Risk Warning:
Trading Forex and CFDs carries a high level of risk to your capital and you should only trade with money you can afford to lose. Trading Forex and CFDs may not be suitable for all investors, so please ensure that you fully understand the risks involved and seek independent advice if necessary.
Disclaimer:
The above opinions given constitute general market commentary, and do not constitute the opinion or advice of IC Markets or any form of personal or investment advice.
Any opinions, news, research, analyses, prices, other information, or links to third-party sites contained on this website are provided on an "as-is" basis, are intended only to be informative, is not an advice nor a recommendation, nor research, or a record of our trading prices, or an offer of, or solicitation for a transaction in any financial instrument and thus should not be treated as such. The information provided does not involve any specific investment objectives, financial situation and needs of any specific person who may receive it. Please be aware, that past performance is not a reliable indicator of future performance and/or results. Past Performance or Forward-looking scenarios based upon the reasonable beliefs of the third-party provider are not a guarantee of future performance. Actual results may differ materially from those anticipated in forward-looking or past performance statements. IC Markets makes no representation or warranty and assumes no liability as to the accuracy or completeness of the information provided, nor any loss arising from any investment based on a recommendation, forecast or any information supplied by any third-party.

DAILY HOT PICK ! AUDCAD SHORT FORECAST Q2 W23 D3 Y25AUDCAD SHORT FORECAST Q2 W23 D3 Y25
🔥🔥DAILY HOT PICK !!!!!! 🎯🎯
Professional Risk Managers👋
Welcome back to another FRGNT chart update📈
Diving into some Forex setups using predominantly higher time frame order blocks alongside intraday confirmation breaks of structure.
💡Here are some trade confluences📝
✅Daily 50 EMA
✅Weekly order block rejection
✅Daily order block rejection
✅15’ order block identification
🔑 Remember, to participate in trading comes always with a degree of risk, therefore as professional risk managers it remains vital that we stick to our risk management plan as well as our trading strategies.
📈The rest, we leave to the balance of probabilities.
💡Fail to plan. Plan to fail.
🏆It has always been that simple.
❤️Good luck with your trading journey, I shall see you at the very top.
🎯Trade consistent, FRGNT X

AUDCAD SELL/SHORTBy utilizing levels, historical patterns, , we can formulate a hypothesis that the market might follow a similar trajectory if bearish sentiment prevails.

AUDCAD: Will Start Falling! Here is Why:
Our strategy, polished by years of trial and error has helped us identify what seems to be a great trading opportunity and we are here to share it with you as the time is ripe for us to sell AUDCAD.
Disclosure: I am part of Trade Nation's Influencer program and receive a monthly fee for using their TradingView charts in my analysis.
❤️ Please, support our work with like & comment! ❤️

AUDCAD SHORT FORECAST Q2 W23 D2 Y25AUDCAD SHORT FORECAST Q2 W23 D2 Y25
Professional Risk Managers👋
Welcome back to another FRGNT chart update📈
Diving into some Forex setups using predominantly higher time frame order blocks alongside intraday confirmation breaks of structure.
💡Here are some trade confluences📝
✅Daily 50 EMA
✅Weekly order block rejection
✅Daily order block rejection
✅15’ order block identification
🔑 Remember, to participate in trading comes always with a degree of risk, therefore as professional risk managers it remains vital that we stick to our risk management plan as well as our trading strategies.
📈The rest, we leave to the balance of probabilities.
💡Fail to plan. Plan to fail.
🏆It has always been that simple.
❤️Good luck with your trading journey, I shall see you at the very top.
🎯Trade consistent, FRGNT X
AUD_CAD BULLISH BIAS|LONG|
✅AUD_CAD is approaching a demand level around 0.8800
So according to our strategy
We will be looking for the signs of the reversal in the trend
To jump onto the bullish bandwagon just on time to get the best
Risk reward ratio for us
LONG🚀
✅Like and subscribe to never miss a new idea!✅
Disclosure: I am part of Trade Nation's Influencer program and receive a monthly fee for using their TradingView charts in my analysis.

AUDCAD On The Rise! BUY!
My dear followers,
I analysed this chart on AUDCAD and concluded the following:
The market is trading on 0.8864 pivot level.
Bias - Bullish
Technical Indicators: Both Super Trend & Pivot HL indicate a highly probable Bullish continuation.
Target - 0.8903
Safe Stop Loss - 0.8843
About Used Indicators:
A super-trend indicator is plotted on either above or below the closing price to signal a buy or sell. The indicator changes color, based on whether or not you should be buying. If the super-trend indicator moves below the closing price, the indicator turns green, and it signals an entry point or points to buy.
Disclosure: I am part of Trade Nation's Influencer program and receive a monthly fee for using their TradingView charts in my analysis.
———————————
WISH YOU ALL LUCK

AUDCADOn the daily chart we have a change of character indicating a shift in order flow from bullish to bearish.
Though we have a shift in order flow, the entry model is ranked moderate to weak, meaning there is a possibility price might push higher during correction. Either way, we are short on this pair.

Tariffs. Turbulence. OpportunityMarkets Rattle as Global Currencies Slide: Central Banks Prepare to Act
Global financial markets plunged on Monday as U.S. tariffs under the Trump administration, alongside retaliatory measures from key trading partners, officially took effect. The result: a wave of uncertainty and volatility that sent the Australian, Canadian, and New Zealand dollars spiraling to steeply discounted levels.
As this new economic reality unfolds, institutional investors and households alike are scrambling to adjust. In response, central banks across the globe face mounting pressure to stabilize their economies. The most immediate solution? Accelerated interest rate cuts.
Beyond the headline noise of trade wars, the deeper concern lies in domestic economic resilience. Economists and central bankers are increasingly turning inward, looking to bolster aggregate demand through aggressive monetary easing. The U.S. Federal Reserve, nudged persistently by President Trump, has already signaled its willingness to comply. Other central banks are expected to follow suit as nations seek to shield local industries from the impact of trade disruption.
The era of lower global interest rates appears to be more than a passing phase—it is becoming the new norm. In volatile times, disciplined strategies and a long-term lens are more essential than ever. We remain focused on seizing value where others see only risk.

AUDCAD: Bearish Forecast & Outlook
The analysis of the AUDCAD chart clearly shows us that the pair is finally about to tank due to the rising pressure from the sellers.
Disclosure: I am part of Trade Nation's Influencer program and receive a monthly fee for using their TradingView charts in my analysis.
❤️ Please, support our work with like & comment! ❤️

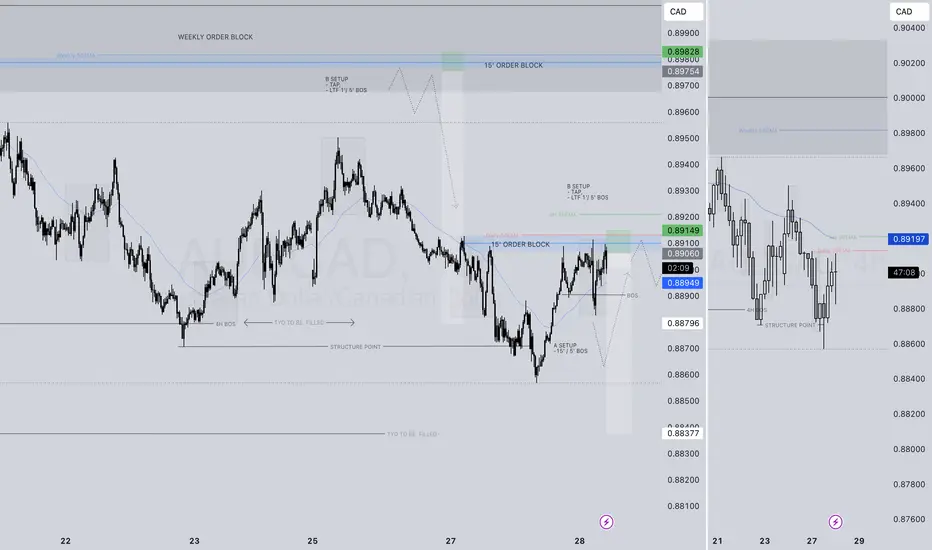
POI = LIQUIDITY AUDCAD SHORT FORECAST Q2 W22 D29 Y25
AUDCAD SHORT FORECAST Q2 W22 D29 Y25
POI = LIQUIDITY = Let's print money!
Professional Risk Managers👋
Welcome back to another FRGNT chart update📈
Diving into some Forex setups using predominantly higher time frame order blocks alongside intraday confirmation breaks of structure.
💡Here are some trade confluences📝
✅Weekly 50 EMA
✅Weekly order block rejection
✅Daily order block rejection
✅15’ order block identification
🔑 Remember, to participate in trading comes always with a degree of risk, therefore as professional risk managers it remains vital that we stick to our risk management plan as well as our trading strategies.
📈The rest, we leave to the balance of probabilities.
💡Fail to plan. Plan to fail.
🏆It has always been that simple.
❤️Good luck with your trading journey, I shall see you at the very top.
🎯Trade consistent, FRGNT X

Potential bearish drop?AUD/CAD is rising towards the pivot and could drop from this level to the 1st support.
Pivot: 0.89626
1st Support: 0.87895
1st Resistance: 0.90356
Risk Warning:
Trading Forex and CFDs carries a high level of risk to your capital and you should only trade with money you can afford to lose. Trading Forex and CFDs may not be suitable for all investors, so please ensure that you fully understand the risks involved and seek independent advice if necessary.
Disclaimer:
The above opinions given constitute general market commentary, and do not constitute the opinion or advice of IC Markets or any form of personal or investment advice.
Any opinions, news, research, analyses, prices, other information, or links to third-party sites contained on this website are provided on an "as-is" basis, are intended only to be informative, is not an advice nor a recommendation, nor research, or a record of our trading prices, or an offer of, or solicitation for a transaction in any financial instrument and thus should not be treated as such. The information provided does not involve any specific investment objectives, financial situation and needs of any specific person who may receive it. Please be aware, that past performance is not a reliable indicator of future performance and/or results. Past Performance or Forward-looking scenarios based upon the reasonable beliefs of the third-party provider are not a guarantee of future performance. Actual results may differ materially from those anticipated in forward-looking or past performance statements. IC Markets makes no representation or warranty and assumes no liability as to the accuracy or completeness of the information provided, nor any loss arising from any investment based on a recommendation, forecast or any information supplied by any third-party.

D & 4H 50 EMA HOLD? AUDCAD SHORT FORECAST Q2 W22 D28 Y25🔥DAILY & 4H 50 EMA POI HOLD SOUTH...
AUDCAD SHORT FORECAST Q2 W22 D28 Y25
Professional Risk Managers👋
Welcome back to another FRGNT chart update📈
Diving into some Forex setups using predominantly higher time frame order blocks alongside intraday confirmation breaks of structure.
💡Here are some trade confluences📝
✅Weekly 50 EMA
✅Weekly order block rejection
✅Daily order block rejection
✅15’ order block identification
🔑 Remember, to participate in trading comes always with a degree of risk, therefore as professional risk managers it remains vital that we stick to our risk management plan as well as our trading strategies.
📈The rest, we leave to the balance of probabilities.
💡Fail to plan. Plan to fail.
🏆It has always been that simple.
❤️Good luck with your trading journey, I shall see you at the very top.
🎯Trade consistent, FRGNT X
AUDCAD The Target Is UP! BUY!
My dear friends,
Please, find my technical outlook for AUDCAD below:
The instrument tests an important psychological level 0.8873
Bias - Bullish
Technical Indicators: Supper Trend gives a precise Bullish signal, while Pivot Point HL predicts price changes and potential reversals in the market.
Target - 0.8918
Recommended Stop Loss - 0.8850
About Used Indicators:
Super-trend indicator is more useful in trending markets where there are clear uptrends and downtrends in price.
Disclosure: I am part of Trade Nation's Influencer program and receive a monthly fee for using their TradingView charts in my analysis.
———————————
WISH YOU ALL LUCK

AUD/CAD SENDS CLEAR BULLISH SIGNALS|LONG
Hello, Friends!
AUD-CAD downtrend evident from the last 1W red candle makes longs trades more risky, but the current set-up targeting 0.893 area still presents a good opportunity for us to buy the pair because the support line is nearby and the BB lower band is close which indicates the oversold state of the AUD/CAD pair.
Disclosure: I am part of Trade Nation's Influencer program and receive a monthly fee for using their TradingView charts in my analysis.
✅LIKE AND COMMENT MY IDEAS✅
