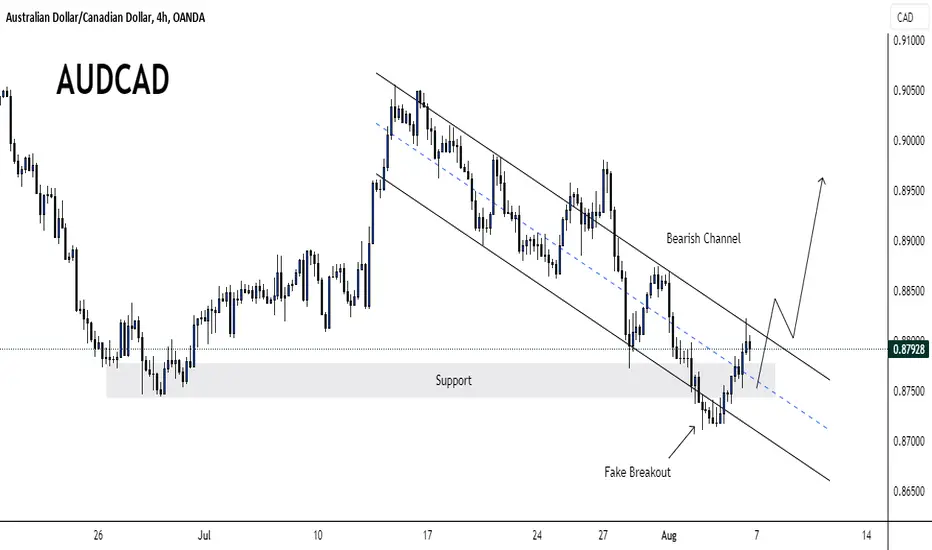
AUDCAD LONG PROJECTION#AUDCAD Even though the price did a fake breakout on support, price got managed to move back above the support and which shows this level of support created is remaining very strong for this pair. The recent price trend followed has been taken inside a bearish channel to identify the next move with breakout confirmation in the future.
AUDCAD
AUD?CAD SHORT WORKEDAUD/CAD was retesting a horizontal resistance level of 0.887 while trading in a downtrend so I thought that we will see bearish continuation and we saw it!

AUDCAD : Long Trade , 1hHello traders, we want to check the AUDCAD chart. The price has broken the downward channel and if the price pulls back to the specified key level, we expect this level to maintain the upward price trend. If the price increases, we expect it to grow around 0.88400. Good luck.

AUDCAD: Bullish Forecast & Outlook
Balance of buyers and sellers on the AUDCAD pair, that is best felt when all the timeframes are analyzed properly is shifting in favor of the buyers, therefore is it only natural that we go long on the pair.
❤️ Please, support our work with like & comment! ❤️

AUDCAD Potential UpsidesHey Traders, in today's trading session we are monitoring AUDCAD for a buying opportunity around 0.87400 zone, AUDCAD was trading in a downtrend and successfully managed to break it out. currently is in a correction phase in which it is approaching the retrace area at 0.87400 support and resistance area.
Trade safe, Joe.

AUDCAD: Time to Fall 🇦🇺🇨🇦
Update for AUDCAD.
We spotted a confirmed structure breakout on a daily, yesterday.
After a pullback, the price tested a strong intraday resistance.
A double top pattern was formed on that.
I expect a bearish move now.
Goals: 0.8742 / 0.8720
❤️Please, support my work with like, thank you!❤️


AUD/CAD Trading Opportunity! SELL!
My dear friends ,
My technical analysis for AUD/CAD is below:
The market is trading on 0.87266 pivot level.
Bias - Bearish
Technical Indicators: Both Super Trend & Pivot HL indicate a highly probable Bearish continuation.
Target - 0.86830
About Used Indicators:
A pivot point is a technical analysis indicator, or calculations, used to determine the overall trend of the market over different time frames.
———————————
WISH YOU ALL LUCK

AUDCAD: Important Breakout 🇦🇺🇨🇦
AUDCAD is trading in a bearish trend.
The price broke and closed below a key daily structure support yesterday.
The broken structure turned into a strong resistance.
I expect a further decline.
Goal: 0.8665
❤️Please, support my work with like, thank you!❤️

AUDCAD Analysis H1Here is my analysis for AUDCAD on H1 using Order Block. The price could go bearish, you can put a pending order on the Order block or find an entry on LTF within OB Zone. Trade Safe!

USDCAD I It has broken the range and channelWelcome back! Let me know your thoughts in the comments!
** USDCAD Analysis - Listen to video!
We recommend that you keep this pair on your watchlist and enter when the entry criteria of your strategy is met.
Please support this idea with a LIKE and COMMENT if you find it useful and Click "Follow" on our profile if you'd like these trade ideas delivered straight to your email in the future.
Thanks for your continued support!


AUD CAD LONGRIsky Trade which is against the trend.
Risk 0.5%
TP1 = 1:5 RR
Disclaimer:
The contents in this Idea are intended for information purpose only and do not constitute investment recommendation or advice. Nor are they used to promote any specific products or services. They serve as an integral part of a case study to demonstrate fundamental concepts in risk management under given market scenarios. A full version of the disclaimer is available in our profile description.

AUDCAD Short idea I like the bearish momentum we have seen leaving 0.8850 from midnight NY time. We had a pause and consolidation around 0.8820 right before another drop. I would like to see the price gravitate under 0.8780 and under Friday's low for Sell Stops for liquidity and if it is moving fast I would like 0.8750 as well.


AUDCADAUDCAD is reaching to very strong demand zone. As the pair is still in local bearish parallel channel, the bottom of channel is also coinciding at demand zone around 0.8750 region.
In past this region shown a strong bullish rally, are the buyers still waiting for this level?

AUD/CAD SHORT TRADE H4 SETUPI went short on this pair following a specific candlestick pattern and a support/resistance zone on the H4 timeframe.
I identified an engulfing candlestick pattern on the 4-hour chart, suggesting a potential change in market direction in favor of my short trade.
Furthermore, I noticed that the price has returned within a box that previously acted as both support and resistance. This led me to believe that the market might continue its bearish trend.
Here are my entry point, stop loss (SL), and take profit (TP) levels:
Entry point (short): 0.8820.
Stop loss (SL): 0.8881.
Take profit (TP): 0.8715.
This is just one of my trading strategies based on candlestick analysis and support/resistance levels. However, the market is always unpredictable, and trades involve risks. I maintain a strict risk management approach and am ready to adjust my stop loss and take profit as the trade evolves.
Please note that this information is provided for educational purposes only and does not constitute investment or trading advice. I encourage you to conduct further analysis and make informed decisions based on your financial situation and trading experience.

✅AUD_CAD POTENTIAL SHORT🔥
✅AUD_CAD is retesting a
Horizontal resistance level
Of 0.887 while trading in
A downtrend so I think
That we will see
Bearish continuation
SHORT🔥
✅Like and subscribe to never miss a new idea!✅

Update AUD CAD H4 BUYThe end of the long-term trend and the return of the price, please trade carefully

AUDCAD Analysis 31July2023Upon examination of the bearish channel formed a few months ago, there appears to be a flag pattern in the current price which could indicate a possible reversal. It is expected that prices will remain within a narrow range in the coming weeks. With this analysis, we can pursue scalping with a relatively low level of risk.

AUDCAD Buy Setup: Near Perfect Storm for Profits Ahead!Greetings everyone,
The AUDCAD pair presents a compelling buy opportunity, as indicated by the strong bearish pressure. This is reflected by the candlesticks' positioning under all four moving averages. Confirming our analysis, the overall market trend, as evidenced across various timeframes, aligns favorably with this trade.
To further validate our entry, we advise seeking specific bearish candlestick patterns, including the Hanging Man, Shooting Star, or Bearish Engulfing. These patterns should be identifiable on a minimum timeframe of 15 minutes, with a preference for 1-hour confirmations.
Given these parameters, we're confident in recommending a short position on the AUDCAD. As always, exercise prudent risk management in all trading decisions.

AUD CAD sell ideafull analysis for AUDCAD this week will be waiting for retracemnt to then take sells and continue trend

AUDCAD, Expecting BuyAUDCAD, I am expecting buy from 4H POI for minimum 100 pips and maximum 200 pips in one move.
