AUDCAD Technical Analysis! SELL!
My dear friends,
Please, find my technical outlook for AUDCAD below:
The instrument tests an important psychological level 0.9001
Bias - Bearish
Technical Indicators: Supper Trend gives a precise Bearish signal, while Pivot Point HL predicts price changes and potential reversals in the market.
Target - 0.8965
About Used Indicators:
Super-trend indicator is more useful in trending markets where there are clear uptrends and downtrends in price.
Disclosure: I am part of Trade Nation's Influencer program and receive a monthly fee for using their TradingView charts in my analysis.
———————————
WISH YOU ALL LUCK
AUDCAD

AUDCAD Is Very Bullish! Buy!
Here is our detailed technical review for AUDCAD.
Time Frame: 1D
Current Trend: Bullish
Sentiment: Oversold (based on 7-period RSI)
Forecast: Bullish
The market is approaching a significant support area 0.898.
The underlined horizontal cluster clearly indicates a highly probable bullish movement with target 0.913 level.
P.S
Overbought describes a period of time where there has been a significant and consistent upward move in price over a period of time without much pullback.
Disclosure: I am part of Trade Nation's Influencer program and receive a monthly fee for using their TradingView charts in my analysis.
Like and subscribe and comment my ideas if you enjoy them!

AUD/CAD BEARS WILL DOMINATE THE MARKET|SHORT
Hello, Friends!
We are now examining the AUD/CAD pair and we can see that the pair is going up locally while also being in a uptrend on the 1W TF. But there is also a powerful signal from the BB upper band being nearby, indicating that the pair is overbought so we can go short from the resistance line above and a target at 0.887 level.
Disclosure: I am part of Trade Nation's Influencer program and receive a monthly fee for using their TradingView charts in my analysis.
✅LIKE AND COMMENT MY IDEAS✅

AUDCAD Will Go Lower! Short!
Take a look at our analysis for AUDCAD.
Time Frame: 1h
Current Trend: Bearish
Sentiment: Overbought (based on 7-period RSI)
Forecast: Bearish
The market is on a crucial zone of supply 0.890.
The above-mentioned technicals clearly indicate the dominance of sellers on the market. I recommend shorting the instrument, aiming at 0.888 level.
P.S
Please, note that an oversold/overbought condition can last for a long time, and therefore being oversold/overbought doesn't mean a price rally will come soon, or at all.
Disclosure: I am part of Trade Nation's Influencer program and receive a monthly fee for using their TradingView charts in my analysis.
Like and subscribe and comment my ideas if you enjoy them!


Bearish reversal off pullback resistance?AUD/CAD is reacting off the pivot and could reverse to the 1st support.
Pivot: 0.89528
1st Support: 0.88159
1st Resistance: 0.90356
Risk Warning:
Trading Forex and CFDs carries a high level of risk to your capital and you should only trade with money you can afford to lose. Trading Forex and CFDs may not be suitable for all investors, so please ensure that you fully understand the risks involved and seek independent advice if necessary.
Disclaimer:
The above opinions given constitute general market commentary, and do not constitute the opinion or advice of IC Markets or any form of personal or investment advice.
Any opinions, news, research, analyses, prices, other information, or links to third-party sites contained on this website are provided on an "as-is" basis, are intended only to be informative, is not an advice nor a recommendation, nor research, or a record of our trading prices, or an offer of, or solicitation for a transaction in any financial instrument and thus should not be treated as such. The information provided does not involve any specific investment objectives, financial situation and needs of any specific person who may receive it. Please be aware, that past performance is not a reliable indicator of future performance and/or results. Past Performance or Forward-looking scenarios based upon the reasonable beliefs of the third-party provider are not a guarantee of future performance. Actual results may differ materially from those anticipated in forward-looking or past performance statements. IC Markets makes no representation or warranty and assumes no liability as to the accuracy or completeness of the information provided, nor any loss arising from any investment based on a recommendation, forecast or any information supplied by any third-party.

AUDCAD Will Go Higher! Long!
Please, check our technical outlook for AUDCAD.
Time Frame: 5h
Current Trend: Bullish
Sentiment: Oversold (based on 7-period RSI)
Forecast: Bullish
The market is approaching a key horizontal level 0.894.
Considering the today's price action, probabilities will be high to see a movement to 0.905.
P.S
Please, note that an oversold/overbought condition can last for a long time, and therefore being oversold/overbought doesn't mean a price rally will come soon, or at all.
Disclosure: I am part of Trade Nation's Influencer program and receive a monthly fee for using their TradingView charts in my analysis.
Like and subscribe and comment my ideas if you enjoy them!

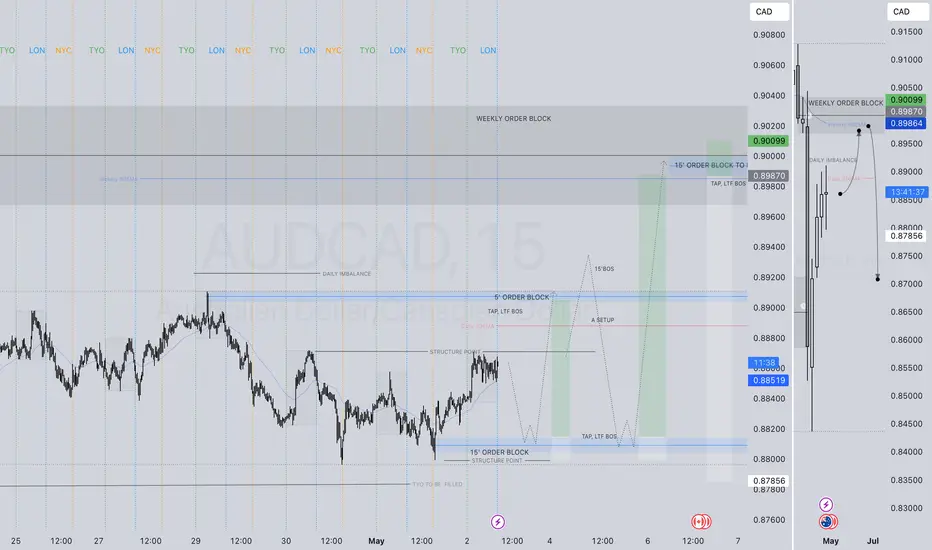
AUDCAD SHORT FORECAST Q2 W19 D5 Y25AUDCAD SHORT FORECAST Q2 W19 D5 Y25
Professional Risk Managers👋
Welcome back to another FRGNT chart update📈
Diving into some Forex setups using predominantly higher time frame order blocks alongside confirmation breaks of structure.
Let’s see what price action is telling us today!
💡Here are some trade confluences📝
✅ Weekly order block
✅Intraday 15 order block
✅Tokyo ranges to be filled
✅Intraday bearish breaks of structure to be confirmed
🔑 Remember, to participate in trading comes always with a degree of risk, therefore as professional risk managers it remains vital that we stick to our risk management plan as well as our trading strategies.
📈The rest, we leave to the balance of probabilities.
💡Fail to plan. Plan to fail.
🏆It has always been that simple.
❤️Good luck with your trading journey, I shall see you at the very top.
🎯Trade consistent, FRGNT X

AUD-CAD Correction Ahead! Sell!
Hello,Traders!
AUD-CAD keeps going up
But the pair will soon hit
A horizontal resistance level
Around 0.8936 and as the
Pair is locally overbought
We will be expecting a
Pullback and a local
Bearish correction
Sell!
Comment and subscribe to help us grow!
Check out other forecasts below too!
Disclosure: I am part of Trade Nation's Influencer program and receive a monthly fee for using their TradingView charts in my analysis.

AUD_CAD RESISTANCE AHEAD|SHORT|
✅AUD_CAD has been growing recently
And the pair seems locally overbought
So as the pair is approaching a horizontal resistance of 0.8950
Price decline is to be expected
SHORT🔥
✅Like and subscribe to never miss a new idea!✅
Disclosure: I am part of Trade Nation's Influencer program and receive a monthly fee for using their TradingView charts in my analysis.

AUDCAD LONG FORECAST Q2 W18 D2 Y25AUDCAD LONG FORECAST Q2 W18 D2 Y25
Professional Risk Managers👋
Welcome back to another FRGNT chart update📈
Diving into some Forex setups using predominantly higher time frame order blocks alongside confirmation breaks of structure.
Let’s see what price action is telling us today!
💡Here are some trade confluences📝
✅Daily 50 EMA
✅Intraday 15' order block
✅Tokyo ranges to be filled
✅Intraday bullish breaks of structure to be confirmed
🔑 Remember, to participate in trading comes always with a degree of risk, therefore as professional risk managers it remains vital that we stick to our risk management plan as well as our trading strategies.
📈The rest, we leave to the balance of probabilities.
💡Fail to plan. Plan to fail.
🏆It has always been that simple.
❤️Good luck with your trading journey, I shall see you at the very top.
🎯Trade consistent, FRGNT X
AUDCAD SHORT FORECAST Q2 W18 D2 Y25AUDCAD SHORT FORECAST Q2 W18 D2 Y25
Professional Risk Managers👋
Welcome back to another FRGNT chart update📈
Diving into some Forex setups using predominantly higher time frame order blocks alongside confirmation breaks of structure.
Let’s see what price action is telling us today!
💡Here are some trade confluences📝
✅Daily 50 EMA
✅Intraday 5' order block
✅Tokyo ranges to be filled
✅Intraday bearish breaks of structure to be confirmed
🔑 Remember, to participate in trading comes always with a degree of risk, therefore as professional risk managers it remains vital that we stick to our risk management plan as well as our trading strategies.
📈The rest, we leave to the balance of probabilities.
💡Fail to plan. Plan to fail.
🏆It has always been that simple.
❤️Good luck with your trading journey, I shall see you at the very top.
🎯Trade consistent, FRGNT X

AUDCADhello trader, here is another swing.. price is making bearish momentum (using Mcad as indicator)... price also filled the fvg of 4hrs and price is in distribution phase.. and breakout can happen anytime.. our target is first OB for double bottom or breakout of previous low to reach weekly OB (for all time low).. at the moment we are in breaish Mcad zone... also for NZDCAD you expect the same setup..
goodluck

AUDCAD: Expecting Bullish Movement! Here is Why:
Looking at the chart of AUDCAD right now we are seeing some interesting price action on the lower timeframes. Thus a local move up seems to be quite likely.
Disclosure: I am part of Trade Nation's Influencer program and receive a monthly fee for using their TradingView charts in my analysis.
❤️ Please, support our work with like & comment! ❤️

AUDCAD: Bearish Wave Continues 🇦🇺🇨🇦
I think that there is a high chance that AUDCAD
will continue falling from the underlined yellow resistance.
Next support - 0.8818
❤️Please, support my work with like, thank you!❤️
I am part of Trade Nation's Influencer program and receive a monthly fee for using their TradingView charts in my analysis.

AUDCAD SHORT FORECAST Q2 W18 D30 Y25AUDCAD SHORT FORECAST Q2 W18 D30 Y25
Professional Risk Managers👋
Welcome back to another FRGNT chart update📈
Diving into some Forex setups using predominantly higher time frame order blocks alongside confirmation breaks of structure.
Let’s see what price action is telling us today!
💡Here are some trade confluences📝
✅Daily 50 EMA
✅Intraday 5' order block
✅Tokyo ranges to be filled
✅Intraday bearish breaks of structure to be confirmed
🔑 Remember, to participate in trading comes always with a degree of risk, therefore as professional risk managers it remains vital that we stick to our risk management plan as well as our trading strategies.
📈The rest, we leave to the balance of probabilities.
💡Fail to plan. Plan to fail.
🏆It has always been that simple.
❤️Good luck with your trading journey, I shall see you at the very top.
🎯Trade consistent, FRGNT X

AUDCAD SHORT FORECAST Q2 W18 D29 Y25AUDCAD SHORT FORECAST Q2 W18 D29 Y25
Professional Risk Managers👋
Welcome back to another FRGNT chart update📈
Diving into some Forex setups using predominantly higher time frame order blocks alongside confirmation breaks of structure.
Let’s see what price action is telling us today!
💡Here are some trade confluences📝
✅Daily 50 EMA
✅Intraday 15' order block to be created
✅Tokyo ranges to be filled
✅Intraday bearish breaks of structure to be confirmed
🔑 Remember, to participate in trading comes always with a degree of risk, therefore as professional risk managers it remains vital that we stick to our risk management plan as well as our trading strategies.
📈The rest, we leave to the balance of probabilities.
💡Fail to plan. Plan to fail.
🏆It has always been that simple.
❤️Good luck with your trading journey, I shall see you at the very top.
🎯Trade consistent, FRGNT X

AUDCAD SHORT FORECAST WEEKLY DAILY 50EMA Q2 W17 D25 Y25AUDCAD SHORT FORECAST WEEKLY DAILY 50EMA Q2 W17 D25 Y25
Professional Risk Managers👋
Welcome back to another FRGNT chart update📈
Diving into some Forex setups using predominantly higher time frame order blocks alongside confirmation breaks of structure.
Let’s see what price action is telling us today!
💡Trade confluences📝
✅Daily 50 EMA
✅Intraday 15' bearish breaks of structure to be created
✅Daily order block mitigated
✅Previous daily imbalance fill upon short positon
✅Tokyo ranges to be filled
🔑 Remember, to participate in trading comes always with a degree of risk, therefore as professional risk managers it remains vital that we stick to our risk management plan as well as our trading strategies.
📈The rest, we leave to the balance of probabilities.
💡Fail to plan. Plan to fail.
🏆It has always been that simple.
❤️Good luck with your trading journey, I shall see you at the very top.
🎯Trade consistent, FRGNT X

AUD/CAD BEARISH BIAS RIGHT NOW| SHORT
Hello, Friends!
We are now examining the AUD/CAD pair and we can see that the pair is going up locally while also being in a uptrend on the 1W TF. But there is also a powerful signal from the BB upper band being nearby, indicating that the pair is overbought so we can go short from the resistance line above and a target at 0.879 level.
Disclosure: I am part of Trade Nation's Influencer program and receive a monthly fee for using their TradingView charts in my analysis.
✅LIKE AND COMMENT MY IDEAS✅

#AUDCAD: 550+ Swing Sell Intraday Setup Idea! The AUDCAD has hit a major snag and is currently rejected from that area. The way the price has been moving lately has completely changed our minds, so we’re now completely bearish.
Thanks for your support! 😊
If you want to help us out, here are a few things you can do:
- Like our ideas
- Comment on our ideas
- Share our ideas
Team Setupsfx_

Daily Price Action: AUDCAD Wednesday 4/23/2025In this video, we will be looking into the potential price action of AUDCAD.

AUDCAD...SHORTOANDA:AUDCAD
Market structure suggests is preparing for its next move. The level will likely play a critical role in the upcoming direction.
If structure breaks and confirms the shift, a new bias might form after the retest.

Daily Price Action AUDCAD Tuesday 4/22/2025In this video, we will be looking into the potential price action of AUDCAD.
