AUDCAD - 4hrs ( Down + 80 PIP / Tp 2 > Full TP 160 PIP ) Pair Name : AUD/CAD
Time Frame : 4hrs
Scale Type : Large Scale
Analysis Way : Volume + Classic + High & low + Market Map
Direction : Natural - Lead To Long
📋 Educational / Short
—————**-
🗒 Just browsing through my analysis means a lot to me.
➡️ Update -
————
VIP Opportunity
Take Profit 1 + 2
Account Growth = 10 %
Pip' Achieved = 80 PIP
last target 160 PIP
AUDCAD

AUDCAD - 4hrs ( Down + 120 PIP / Tp 3 > full Tp 160 PIP )Pair Name : AUD/CAD
Time Frame : 4hrs
Scale Type : Large Scale
Analysis Way : Volume + Classic + High & low + Market Map
Direction : Natural - Lead To Long
📋 Educational / Short
—————**-
🗒 Just browsing through my analysis means a lot to me.
➡️ Update -
————
VIP Opportunity
Take Profit 1 + 2 + 3
Account Growth = 15 %
Pip' Achieved = 120 PIP

une continuité de la tendance baissièreCette paire semble continuer sa descente. La tendance est donc baissière.

AUD/CAD Hit All Target Full Closed +250 Pips What A Sniper EntryAUD/CAD Hit All Target Full Closed +250 Pips What A Sniper Entry

AUD/CAD Analysis H1Here is my view for AUDCAD on H1. The price could go bearish, you can put a pending order on the Order block or find an entry on LTF within OB Zone. Trade Safe!

AUDCAD SHORT - BIG BREAKOUT!Waiting for a retest of 0.89567 to short AUDCAD back to 4H key level at 0.88319
If you agree drop a like and if you have any questions leave a comment :)


AUDCAD Potential DownsidesHey Traders, in the coming week we are monitoring AUDCAD for a selling opportunity around 0.89400 zone, AUDCAD is trading in a downtrend and currently seems to be in a correction phase in which it is approaching the major trend at 0.89400 support and resistance zone, i would also keep an eye on the stock market to confirm the bias as AUDCAD does correlate positively with indices.
Trade safe, Joe.

🔥 NEW: AUDCAD...UT (5D) 🔥 POSITION TRADE 🔥-SL @ 0.9945 🚫
SLO @ 0.9866 ⏳
TP4 @ 0.9800 (closing ALL Buy Orders)
TP3 @ 0.9625 (shaving 25%)
TP2 @ 0.9340 (shaving 25%)
TP1 @ 0.9150 (shaving 25%)
BSO @ 0.8890 ⏳
-SL @ 0.8800 🚫

Frustrated with AUDCAD during NY sessionOANDA:AUDCAD
Big nothing for over 7 hours.
Closed out at 3pips, as I didnt want to gamble into NY close
AGAIN, NY Session....I can do with it really
ARRGGGHHHHH
LOL

AUD/CAD Trading Opportunity! BUY!
My dear friends ,
I analysed this chart on AU/CAD, and concluded the following:
The market is trading on 0.88728 pivot level.
Bias - Bullish
Technical Indicators: Supper Trend generates a clear long signal while Pivot Point HL is currently determining the overall Bullish trend of the market.
Target - 0.89409
About Used Indicators:
A super-trend indicator is plotted on either above or below the closing price to signal a buy or sell. The indicator changes color, based on whether or not you should be buying. If the super-trend indicator moves below the closing price, the indicator turns green, and it signals an entry point or points to buy.
———————————
WISH YOU ALL LUCK

AUDCAD I Watch for this 🎯Welcome back! Let me know your thoughts in the comments!
** AUDCAD Analysis - Listen to video!
We recommend that you keep this pair on your watchlist and enter when the entry criteria of your strategy is met.
Please support this idea with a LIKE and COMMENT if you find it useful and Click "Follow" on our profile if you'd like these trade ideas delivered straight to your email in the future.
Thanks for your continued support!

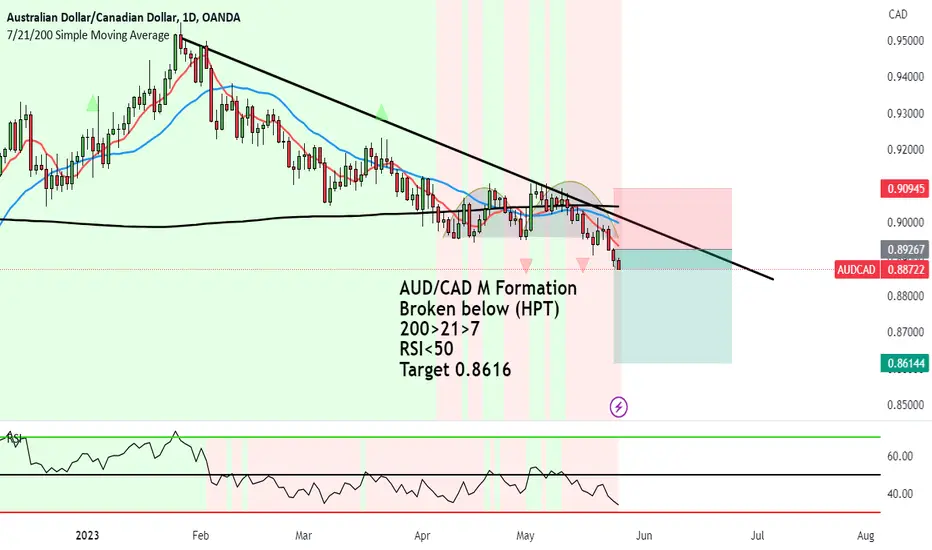
AUD/CAD short after break below the M Formation target 0.8616AUD/CAD M Formation formed.
The price has broken below recently.
And the previous trend was down showing giving a high probability setup.
200>21>7
RSI<50
Target 0.8616
AUDCAD, A breakoutAUDCAD / 1D
Hello traders, welcome back to another market breakdown.
AUDCAD has been trading in a down trend. The price has broken from the last range. I'm expecting more down side on this pair.
Checkout the chart for the setup I'll be waiting for.
Trade safely,
Tarder Leo.

AUDCAD - Took 10 spotOANDA:AUDCAD
Loonie gave me my 10 pips
Took a short a little after Asia open, took some time to get this to hit.

AUD/CAD +200 Pips Only 50 Pips To Hit All Targets And Be Closed AUD/CAD +200 Pips Only 50 Pips To Hit All Targets And Be Closed
