AUD/JPY Made Reversal Pattern&Closed below My Supp, Short ?This is an educational + analytic content that will teach why and how to enter a trade
Make sure you watch the price action closely in each analysis as this is a very important part of our method
Disclaimer : this analysis can change at anytime without notice and it is only for the purpose of assisting traders to make independent investments decisions
Audcadanalysis

AUDCAD: Reversal Zones 🔄Price has trapped sellers with the false breakout of the head and shoulders.
Since we have already swept a strong area of support to the left, I believe price may want to react at one of these major demands for buyers.
I have my alerts set and will take a buy trade with the team IF criteria is met.
Traders, if you have your own opinion about this idea, write in the comments section, I always reply. 💬
--------------------------------------------------------------------------------------------------------
Please like, subscribe, and share this idea with others! ⬇️
--------------------------------------------------------------------------------------------------------

AUDCADHI TRADERS! Thought I would do A lower timeframe analysis, to show you guys why I entered this trade. If you have any questions, feel free to direct message me or comment. Thank you.

DeGRAM | AUDCAD break the descending channelAUDCAD made a sharp move up. There is no clear trend.
We expect some consolidation.
-------------------
Share your opinion in the comments and support the idea with like. Thanks for your support!

AUD/CAD Potential Buy Setup - London SessionI am looking at a potential buy setup in the London session if price can reach this area with a bullish confirmation.
I will not be going into the technical reasons for this trade idea.

AUDCAD LONGHi traders, this is the trade I entered yesterday. this is part of my swing strategy, ive been working on the past few months. If you have any questions feel free to comment or privately contact me. THANK YOU.

AUD/CAD Long Setup , We Need A Daily Confirmation First This is an educational + analytic content that will teach why and how to enter a trade
Make sure you watch the price action closely in each analysis as this is a very important part of our method
Disclaimer : this analysis can change at anytime without notice and it is only for the purpose of assisting traders to make independent investments decisions


DeGRAM | AUDCAD selling a pullback AUDCAD made lower lows as predicted yesterday.
Price action pulled back to the resistance/swing zone.
This is a breakout pullback continuation pattern.
-------------------
Share your opinion in the comments and support the idea with like. Thanks for your support!

AUDCAD $AUDCAD Initial ShortAUDCAD $AUDCAD Initial Short. TP and SL on chart. Move SL on TP. After TP2, trail with 0.5ATR step and 1.5ATR offset.

AUDCAD $AUDCAD Initial ShortAUDCAD $AUDCAD Initial Short. TP and SL on chart. Move SL on TP. After TP2, trail with 0.5ATR step and 1.5ATR offset.

AudcadThis is just based on speculation
Don't ever chase price wait for it to play into your zone then strike

DeGRAM | AUDCAD sell pullback AUDCAD is in a bearish trend.
This is going to be a simple breakout - pullback - continuation trade.
-------------------
Share your opinion in the comments and support the idea with like. Thanks for your support!

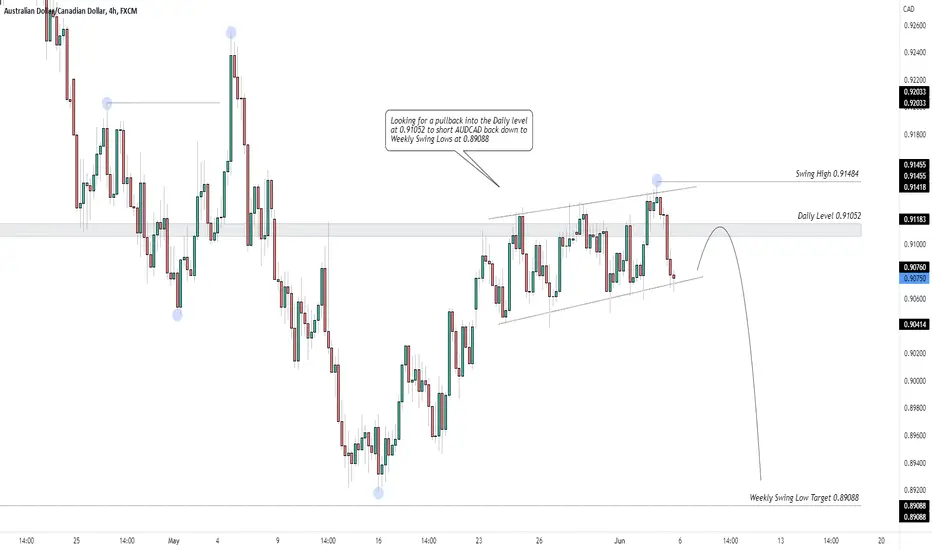
AUDCAD - BACK DOWN TO WEEKLY LOWS!Looking for a pullback into the Daily level at 0.91052 to short AUDCAD back down to Weekly Swing Lows at 0.89088.
If you agree drop a like and if you have any questions leave a comment :)
Trend continuation, short AUDCAD – the week of 30 May, 2022This pair has been bearish since April. The recent retracement has been mostly corrective in nature and now price is stalling around the 0.9100 S/R area. I am looking for the opportunity to take a short targeting the next support at 0.8920.
If you like my analysis, please give it a “thumbs up” and follow me to get immediate notifications.
Always use sound money and risk management and stay patient in all your trades.

AUDCAD Buy & Sel Long#AUDCAD 4H SET UP
Bullish then Bearish
Sell Long
Buy Long
Buy Now
Sell limit 0.94750

AUDCAD- Analysis Hello traders,
Hope you are having an amazing day and looking towards a profitable week ahead.
AUDCAD analysis shared with the ETGL group is playing out perfectly, anticipating further push to the downside before we make another rally to the highs.
Although we're approaching the end of the month, the market is likely to be more volatile than other days. However, the bias remains intact.
Looking forward to see how this trade plays out.
Good luck & happy trading.
ETGL TEAM 💛

AUDCAD hrly long | Algo tradingAUDCAD hrly long
buystop @ .91167
TP #1 @ .91379 82% wr
TP #2 @ .91635 56% wr
SL @ swing low .90425 12% wr
WR and HR Determined from past trades on this pair, on this timeframe.
More trades like this on my profile and on Bifrost trades

AUDCAD | RESISTANCE AHEADAUDCAD has reached its resistance zone where it formed a double top pattern. The price took the beating from there and we saw a drop.
It has near support around 0.90550 which is the last resort for the bulls. Watch this level and place short order if price breaks

AUDCAD Going Drop From 0.90978 to 0.88373as per my fibbo analysis, audcad going to drop from 0.90978 to 0.88373.take postion after confirmation signal

DeGRAM | AUDCAD selling on retracementAUDCAD is still in a downtrend on higher timeframes.
Price action created a complex pullback.
Currently, it is testing the psychological resistance level 0.91000.
-------------------
Share your opinion in the comments and support the idea with like. Thanks for your support!

AUDCAD seems BullishThe market of AUDCAD takes support and now moving upside. I believe the journey of Bullish momentum will remain continue. Better to look buying opportunity on it.

AUDCAD Will Fall!AUD-CAD is retesting a resistance cluster AT 0.9080
Which makes me bearish biased on the pair
And as we are already seeing some bearish price action
I think that the next move will be downwards
To retest the target level below AT 0.8890
