AUDCAD BULLISH SIDE MONEY HEIST PLANMy Dear Robbers / Traders,
This is our master plan to Heist AUDCAD bank based on Thief Trading style Technical Analysis.. kindly please follow the plan I have mentioned in the chart focus on Long entry. Our target is Red Zone that is High risk Dangerous level, market is overbought / Consolidation / Trend Reversal at the level Bearish Robbers / Traders gain the strength. Be safe and be careful and Be rich.
Note: If you've got a lot of money you can get out right away otherwise you can join with a swing trade robbers and continue the heist plan, Use Trailing SL to protect our money.
Stop Loss : Recent Swing Low using 4h timeframe
Warning : Fundamental Analysis comes against our robbery plan. our plan will be ruined smash the Stop Loss. Don't Enter the market at the news update.
Loot and escape on the target 🎯 Swing Traders Plz Book the partial sum of money and wait for next breakout of dynamic level / Order block, Once it is cleared we can continue our heist plan to next new target.
support our robbery plan we can easily make money & take money 💰💵 Join your hands with US. Loot Everything in this market everyday
Audcadidea

AUDCAD TRADE SETUP 4HHello traders ,
This my idea for Long. AUDCAD Once 4H Candle Retest. I am ready to Long.
this is my ideas only. what you are flow your trading statistics you can continue.
If you need more my ideas follow me

Unleashing Trade Opportunities in Ranging Markets! AUDCAD📊 In this analysis, we dissect the AUDCAD currency pair, meticulously exploring its behavior on the 1D, 4H and 30m time frames. Brace yourself for insights into range-bound dynamics! 🎯
🔍 Key Takeaways:
💹 1: Learn how to spot breakouts when the market defies its established structure.
💹 2: Discover actionable strategies for capitalising on range-bound conditions.
Remember, this content is for educational purposes only—always make independent trading decisions based on your risk management strategy.

AUDCAD Bearish Harmonic Pattern - Strategic Trade SetupThe AUDCAD pair is currently exhibiting a Bearish Harmonic Pattern (XABCD), with Point D anticipated to act as a Potential Reversal Zone (PRZ). This analysis aims to identify strategic entry and exit points based on the confluence of multiple technical indicators.
Key Technical Indicators
Potential Reversal Zone (PRZ):
Point D aligns with a significant Key Resistance area, which historically serves as a strong barrier to upward price movement.
4-hour Trend Line:
The trend line, which has acted as a pivotal point in previous market movements, intersects at Point D, reinforcing the likelihood of a reversal.
Bearish RSI Divergence (1-hour):
The Relative Strength Index (RSI) on the 1-hour chart displays a bearish divergence, suggesting weakening bullish momentum and potential for a bearish reversal.
Trade Setup
Entry Point:
A strategic entry is recommended at 0.91113, where the confluence of the aforementioned technical factors indicates a high probability of a trend reversal.
Stop Loss:
To mitigate risk, a stop loss should be placed at 0.91261, slightly above the resistance level to avoid false breakouts.
Take Profit Levels:
TP-1: 0.90964
The first take profit level is set at 0.90964, capturing initial downward momentum and ensuring partial profit realization.
TP-2: 0.90816
The second take profit level at 0.90816 aims to capitalize on further bearish movement, aligning with intermediate support zones.
TP-3: 0.90668
The final take profit target at 0.90668 corresponds to a more significant support level, maximizing potential gains from the bearish trend reversal.
Conclusion:
Based on the technical analysis, the AUDCAD pair presents a compelling bearish setup with multiple converging indicators at Point D. The proposed entry at 0.91113, supported by a precise stop loss and structured take profit levels, offers a well-balanced risk-reward ratio. Traders are advised to monitor price action closely as it approaches the PRZ to confirm bearish momentum before executing the trade.

AUDCAD Technical Analysis and Trade IdeaThe AUDCAD has been in a strong bullish trend as evident on the daily time frame. We are looking for a trend continuation opportunity if price action plays out as described in the video. Throughout the video we discuss the trend, price action, market structure and other important aspects of technical analysis, and we look at a potential trade idea.
Remember, trading involves risks, so always manage your risk carefully. And keep in mind that this information is for educational purposes only—it’s not financial advice. 📈👍

AUDCAD:🔴Bearish scenario...!🔴
Hello Traders
As you can see the price purged the daily buy-side liquidity and then the market structure was shifted on the hourly chart.
Now the price is inside a range, creating the double purge scenario for us.
If the price sweeps the buy side liquidity first, it is a chance to enter the sell position with LTF confirmation.
💡Wait for the update!
🗓️10/05/2024
🔎 DYOR
💌It is my honor to share your comments with me💌

AUDCAD Short Trade Setup A #short trade opportunity recently presented itself on the #aussieloonie (#AUDCAD) #trading chart 📉.
This is indicated by the #bearish engulfing candlestick 🕯️ pattern just below the 0.90717 horizontal resistance level.
This indicates a rejection of the same level, with potential price move in the downward 👇 ⬇️ direction (#sell).
Sufficient downward momentum should see price dumping towards the 0.88500 psychological level and possibly testing the strength of the 0.88046 horizontal support level.
As always, please apply appropriate risk management.
Happy trading!
#crosspair

AUD/CAD Giving Good Bullish P.A , Long Setup To Get 100 Pips !This Is An Educational + Analytic Content That Will Teach Why And How To Enter A Trade
Make Sure You Watch The Price Action Closely In Each Analysis As This Is A Very Important Part Of Our Method
Disclaimer : This Analysis Can Change At Anytime Without Notice And It Is Only For The Purpose Of Assisting Traders To Make Independent Investments Decisions.

AUDCAD Trade IdeaIn this video, we delve into a comprehensive technical analysis and trading concept for AUDCAD. Our assessment reveals a potential trade opportunity. We meticulously analyze the current price action, closely scrutinize market structure, and incorporate market dynamics. Based on favorable conditions, we identify a potential entry point. However, it is crucial to underscore the significance of implementing robust risk management strategies. Please note that this video is purely educational and should not be construed as financial advice.

AUDCAD I Potential intraday long Welcome back! Let me know your thoughts in the comments!
** AUDCAD Analysis - Listen to video!
We recommend that you keep this pair on your watchlist and enter when the entry criteria of your strategy is met.
Please support this idea with a LIKE and COMMENT if you find it useful and Click "Follow" on our profile if you'd like these trade ideas delivered straight to your email in the future.
Thanks for your continued support!

AUDCAD - Looking To Buy Pullbacks In The Short termH1 - Bullish trend pattern.
Currently it looks like a pullback is happening.
I expect the price to move higher further in the short term until the strong support zone holds.

AUD/CAD Bullish At The Moment , Time To Buy Now Or Wait ?This Is An Educational + Analytic Content That Will Teach Why And How To Enter A Trade
Make Sure You Watch The Price Action Closely In Each Analysis As This Is A Very Important Part Of Our Method
Disclaimer : This Analysis Can Change At Anytime Without Notice And It Is Only For The Purpose Of Assisting Traders To Make Independent Investments Decisions.

AUDCAD Trade IdeaThe AUDCAD pair has reached a critical support level, marked by this horizontal line on our chart that corresponds to a previous daily open/close. The price is clearly overextended and we expect a correction soon. A potential trade setup may arise later today when the Canadian GDP data is announced. If the data is positive for the CAD, this could offer a good sell opportunity. We are eagerly awaiting this news release. Please note that this is only a trade idea and not a trade recommendation, the information is for educational purposes only and should not be considered as financial advice.

AUDCAD H1 / Expecting a Strong Bullish Move 💲📈 Hello Traders!
This is my forecast for AUDCAD H1. I expect a bullish move on H1 if the retracement will be valid. I expect a rise until the OB around the price of 0.89700.
Traders, if you liked my idea or if you have a different vision related to this trade, write in the comments. I will be glad to see your perspective.
____________________________________
Follow, like, and comment to see my content:
www.tradingview.com

AUDCAD I Intraday buy from support Welcome back! Let me know your thoughts in the comments!
** AUDCAD Analysis - Listen to video!
We recommend that you keep this pair on your watchlist and enter when the entry criteria of your strategy is met.
Please support this idea with a LIKE and COMMENT if you find it useful and Click "Follow" on our profile if you'd like these trade ideas delivered straight to your email in the future.
Thanks for your continued support!

7 Dimension Analysis for AUDCAD 😇 7 Dimension Analysis
Time Frame: H4
1️⃣ Swing Structure: Bullish
🟢 Structure Behavior: Break of Structure (BoS)
🟢 Swing Move: Impulsive
🟢 Inducement: Done
🟢 Internal Structure: Also bullish
🟢 Decisional FVG liquidity: Mitigated, Making a prebreak out Buildup
🟢 Traps: Fakeout done at the top, grabbed all the swing liquidity from lower side
2️⃣ Pattern
🟢 CHART PATTERNS: Continuation Ascending Triangle
🟢 CANDLE PATTERNS: This is a consolidation area; no valid candle pattern is observed. We will check our candle patterns at the breakout or market opening
3️⃣ Volume
🟢 We need a deep observation of volume on the breakout
🟢 less than the previous move
4️⃣ Momentum RSI
🟢 Zone: Sideways
🟢 Range shift: Bullish to sideways
🟢 Divergence: A bearish divergence is here, but it's weak
5️⃣ Volatility Bollinger Bands
🟢 High level of contraction
🟢 Various Band Punchers on the upper band, but they don't follow up the signal
6️⃣ Strength According to ROC
🟢 Values: AUD is 7.01 vs CAD 3.02
7️⃣ Sentiment
When we mix up all the parameters, there is a high chance the price can go up during the coming sessions, so we need to seek buy entries during the week
✔️ Entry Time Frame: H4
✅ Entry TF Structure: Sideways as internal
☑️ Current move: Impulsive sideways
✔ Support resistance base: Fixed range volume POI
☑️ Candles Behavior: Nothing is clear
💡 Decision: We need to wait for the price to break the upper level or come downside to our POI area, then we can buy this pair
🚀 Entry: 0.8980
✋ Stop Loss: 0.8925
🎯 Take Profit: 0.9150
2nd If Internal Structure changes also Exit 3rd Trendline Breakout, Fomo
😊 Risk to Reward Ratio: 3.1
🕛 Expected Duration: 7 days
SUMMARY: The analysis indicates a bullish stance with a well-defined structure and pattern, though the candle patterns are not clear at the moment. The decision suggests waiting for a breakout or a move to the POI area for a buy entry, considering potential internal structure changes and trendline breakouts.

AUDCAD Short Term Sell IdeaH1 - Bearish trend pattern.
Currently it looks like a pullback is happening.
Until the two strong resistance zones hold my short term view remains bearish here.

AUDCADI am expecting AUDCAD to make a move upward, thereby taking out the previous high before making way to my TP.

AUDCADAUDCAD long term view is bullish where we expect price to grow from the current moment and there are three possible three target, possible of reaching all target duration will be by end of the January. Reason for buying is totally based on technical side of the market and charts does show strong bullish bias. Like and Comment ;)

#AUDCAD|| 600+ Buying Setup||Dear Traders,
XAU and AUD are positively correlated which means when price of GOLD goes up AUD goes up too. Hence, AUDCAD dropped heavily in recent time and therefore price is at the 'discounted level' where big buys are expected within the next week. It is crucial to enter with good risk management. Next week is likely to be volatile.
Good Luck and Like and Follow!!

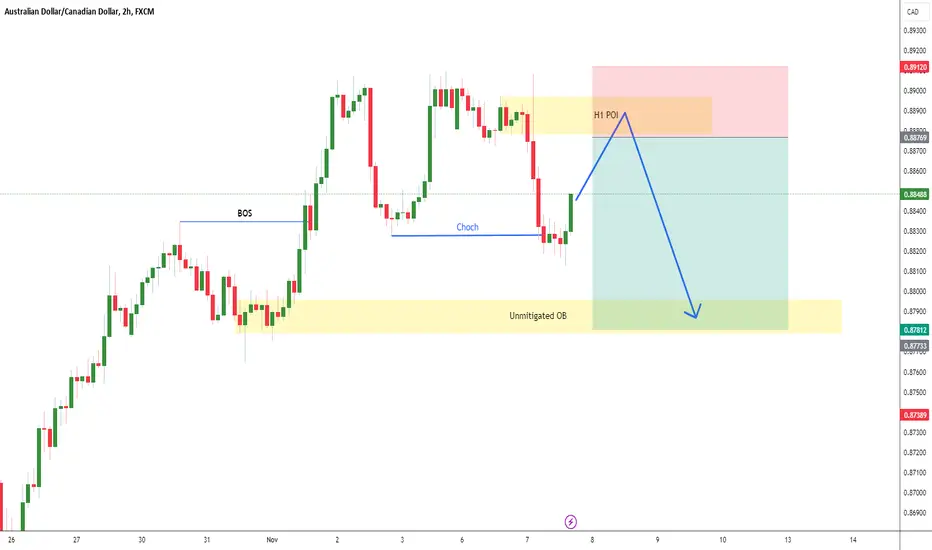
AUDCAD, Expecting down H1AUDCAD, i am Expecting down in H1 soon but it will go a little bit up to take the POI then it will fall directly down to unmitted OB.
AUDCAD Analysis H4Here is my analysis for AUDCAD on H4 using Order Block. The price could go bullish, you can put a pending order on the Order block or find an entry on LTF within OB Zone. Trade Safe!

AUDCAD Analysis H4Here is my analysis for AUDCAD on H4 using Order Block. The price could go bearish, you can put a pending order on the Order block or find an entry on LTF within OB Zone. Trade Safe!
