AUDCAD – DAILY FORECAST Q3 | W31 | D30 | Y25
📊 AUDCAD – DAILY FORECAST
Q3 | W31 | D30 | Y25
Daily Forecast 🔍📅
Here’s a short diagnosis of the current chart setup 🧠📈
Higher time frame order blocks have been identified — these are our patient points of interest 🎯🧭.
It’s crucial to wait for a confirmed break of structure 🧱✅ before forming a directional bias.
This keeps us disciplined and aligned with what price action is truly telling us.
📈 Risk Management Protocols
🔑 Core principles:
Max 1% risk per trade
Only execute at pre-identified levels
Use alerts, not emotion
Stick to your RR plan — minimum 1:2
🧠 You’re not paid for how many trades you take, you’re paid for how well you manage risk.
🧠 Weekly FRGNT Insight
"Trade what the market gives, not what your ego wants."
Stay mechanical. Stay focused. Let the probabilities work.
FX:AUDCAD
Audcadlong

AUDCAD – WEEKLY FORECAST Q3 | W31 | Y25📊 AUDCAD – WEEKLY FORECAST
Q3 | W30 | Y25
Weekly Forecast 🔍📅
Here’s a short diagnosis of the current chart setup 🧠📈
Higher time frame order blocks have been identified — these are our patient points of interest 🎯🧭.
It’s crucial to wait for a confirmed break of structure 🧱✅ before forming a directional bias.
This keeps us disciplined and aligned with what price action is truly telling us.
📈 Risk Management Protocols
🔑 Core principles:
Max 1% risk per trade
Only execute at pre-identified levels
Use alerts, not emotion
Stick to your RR plan — minimum 1:2
🧠 You’re not paid for how many trades you take, you’re paid for how well you manage risk.
🧠 Weekly FRGNT Insight
"Trade what the market gives, not what your ego wants."
Stay mechanical. Stay focused. Let the probabilities work.
FX:AUDCAD

AUDCAD Forex Heist Plan: Entry, SL & TP by Thief Trader Style🏴☠️🔥 AUD/CAD Bank Heist Plan – Thief Trader's Long Con in Motion! 🔥🏴☠️
Breakout Bulls vs Bearish Guards – Who Wins the Forex Vault This Time?
🌍 Hello Money Makers, Market Bandits, and Strategic Robbers! 💰🚀💣
It’s Thief Trader back again, dropping heat with another high-stakes Forex bank job – this time we're targeting the AUD/CAD vault. This is not your grandma’s trading plan. We’re executing a well-calculated heist based on a fusion of technical breakouts + fundamental drivers with a dose of pure trading psychology warfare. 🎯
💼 The Heist Blueprint: Long Entry Game Plan
🧠 Our job is to move in silence until the breakout alarms go off.
We target 0.90200 as the clean breakout trigger over the Moving Average. This zone marks the guard shift — bulls take over if we break through.
📌 Entry Types (Choose your weapon):
🔹 Buy Stop: Above 0.90200 (Post-MA breakout confirmation).
🔹 Buy Limit (DCA Style): Set limit buys at recent lows (M15/M30 swing low) for pullback entries. Layer your entries like a true strategist.
🔔 Set Alerts: Don't sleep on this. Place alerts at breakout zones – let the chart notify you when the bank door opens. 📡
🛑 Risk Management – The Escape Plan
We don't jump in blind. Place your Stop Loss ONLY AFTER the breakout confirms.
📍Suggested SL: 0.89600, near recent 4H wick low.
🔥 Reminder: Your stop depends on your lot size, risk tolerance, and how many entries you're stacking. Don't set it too tight – we don't want early alarms killing the mission.
🎯 Profit Target – Rob & Exit
📍 Primary TP: 0.91200
🎭 Or simply: Escape before the alarm rings (i.e., close early if you see price weakness near resistance or news surprises).
🧲 Scalpers, stick to long bias only. If you're running capital deep, go in hard. If not, ride with the swing team. Use trailing SLs to protect and ride the move like a ghost.
🧠 Behind the Heist – What Fuels Our Mission?
The AUD/CAD pair is showing bullish signs backed by:
✴️ Macroeconomic indicators
✴️ Central Bank divergences
✴️ COT data (Commitment of Traders)
✴️ Intermarket correlations
✴️ Sentiment shifts & positioning strategies
Before executing any trade, read your fundamentals. Study the landscape. Then strike. 🕵️♂️
⚠️ Trading Safety Alert – Timing Is Everything
🚫 Avoid placing trades during high-impact news.
✅ Use trailing SL to lock in profits and prevent whipsaw hits.
📊 Protect your capital like it’s stolen loot – because it is!
💥Support the Crew 💥
🚀 Smash that 💗 Boost Button if you’re vibing with the plan.
Every like strengthens the Thief Trading Crew – and gets us closer to daily market domination. 🎉💪
📲 Stay locked in. Another heist is coming soon.
Till then – rob smart, trade sharp, and vanish like a legend. 🐱👤💸
🔑 #AUDCAD #ThiefTrader #ForexBreakout #LongSetup #ScalpToSwing #TradeWithPlan #DCAEntry #ForexHeist #MarketStrategy #RiskReward

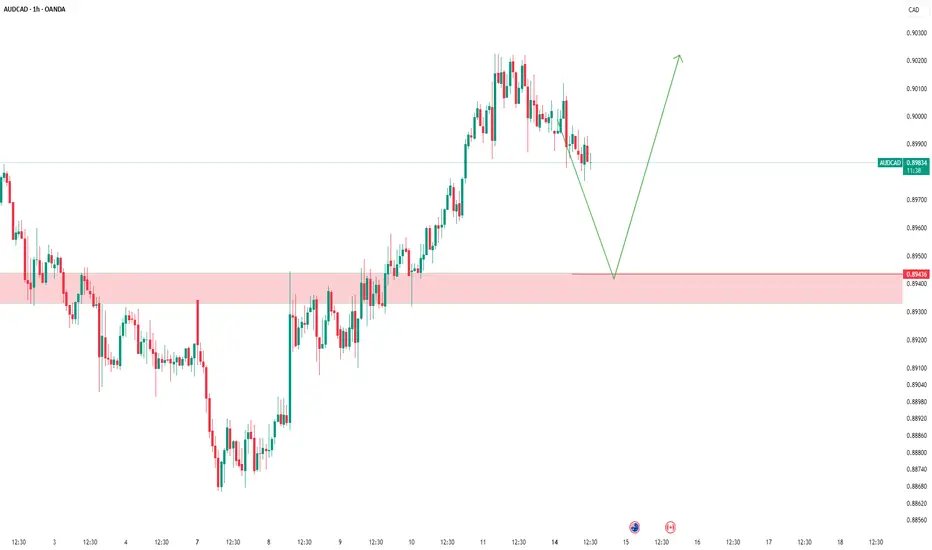
AUDCAD - Possible Buy Setup AheadThe market is approaching a significant zone.
We’re standing by — no rush, no guessing.
If a clean bullish signal appears, we go long.
If it breaks through, we wait for a pullback and adapt.
Our job isn’t prediction — it’s reaction.
Follow the plan. Let the profits take care of themselves
AUDCAD | Weekly Outlook | July 14, 2025🟦 AUDCAD | Weekly Outlook | ICT-Based Analysis
📅 Week Starting: July 14, 2025
🧠 "Don't chase — let the trade come to you."
🧭 Market Context (1H + HTF Alignment)
This chart outlines a clear Smart Money framework for AUDCAD using ICT principles. The market recently completed a manipulation phase below a major accumulation zone, forming a clear SMT divergence and respecting a CISD (Clean Internal Sell-side Displacement).
After manipulation and SMT confirmation, price respected the CISD and showed willingness to displace bullishly, suggesting a potential re-accumulation phase on the lower timeframes.
🔍 Key Observations
Accumulation + SMT:
We had a prolonged accumulation phase that led to a smart money manipulation (fakeout), marked by SMT divergence. This was followed by a bullish shift in structure, confirming intent.
CISD + CE Reaction:
Price respected the CISD zone and formed a bullish W reversal + OB/BI setup. This is a common ICT pattern before major expansions.
Re-Accumulation Area:
The current consolidation near ERL levels shows signs of controlled accumulation, with price respecting previous liquidity levels.
This area may act as a springboard for expansion towards HTF objectives.
📈 HTF Targeting: Reversal Area + EQH
The chart marks a High Time Frame Reversal Area (HTF) above the current price, potentially acting as a premium inefficiency or sell-side liquidity target.
EOH (Expansion Objective High) is drawn in that same region, providing a long-term magnet for price.
This aligns with the broader Monthly Cycle expectation.
🔄 Monthly Cycle Analysis
“Monthly Cycle is Created — Open, Low... Now We Wait for the High and Close.”
This suggests:
Monthly Open and Low are already formed.
A bullish monthly cycle is anticipated — meaning we're waiting for the High to form next.
Once the high is set, a retracement towards the Close level is expected by the end of the month.
This macro view gives us context for aiming long positions on pullbacks — buying dips within the re-accumulation range.
⚠️ Trader's Insight
Don’t Chase — Let the Trade Come to You.
The setup is not about chasing price. Instead, the idea is to:
Wait for price to return to favorable zones (e.g., CE of OB inside CISD)
Confirm intent with LTF SMT, FVGs, or M15 structural shifts
Target HTF inefficiencies and liquidity zones (EOH & Reversal Area)
🎯 Bias for the Week
Bullish, based on:
Monthly cycle direction (expecting HIGH)
Price behavior post-CISD respect
Clear smart money accumulation and displacement
Re-accumulation on LTFs suggesting continuation

AUDCAD – Bearish Rejection at Key Resistance ZoneAUDCAD is showing signs of weakness near the 0.8980 supply zone after an extended rally. The pair is now reacting to a historically respected resistance area, with bearish momentum building as exhaustion sets in.
🔍 Technical Outlook:
✅ Price rejected at multi-touch resistance around 0.8980
📐 Clean bearish structure forming after wedge-like exhaustion
📉 Expecting a move down toward:
TP1: 0.89365 – recent minor structure
TP2: 0.89080 – key demand zone from early July
TP3: 0.88654 – full measured target from range
📛 Invalidation above: 0.8985
🌍 Fundamental Breakdown:
🇦🇺 Australia:
📉 Softening inflation and retail sales
🏦 RBA cautious with limited appetite for further hikes
🇨🇳 Weak Chinese demand adds pressure on AUD
🇨🇦 Canada:
💪 Supported by rising oil prices and solid employment data
🏦 BoC remains vigilant on inflation, though on hold
🛢️ Strong WTI prices continue to support CAD
⚠️ Risks to the Bearish View:
⚡ Unexpectedly strong China data could boost AUD
📉 Sudden drop in oil prices would hurt CAD
🗣️ Surprise hawkish shift from RBA
🔗 Correlation & Flow:
AUDCAD is a lagging asset, heavily influenced by WTI crude (boosting CAD) and China-linked risk flows (affecting AUD).
Keep an eye on AUDUSD and USDCAD for early signals.
📆 Upcoming Key Events:
🇦🇺 RBA Minutes, Jobs Data, Wages Index
🇨🇦 BoC Business Outlook, CPI Print
🛢️ US Oil Inventories (affects CAD)
🧭 Summary:
🔻 Bias: Bearish
📊 Drivers: Oil strength, RBA caution, CAD resilience
⚠️ Risk: China rebound or oil correction
🕵️ Watch: Canadian CPI + Australian jobs data
📉 Likely to Follow: Oil and AUDUSD/USDCAD macro trends

AUDCAD BUYBy utilizing Fibonacci retracement levels, historical patterns, , we can formulate a hypothesis that the market might follow a similar trajectory if bullish sentiment prevails.

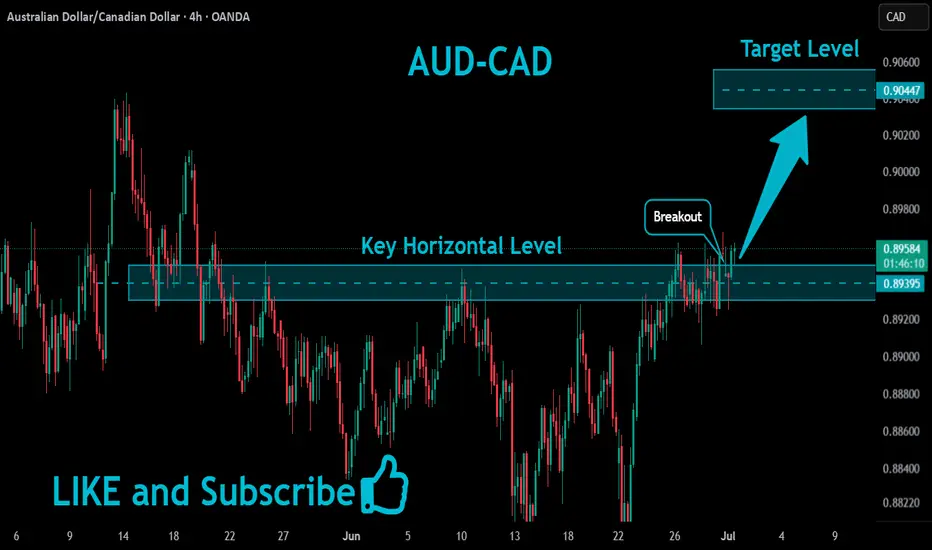
AUDCAD Strong Breakout!
HI,Traders !
#AUDCAD is trading in an
Uptrend and the pair has
Made a bullish breakout of
The key horizontal level
Of 0.89395 and the breakout
Is confirmed so we are
Bullish biased and we
Will be expecting a further
Bullish move up !
Comment and subscribe to help us grow !
AUDCAD: The Real Move Happens After the TrapNot every trade needs to be flashy.
This one was clean. Simple. Intentional.
And it came after most traders got taken out.
What I Saw :
Price swept PDL: textbook sell-side liquidity.
But instead of jumping in too early, I waited.
Why?
Because I’ve learned something:
👉 The first reaction is often just noise.
👉 The second one, the one that fills into structure. That’s where clarity lives.
My Entry Logic:
After the sweep, price broke minor structure. That was my Change of Character. I will just have to wait for price to pull into the FVG below 50% fibs retracement. Stop below the low. Target at the PDH.
Nothing fancy. Just discipline .
Psychology Check:
I’ve taken this setup before and watched it run without me. Why? Because I used to hesitate. I wanted more confirmation… or feared being wrong.
But here’s the truth:
Your edge is only real if you’re willing to take the shot when it appears .
This wasn’t a guess.
It was system + structure + emotional control.

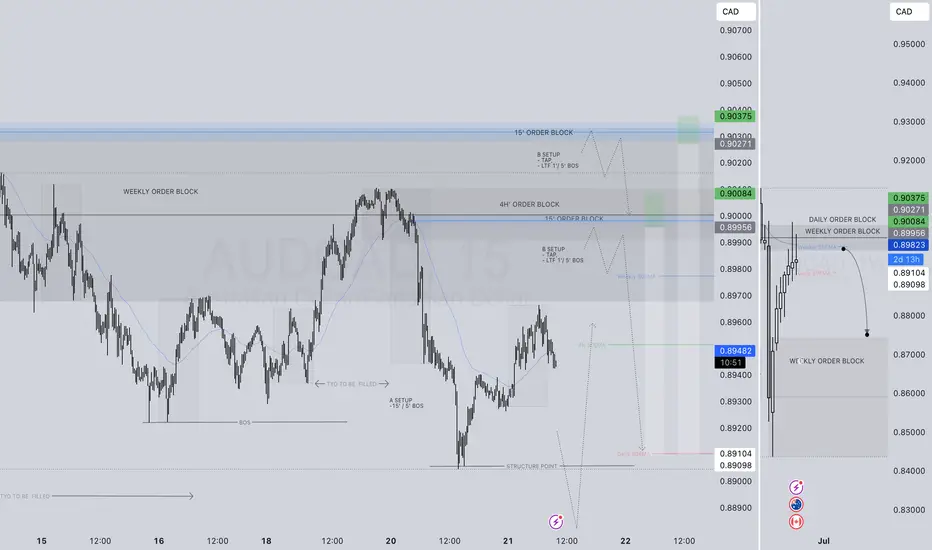
HUGE RETURNS PENDING! AUDCAD SHORT FORECAST Q2 W21 D21 Y25HUGE RETURNS PENDING!
AUDCAD SHORT FORECAST Q2 W21 D21 Y25
Professional Risk Managers👋
Welcome back to another FRGNT chart update📈
Diving into some Forex setups using predominantly higher time frame order blocks alongside confirmation breaks of structure.
Let’s see what price action is telling us today!
💡Here are some trade confluences📝
✅ Weekly order block
✅ Intraday 15 order block
✅Tokyo ranges to be filled
✅ Weekly 50 EMA
🔑 Remember, to participate in trading comes always with a degree of risk, therefore as professional risk managers it remains vital that we stick to our risk management plan as well as our trading strategies.
📈The rest, we leave to the balance of probabilities.
💡Fail to plan. Plan to fail.
🏆It has always been that simple.
❤️Good luck with your trading journey, I shall see you at the very top.
🎯Trade consistent, FRGNT X
AUDCAD Long Term buying Trading IdeaHello Traders
In This Chart AUDCAD HOURLY Forex Forecast By FOREX PLANET
today AUDCAD analysis 👆
🟢This Chart includes_ (AUDCAD market update)
🟢What is The Next Opportunity onAUDCAD Market
🟢how to Enter to the Valid Entry With Assurance Profit
This CHART is For Trader's that Want to Improve Their Technical Analysis Skills and Their Trading By Understanding How To Analyze The Market Using Multiple Timeframes and Understanding The Bigger Picture on the Charts

AUDCAD SHORT FORECAST Q2 W20 D15 Y25AUDCAD SHORT FORECAST Q2 W20 D15 Y25
Professional Risk Managers👋
Welcome back to another FRGNT chart update📈
Diving into some Forex setups using predominantly higher time frame order blocks alongside confirmation breaks of structure.
Let’s see what price action is telling us today!
💡Here are some trade confluences📝
✅ Weekly order block
✅Intraday 15 order block
✅Tokyo ranges to be filled
✅ Weekly 50 EMA
🔑 Remember, to participate in trading comes always with a degree of risk, therefore as professional risk managers it remains vital that we stick to our risk management plan as well as our trading strategies.
📈The rest, we leave to the balance of probabilities.
💡Fail to plan. Plan to fail.
🏆It has always been that simple.
❤️Good luck with your trading journey, I shall see you at the very top.
🎯Trade consistent, FRGNT X

Steal the Show: AUD/CAD Bullish Bank Run!🌍 Greetings, Wealth Warriors & Market Mavericks! 👋😎💸
Hey there, global traders! Ready to crack the vault on the AUD/CAD "Aussie-Loonie" Forex Heist? 🏦💰 Based on our slick *Thief Trading System* blending technical precision and fundamental vibes, here’s the ultimate plan to snag profits. Follow the chart’s long-entry blueprint and aim to cash out near the high-stakes Red Zone—a wild spot where overbought signals, consolidation, and bearish traps lurk. 💪🎯 Stay sharp, grab your loot, and treat yourself—you’ve earned it! 🍾🚀
🔑 Entry 1: “The vault’s open! Spot the MA breakout at 0.90500 and dive in—bullish riches are calling!”
Pro move: Set buy stop orders above the Moving Average or buy limit orders at the latest 15/30-min swing low/high for pullback action. 📊 Add a chart alert to catch the breakout wave! 🌊
🔑 Entry 2: “The heist is on! Stalk the MA pullback in the Market Maker’s Trick Zone at 0.89200, then strike—fortune loves the fearless!”
🛑 Stop Loss: “Listen up, crew! 🗣️ For buy stop orders, hold off on setting that stop loss until the breakout kicks in. 🚀 Place it at the spot I’ve marked 📍, or go rogue at your own risk—don’t blame me if the market bites! 😜 Your trade, your rules, your fire. 🔥”
📍 Thief SL set at the nearest swing low on the 4H timeframe for swing trades.
📍 Size your SL based on your risk, lot size, and number of orders.
🎯 Target: 0.91500—or make a smooth exit near the target zone. 🏴☠️
👀 Scalpers, heads up: Stick to long-side scalps. Got deep pockets? Jump in now! Otherwise, team up with swing traders for the grand heist. Use trailing SL to lock in your cash. 💰🔒
📡 Why’s AUD/CAD hot? The "Aussie-Loonie" is riding a bullish surge, fueled by key drivers. 📰 Dive into fundamentals, COT reports, sentiment analysis, intermarket trends, and future projections. Check the linkss for fundamentals, macro trends and market outlooks for the full scoop! 🔗🌐
⚠️ Trading Alert: News Flash & Position Safety 🗞️🚨
News drops can shake the market like a storm. 🌪️ To protect your trades:
- Skip new entries during news releases. 🚫
- Use trailing stop-loss orders to secure profits and shield your positions. ✅
💥 Boost Our Heist! 💪 Hit that Boost Button to supercharge our Thief Trading squad. 💸 Crush the market daily with our slick strategies. Together, we’ll stack profits with ease! 🤝❤️🎉
Catch you at the next heist, traders—stay locked in for more! 🤑🐱🚀✨

AUDCAD Bullish Momentum: Pullback Setup in Play!📈 AUD/CAD Technical Outlook 📈
I’m currently analyzing the AUD/CAD currency pair, and it's showing a strong, sustained bullish trend on the daily timeframe 🔥. We’re seeing a clean sequence of higher highs and higher lows, which keeps my bias firmly bullish ✅.
I’m waiting for a pullback into equilibrium — that’s around the 50% level of the current or previous price range 🎯. If price retraces into this zone, I’ll be looking for a high-probability entry setup on the 4H and 30-minute timeframes ⏱️.
🎯 Target: Previous daily highs, as marked in the video.
This setup aligns with classic trend continuation principles, and I’ll be watching for confirmation before executing any trade.
⚠️ Disclaimer: This is not financial advice. Always trade based on your own analysis and risk management rules. 💼📊

AUDCAD SHORT FORECAST Q2 W19 D5 Y25AUDCAD SHORT FORECAST Q2 W19 D5 Y25
Professional Risk Managers👋
Welcome back to another FRGNT chart update📈
Diving into some Forex setups using predominantly higher time frame order blocks alongside confirmation breaks of structure.
Let’s see what price action is telling us today!
💡Here are some trade confluences📝
✅ Weekly order block
✅Intraday 15 order block
✅Tokyo ranges to be filled
✅Intraday bearish breaks of structure to be confirmed
🔑 Remember, to participate in trading comes always with a degree of risk, therefore as professional risk managers it remains vital that we stick to our risk management plan as well as our trading strategies.
📈The rest, we leave to the balance of probabilities.
💡Fail to plan. Plan to fail.
🏆It has always been that simple.
❤️Good luck with your trading journey, I shall see you at the very top.
🎯Trade consistent, FRGNT X

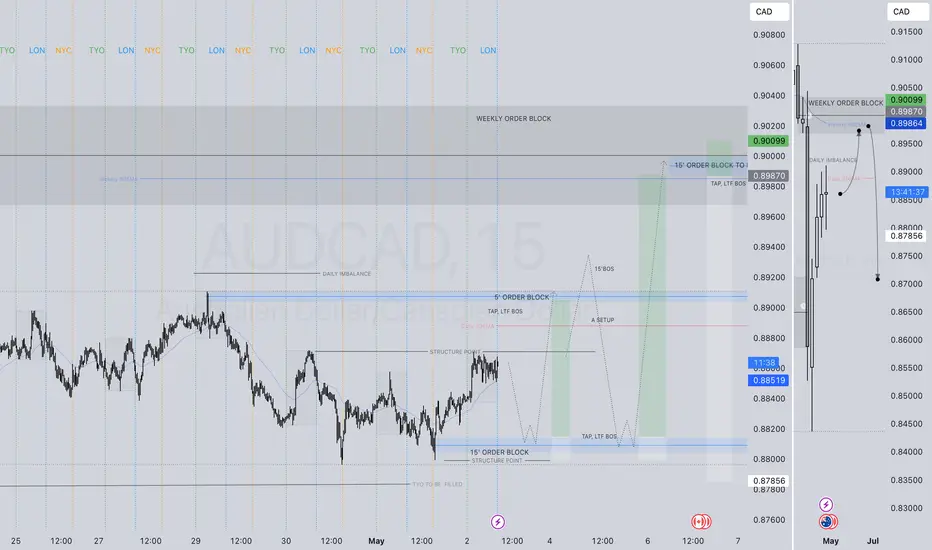
AUDCAD LONG FORECAST Q2 W18 D2 Y25AUDCAD LONG FORECAST Q2 W18 D2 Y25
Professional Risk Managers👋
Welcome back to another FRGNT chart update📈
Diving into some Forex setups using predominantly higher time frame order blocks alongside confirmation breaks of structure.
Let’s see what price action is telling us today!
💡Here are some trade confluences📝
✅Daily 50 EMA
✅Intraday 15' order block
✅Tokyo ranges to be filled
✅Intraday bullish breaks of structure to be confirmed
🔑 Remember, to participate in trading comes always with a degree of risk, therefore as professional risk managers it remains vital that we stick to our risk management plan as well as our trading strategies.
📈The rest, we leave to the balance of probabilities.
💡Fail to plan. Plan to fail.
🏆It has always been that simple.
❤️Good luck with your trading journey, I shall see you at the very top.
🎯Trade consistent, FRGNT X
#AUDCAD: Following a sell off, we might see price filling FVG. AUDCAD plummeted due to the NFP data, causing a record low price. However, it left a significant void area. The price has changed its behaviour, showing an increasing bullish presence. We only have one target where the price is likely to drop again heavily.
Good luck and trade safely. Like and comment for more!
Team Setupsfx_

AUDCAD LONG FORECAST Q2 W15 D9 Y25AUDCAD LONG FORECAST Q2 W15 D9 Y25
Welcome back traders!
Here's a setup for us to wait upon and ponder.

AUD/CAD – Potential Bullish Reversal from Key Support📊 Chart Analysis
1️⃣ Accumulation Zone : The price previously traded within a rectangular consolidation range before breaking down.
2️⃣ Bullish Reversal Pattern : A falling wedge has formed, indicating a possible breakout to the upside.
3️⃣ Key Support : The price has tested the 0.8980 - 0.8970 zone multiple times and is showing signs of rejection.
4️⃣ Potential Upside : A breakout above 0.9030 - 0.9050 could confirm further bullish momentum.
🚀 Trading Plan:
📌 Entry : On a breakout above 0.9025
🎯 Targets :
First target : 0.9100
Extended target : 0.9130
🛑 Stop Loss : Below 0.8965 to minimize risk.
🔔 Confirmation Needed: Wait for strong bullish price action before entering long trades. 🚀🔥

AUDCAD LONG Rebound AUDCAD Rebound towards the 61.8% fibbonacci level, moreover we have Bullish divergence on MACD and RSI.

AUDCAD Approaching Key Support - Rebound Towards 0.90150?OANDA:AUDCAD is approaching a significant support zone, highlighted by previous price reactions and strong buying interest. This area has previously acted as a key demand zone, increasing the likelihood of a bounce if buyers step in.
The current market structure suggests that if the price confirms support within this zone, we could see a bullish reversal. A successful rebound could push the pair toward the 0.90150 level, a logical target based on previous price behavior and current market structure.
However, if the price fails to hold this support and breaks below the zone with momentum, the bullish outlook may be invalidated, potentially opening the door for further downside continuation. Monitoring price action and volume in this area will be crucial to confirm a valid setup.
Just my take on support and resistance zones—not financial advice. Always confirm your setups and trade with solid risk management.
Best of luck!

Buy audcadAUD/CAD Reversal Trade Setup: Key Levels to Watch
Market Overview
The AUD/CAD currency pair has shown a strong historical support level around 0.89867, where price has consistently bounced in previous weeks. This suggests a potential bullish reversal in the short term.
Trade Setup
Entry: Buy at 0.90246
Stop Loss (SL): 0.89867 (below key support level)
Take Profit (TP): 0.91212 (next major resistance level)
Analysis & Rationale
Technical Support Zone: The 0.89867 area has acted as a strong demand zone, reinforcing a possible price rebound.
Risk-to-Reward Ratio: This setup offers a favorable risk-to-reward ratio, ensuring optimal risk management.
Trend Confirmation: A confirmed bounce off support will provide further confidence in the bullish momentum.
Trading Plan & Execution
Wait for a clear bullish confirmation at 0.90246 before entering.
If price action aligns with expectations, gradually add positions on pullbacks while maintaining stop-loss discipline.
Close the trade at 0.91212 or trail stop to maximize gains if momentum remains strong.
This trade idea aligns with technical analysis principles, leveraging key support and resistance levels. However, always monitor market conditions, and adjust accordingly to maximize profitability.
📌 Risk Warning: Always use proper risk management strategies, and trade according to your personal risk tolerance.

AUDCAD LONG Rebound from 1h orderblockAUDCAD Rebound from the 1h orderblock into the next 1h orderblock upside. The RSI is oversold.
