AUDUSD Daily Chart is going up!First Target 0.75570, then according to the Fib. levels above.
Moreover, in our Forex Strength Meter, it is the highest strength value too.
According to historical data, AUD will remain strongest position for 5 days or more.
Audcadlong

LONG Opportunity on AUDCADPotential LONG ENTRY on AUDCAD if price closes above 0.92691.
Target 1 @0.94421
Target 2 @0.96097
Trailing Stop of 165 pips

AUDCAD - LONGHere we have AUDCAD with a possible LONG.
There is an expanding triangle that has just hit the 5 count.
It is also at a support zone just below a long standing range.The previous buyers have just been taken out -some would call this bear trap.
If you're not already in we should be looking for the LONG to get back into the range and looking to test the $1 mark.

AUDCAD MAY GO LONG ACCORDIN TO MY TECHNICALS (24/10/2021)Disclaimer:- Educational Analysis says AUDCAD may go LONG according to my technicals.
This is not an entry signal. I have no concern with your profit and loss from this analysis.
Why short?
On 15 min timeframe pair is making lower high and higher high which make break of previous structure.
I HAVE NO CONCERNS WITH YOUR PROFIT OR LOSS.
ADDITIONAL CONFIRMATION IS THEIR ARE TWO DOUBLE BOTTOM WHICH HAVE APPEARED AT SUPPORT ZONES
ENTRY 0.92312
STOP-LOSS 0.92196 (11.8 PIPS)
TAKE PROFIT 0.93004 (69 PIPS)
RISK TO REWARD RATIO IS 1:5.85

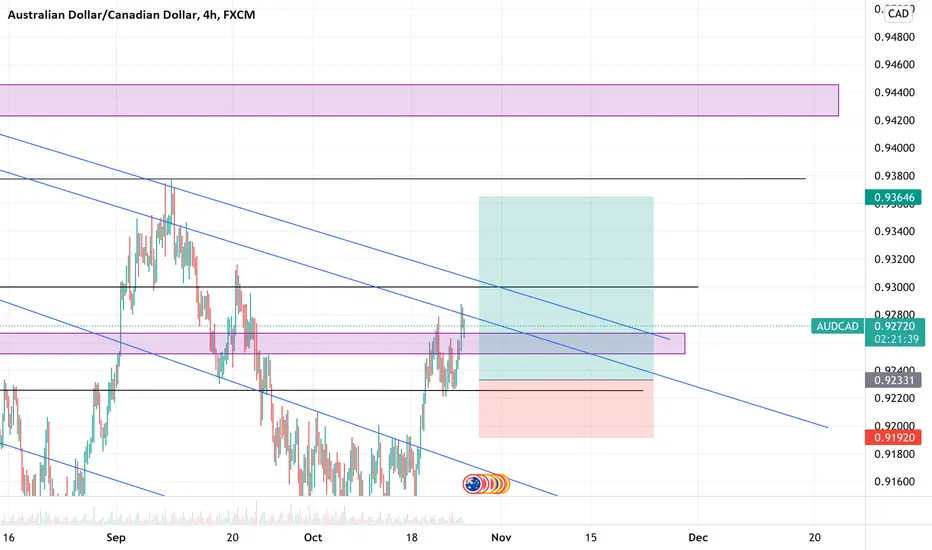
AUD/CADBuy: AUD / CAD
Buy limit: 0.92330
SL @ 0.91920
TP @ 0.93640
Max Risk: 2%
(When calculating, do not forget about different spreads from Brokers)
Leave comments or likes to keep our content free and alive.
Have a good week to everyone
AUDCAD It will rise upward Welcome back!
Please support this idea with a LIKE and COMMENT if you find it useful.
*****
Buyers have taken charge and managed to push price beyond rejective resistance 9200 zone. After a strong bullish impulse, we now have price rejecting off the 50% fib with a bullish flag formation. All signs point upward for another bullish wave/continuation. Where do you think AUDCAD is headed? Let us know your thoughts in the comments!
Be sure to follow the entry criteria rules for your strategy and keep this on your watch list!
- BKH

AUDCAD buyPrice is currently in a bullish run with current retracement and rejections of the previous 4hr support, a long position can be taken to target new highs

AUDCAD#AUDCAD As you can see the Bullish trend, Buy AUD. I already mention stop loss and take profit ratio in my chart. I believe this pair is going to shoot up. Might take some time but will get there.If you like my idea kindly follow me further updates. Thanks

AUDCAD - Fri Oct 22The price broke the descending channel to the upside. the AUDCAD is Bullish in a medium-term trend. so I expect AUD will be going up and the first target will be 0.92700.

Waiting for a buying opportunity with AUDCADH4 time frame.
Structure: Uptrend.
AUDCAD broke the 0.92000 resistance.
Wait for the price to return to the 0.92000 retest area and appear a bullish pattern that can find buying opportunities.
Profit target is 0.93000 zone.
-----------------------------------------------------------------------------------------------
Wish you all have a good trading day!

AUDCAD TradeIf you are looking to scale in or open a position, I see a potential Head & Shoulders forming on the M30, signaling a potential end of the retracement.
*Disclaimer*
This is not financial advice. Forex is a risky business. Trade at your own risk.
#TradeLikeMagnatrio

AUD/CAD:DOWNTREND|FLAT MARKET| SHORT SETUP 🔔The Bank of Canada is holding its monetary policy meeting next week, and inflation indicators support the hawkish attitude of the central bank. Recall that markets are now pricing in a rate hike in April.
Welcome back Traders, Investors, and Community!
Check the Links on BIO and If you LIKE this analysis, Please support our Idea by hitting the LIKE 👍 button
Traders, if you like this idea or have your own opinion about it, please write your own in the comment box . We will be glad for this.
Feel free to request any pair/instrument analysis or ask any questions in the comment section below.
Have a Good Day Trading !

LONG POSITIONAS the Canadian dollar was strengthening against the US Dollar, it was falling vs its commodity siblings
Aussie and kiwi. AUD/CAD Formed a low on October 11th near %(0.9105 testing the same lows from august 24th.
If price breaks above the September8th highs of $(0.9375), it will confirm a double bottom and target near $(0.9670)
Potential Long on AUDCAD

AUDCAD LONGEntry price: $0.9371
Take profit:$0.9650
Stop loss: $0.9109
Observing the movement price on the chart, we can point out that there was a really downtrend and then, during the last few month, a new lateral range (range without any strong trend) is made up on the chart.
Looking at the price inside the range, we can find some information that suggests us that price could get out from lateral range soon.
First of all MACD line crossed above the signal line, indicating a buy signal. Regarding Bollinger bands, price has also crossed above the simple moving average (middle band), indicating a rise in the price, Moreover when the bands come close together, constricting the moving average, it is called squeeze. A squeeze signals a period of low volatility and it could be considered a potential sign of future increased volatility and possible trade opportunity. We also notice a double bottom inside the range so we should wait for the price break out the neckline, confirming our idea about uptrend.
no financial advice

AUDCAD longAfter a strong consolidation, we can now see that the price managed to break out of the consolidation structure with great bullish momentum! I'll be looking for a long entry on a retest.
NICE TRADING!!!

AUDCAD POTENTIAL BUY I like the reaction that i see and the formation that its building. If tomorrow london session its holding the area then look price action for buy . Stoploss below the impulse. Also macd showing one more move to the upside.
Be careful to see strong break on the impulse on the left. Lets see!

AUDCAD LONGAUDCAD bounced from a major support Level on the Daily time frame, also broke the upper trendline of a descending channel on the H4.
We taking this trade based on technical analysis and price action.
(1) DO NOT ENTER ANY TRADE BEFORE THE ENTRY LEVEL
(2) USE YOUR STOP LOSS
(3) DO NOT HOLD A LOSS FOR MORE THAN 2 DAYS
Please use proper risk management depending on your account size, Use lot sizes based on these calculations.
Here is a break down of your pip value in ZAR and Dollars
0, 01 = R1,43 / $0,10c
0. 05 = R 7,15 / $ 0.50
0.10 = R 14,3 / $1.00
1 Lot size = R 146,26
How to calculate Margin = (Lot Size * Contract Size)/Leverage, Lets say your broker gives you 1:500, and you open 0,2 size, How much are you exposing ? calculations : (0.2 * 10 000) / 500 = $4 (R58) also (1 Lot * 100 000) / 500 = $200 (R2 960)
So, each time I open (1 Lot size, am exposing R2960 (Down payment)
Remember, These are long term trades, It is advisable to have enough margin to handle the fluctuation of the markets.
Please like and share for more useful content:

AUDCADBullish Indicators:
Support zone at 0.90940
Bearish Indicators:
Resistance zone at 0.92023 Fib level 38.20%
Plan A: One can take long position on the breaking of resistance zone at 0.92023 for the target of 0.92689 and 0.93163.
Plan B: On the breaking of support zone at 0.90940 one can take short position for the target of 0.90658.

AUDCAD possible longWaiting for the breakout and go long...
It seems AUDCAD has a PFL and creates a formation for long. Wait for the breakout and retest for the confusion. Good luck.

AUDCAD.. Ready to pop up 136 pips..AS you can see the Bullish Pattern was left empty.. Price has bottomed and is ready to pop back up and fulfill the pattern. Gives us 136 pips potential. OANDA:AUDCAD

AUDCAD LONG + Future PredicationAUDCAD LONG + Future Predication
Macd divergence
Elliotwaveanlaysics
harmonicpattern
supplyanddemandanalysics
orderblock
orderblock+imbalance

AUDCAD AccumulationThere is a chance for Audcad for big long...
As it's looking like Wyckoff accumulation 1...

Tue 12th Oct 2021 AUD/CAD Daily Forex Chart Buy SetupHere is a higher risk buy trade setup on the Daily AUD/CAD Forex chart. You can see my notes on the chart, including why I would be leaving the previous partial sell trade on. Always a risk when trading against the trend, but as we all know, all trends come to an end eventually. Just be careful with this one though. Cheers.
