Audcadlong

AUD/CAD Wave Analysis The counter has made a strong move from the low of 0.80 handle to 0.93 handle in just 3 months.
The move could be attributed to a 5-wave pattern and it is now in corrective mode.
It has completed waves A and B is going to kickstart wave C.
The resistance zone around 0.93 handle proves to be a tough nut for the pair despite trying to take it down thrice.
It makes a price action imminent and hence, we expect the pair to be bearish in the short-term.

audcadaudcad is in a bullish flag pattern, fluctuating inside a parallel channel, wait for breakout/retest.

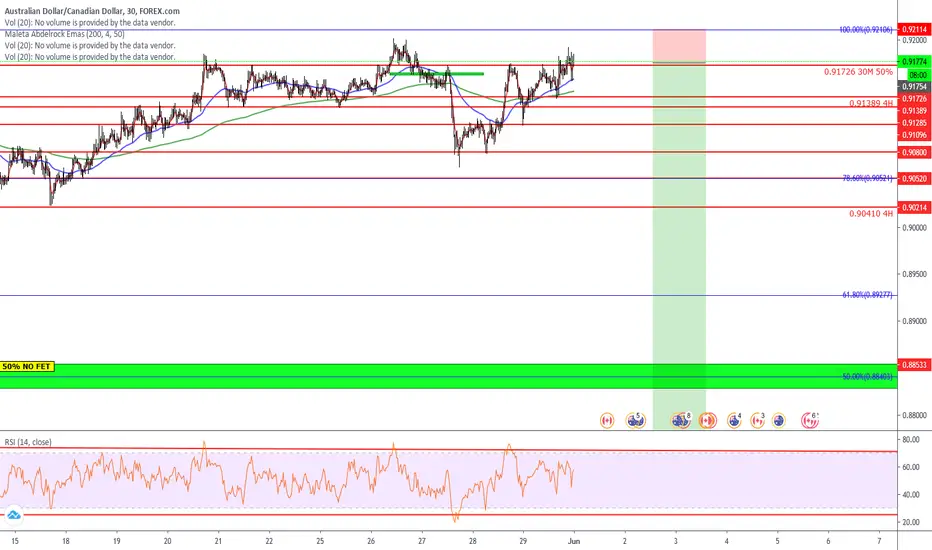
AUD/CAD - Bearish Volume Incoming!Hello Traders!,
We're nearing the end of this trading week, with lots of great opportunities, I hope we've all been able to capitalise of this lucrative trading week. Here we can see an influx of bearish volume on its way for AUD/CAD pair, taking advantage to see if we can make some shorts.
What Is The Market Telling Us?
Resistance zone of around @0.94000 has been holding for over 3 weeks, with showing multiple strong rejections
We can clearly see the market has been ranging between our support and resistance levels for some time, further consolidation is expected
Bullish volume has been decreasing ever since price has reached our resistance, giving us more confluence of a drop off in price to come soon
When Should We Enter?
Since we're looking for SHORTS on this pair, we can enter the market as soon as a we get bearish confirmation at the resistance
Look for certain bearish candlestick/chart patterns, these patterns will be validated as they will occur at our resistance zone

AUDCAD a la alzaEl precio parece estar en una tendencia alcista, respetando la Ema 89 como piso y tambien la linea marcada. espero que el precio subas hasta la zona del 0.94048

AUDCAD - SWING - 22. JUNE. 2020Welcome to our weekly trade setup ( AUDCAD )!
-
1 HOUR
Very bullish price action.
4 HOUR
Prices closed above main sr level and are trading above it.
DAILY
Expecting some pressure shortly and a lift off.
-
FOREX SWING
BUY AUDCAD
ENTRY LEVEL @ 0.93310
SL @ 0.92790
TP @ 0.94090
Max Risk. 0.5% - 1%!
(Remember to add a few pips to all levels - different Brokers!)
Leave us a comment or like to keep our content for free and alive.
Have a great week everyone!
ALAN

AUDCAD - SELLWe are anticipating another sell from an AUD pair.. once price has broken this level we can sell all the way to the green area
Price has tested this level a few times and been rejected but i believe next week we will see a break and we can start a sell
AUDCAD - SELL
SL - 0.93810
TP - 0.91564

AUDCAD 6/16/2020Hello and welcome to this analysis on AUD against CAD.
AUDCAD looks like is ready to continue its uptrend.
Looking at the chart it seems like it has made a Bull Flag continuation pattern which just got activated by a break and close above the diagonal resistant of a pattern.
The next level of resistance is the red box at 0.96 ish which can be a good target. Price can get to that level as long as it stays above 0.933.
The momentum indicators also look fresh and good for the continuation of the trend. There is not any sign of weakness in the trend yet.
This trade Idea has 3 rewards to risk ratio.
Good luck trading.


AUDCAD - SWING - 15. JUNE. 2020Welcome to our weekly trade setup ( AUDCAD )!
-
1 HOUR
Bullish price action this week.
4 HOUR
Close above main sr level, expecting a rise in price action shortly.
DAILY
Overall good long entries, nice pa!
-
FOREX SWING
BUY AUDCAD
ENTRY LEVEL @ 0.93360
SL @ 0.92930
TP @ 0.93950
Max Risk. 0.5% - 1%!
(Remember to add a few pips to all levels - different Brokers!)
Leave us a comment or like to keep our content for free and alive.
Have a great week everyone!
ALAN


Price playing with a rangePrice has just come off support around the 0.9300 big figure. In the last few days the market has established a trading range between 0.9300 and 0.9450.
Price rotating lower in early Asia trading and if the recent low holds (June 9th) then there is potential to see price trading higher to test the range highs around 0.9400-50


Strong Buy For AUD/CADAUD/CAD is now on a strong support, MACD and Signal lines touched each other, So AUD/CAD will rise / 30M Time Frame / MACD, MA, SUPPORT

AUD/CAD Technical Analysis
The counter is brimming with bullishness.
It is currently moving like a parabolic wave and is at its second leg.
Now it is in a short-term correction in the form of falling wedge pattern.
We advise traders to go long on the bullish breakout of falling wedge pattern and hold the position till the bullish trendline holds.

AUDCAD bounced off ascending support line | 2 June 2020Price is facing bullish pressure from our ascending support line in line with our 38.2% fibonacci retracement , horizontal pullback support and 100% fibonacci extension where we remain bullish above this level and could see a further bounce to our take profit levels. We have also attached the written version of the analysis so do check that out below and let us know what you would like to see next!

AUDCAD H4 LONG PRICE ACTION FORECASTWith price action trading within an uprising channel, a buy-limit order above the bullish pin bar, this pin bar candle happened right above the EMA as dynamic price support and strong seller rejection.
The uptrend continuation is also spotted by MACD, showing some bullish momentum to support the trend.
S/L: 38 pip & R:R | 1:2

AUDCAD-- sell market going sell strongly Hy! Smart Trader, Welcome to My Analysis and forecasting Section on Trading view.
We are Creative price action Trader. Join with us as we document the in's and out's of my trading journey. we are publish Multiple Time frame Analysis and forecasting (totally Free)
Never Trade alone
we really hope you enjoy All trade..
Disclaimer:
the content on this analysis is subject to change at any time without notice, and is provided for the sole purpose of assisting traders to make independent investment decisions.
_______________________________________________________________________________________________
Thank you for your support!

Breakout of TrendAs much as this seems like a breakout from a ket market trend structure. This could be a Fake Out to induce buyers. Be Warned.

AUDCAD Long! Price-Action Narrative on DailyNote: Idea is to complement your research.
Idea also complements previously shared idea/s.
Check comments section for future updates on idea.
Like this idea?
Like, Share, Follow, (...)
Thank you and Happy Trading.

Possible BUY on AUDCADNow you know how I feel about CAD pairs (they can be so volatile and create meaningless and annoyingly long wicks) so I would tread softly while trading this pair. Meaning, trade small with so you can be a little more liberal with your stop-loss. But this could be my coveted DIAMOND setup!
Here's why I'm interested in this trade...
possible counter-trend breakout if the bulls push the price over where I drew my trend line
price is trading above a pretty resilient 200-EMA
the MFI shows the price as being oversold in this trading period
the MFI also shows bullish-divergence in contrast with the lower-highs created by the charts price action.
the MFI is rising meaning the demand is rising. And price follows demand.
Be safe and do your own DD. I Will watch this... but I will NOT make a move until price shows strong bullish action.
