AUDCAD sell!! Going down.great ideaHello Traders, here is the full analysis for this pair
Watch strong price action at the current levels fors SELL. GOOD LUCK! Great SELL opportunity in AUDCAD ..
I still did my best and this is the most likely count for me at the moment
Audcadsell

AUDCAD / ShortI believe this is still valid, we are having a small retest of resistance before it falls


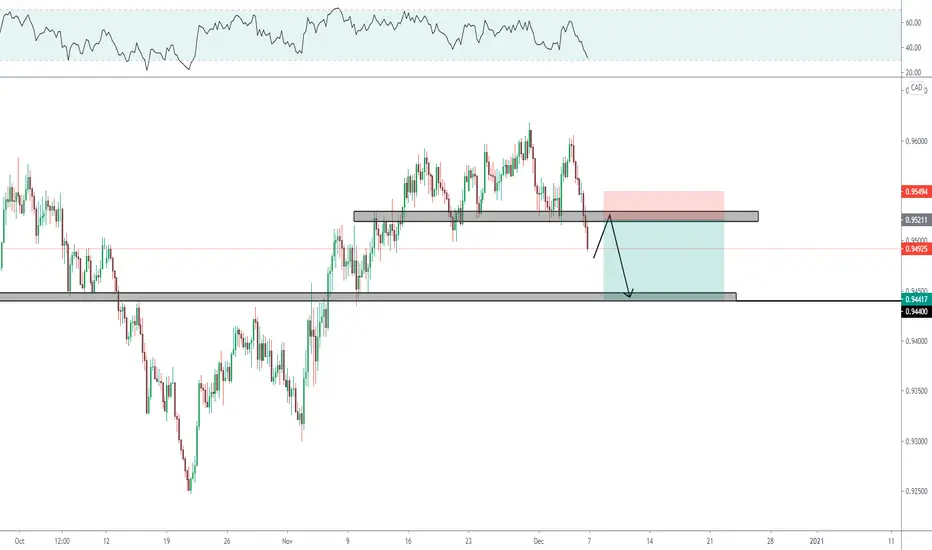
AudCad can drop 200 pipsDecember was a strong month for Aud also against its Canadian counterpart and AudCad reached a top above 0.98
Now the pair broke under trend line support and confirmed this break. Yesterday we also have a lower high and I expect a correction from this pair once 0.98 support is broken.
Sell rallies can be a good strategy

Audcad ready to pullback Possible Retest the levelwe expecting now time to pullback in the small time frame.

AUDCAD - SWING - 11. JANU. 2021Welcome to our weekly trade setup ( AUDCAD )!
-
1 HOUR
Sideways market structure.
4 HOUR
Expecting a break towards previous week lows and support zone.
DAILY
Overall bullish market about to turn..
-
FOREX SWING
SELL AUDCAD
ENTRY LEVEL @ 0.98510
SL @ 0.98950
TP @ 0.97880
Max Risk: 0.5% - 1%!
(Remember to add a few pips to all levels - different Brokers!)
Leave us a comment or like to keep our content for free and alive.
Have a great week everyone!
ALAN


AudCad- drop of 250+ pips to follow?For the past 6 months or so, AudCad traded in a range between 0.97 and 0.93 (more or less). Now the pair just made the first leg down from the top of the range and I expect this drop to continue.
Sell rallies is my strategy and 0.9520-0.9550 should provide a good sell zone.
My outlook is bearish as long as the pair is under 0.9650 on a daily close bases

AUDCAD This is AUDCAD 4H timeframe analysis, i'm expecting the market to go to the downside for an retracement before it'll start the move to the upside.


AUDCAD [H4] Breaked ???? Wait to signal 🔥🔥🔥AUDCAD Breaked ???? Wait to signal 🔥🔥🔥
Now AUDCAD IS Beaked wait fot rebound hitting on resistance and Entry " Sell " On right that
❌ If Break No trade ❌
✅Resistance ▶ 0.952XXX
🔥Target ▶ 0.944XX
Goodluck
💰Ton Trader💰
Follow on my profile social
🙏🙏🙏🙏🙏🙏
AUDCAD, 4hr tf, head and shoulders reversal to materializeHello my friends,
Another setup for next week is AUDCAD pairs.
As you can see, price finally make a lower high lower low after moving higher for 1 month.
This mean we could see some retracement on this pair.
It is also supported by the chart because there is a head and shoulders pattern forming.
Price already broken below the neckline.
We're now waiting for price to retrace first before entering sell.
Selling it right away won't yield a good trade setup.
We will wait for AUDCAD to retrace around 0.9560 and start selling from there because it will yield 3R trade setup.
Set a sell limit pending order at 0.9560, if price never comeback to touch our order then we will skip this trade.
Sell limit AUDCAD 0.9560
Stop loss 0.9615
Take profit 0.9390 (3.1R)
RR ratio 1 : 3.1
Use only 1-2% risk
Good luck

AUDCAD - Its like Christmas, here's another! 🎅🎄AUDCAD has been a little choppy for us.
3/4 losers on the bounce.
But that's OK, because we understand probability and can see the win rate and trade history.
We also know when we get a winner this will cover them - because we ride that trend.
Could this be the one?
Our algo thinks so, it's identified a sell position with all of the confluences now met.
This is easy right?
No lines, no S&R - no analysis, all I have to do is follow it.
The major plus point is I can see it works with all the data within the strategy tester.
This helps me and our traders have confidence and belief in our execution.
When do we close this?
We close on a reverse signal - but you can do as you wish.
I don't recommend jumping on random trades you see on TV - that's no plan and you won't have a consistent clear edge.
BUT, if you want to - knock yourself out.
We have data on this pair on 229 trades
Since 2018, 40% have won - which isn't too bad - along with average win and average loss we have in play.
Starting with £500 since 2018 trading this just one would have yielded returns of 100% - now I know the past doesn't predict the future - but its a start.
And the data is live! The open sell position is showing in open P/L.
Multiple targets are on the chart too and they're based on ATR.
The entry price, SL and multiple TPs are shown on the chart.
_____________________________________________________________________________________________________________________________________________
What is our strategy?
Our strategy is a trend following strategy, can be used on any instrument and time frame. However, we have hard coded specific parameters for when trading the H1 time frame, so we can back up over 4200 previous trades to confirm our edge from previous data. This gives us confidence in execution and belief in our trading strategy for the long term.
The strategy simply sits in your trading view, so you will see exactly what we see - the trade, entry price, SL and multiple TPs (although we hold until opposite trade as this is the most profitable longer term plan), lot size, etc.
This could be on your phone trading view app, or laptop of course.
The hard work is done, so we have zero chart work time, no analysis, no time front of the chart doing technical analysis - technical analysis is very subjective - you may see different things at different times - how do you have a rigid trading plan on a H&S shoulder pattern? Your daily routine, diet, sleep, exercise can affect what you 'see' and your decision making, this doesn't happen when a strategy is coded like this; what we do have is a mechanical trading strategy...
What does this mean?
It means, we are very clear on our entry and our exit and use strict risk management (this is built in - put in your account size, set your risk in % or fixed amount and it will tell you what lot size to trade!) so we have no ego with our position and we are comfortable with all outcomes - its simply just another trade. This free's our mindset from worry and anxiety as we take confidence from knowing our edge is there and also that we have used sensible risk management.
The strategy itself can be used as a live trading journal too - how cool is that? The strategy will confirm and support every open and closed position - so its quite easy to follow.
We just have to do what Percy does.
Intrigued?
I bet, have a look at the related ideas or drop me a DM for more info.


AUDCAD W1 DEC 2020AUDCAD
Short Setup
Harmonic pattern with a target of 50.0%-61.8% of the previous structure


AUDCAD short opportunity We can see a W formation on the weekly chart and we can expect the market to go and test the neckline of W formation.
AUDCAD is very bullish right now. So, we want to see AUDCAD reverse and make a retracement before continuing further.
But, from the daily chart, we can see AUDCAD breaking the 0.95750 resistance level and making a higher high. So, not a good time to take a short. If we are to take a short we have to see the market shift first from bullish to bearish in the daily chart.

AUDCAD DOWNAUDCAD
The price is right now on a previous zone that has been used a selling zone, therefore I believe the price will make the same movement on the downside and reach the purple zone near 0.95058.
.
.
.
.
El precio en este momento esta en una zona que ha sido usada previamente como una zona de ventas, es por esto que considero que el precio repetirá el mismo patron a la baja y lograra llegar a la siguiente zona morada por el nivel 0.95058.

AUDCAD W4 NOV 2020AUDCAD
Short Setup
Harmonic pattern. Target only aim for 50.00% fibonacci retracement.
