AUDCAD Forex Heist Plan: Entry, SL & TP by Thief Trader Style🏴☠️🔥 AUD/CAD Bank Heist Plan – Thief Trader's Long Con in Motion! 🔥🏴☠️
Breakout Bulls vs Bearish Guards – Who Wins the Forex Vault This Time?
🌍 Hello Money Makers, Market Bandits, and Strategic Robbers! 💰🚀💣
It’s Thief Trader back again, dropping heat with another high-stakes Forex bank job – this time we're targeting the AUD/CAD vault. This is not your grandma’s trading plan. We’re executing a well-calculated heist based on a fusion of technical breakouts + fundamental drivers with a dose of pure trading psychology warfare. 🎯
💼 The Heist Blueprint: Long Entry Game Plan
🧠 Our job is to move in silence until the breakout alarms go off.
We target 0.90200 as the clean breakout trigger over the Moving Average. This zone marks the guard shift — bulls take over if we break through.
📌 Entry Types (Choose your weapon):
🔹 Buy Stop: Above 0.90200 (Post-MA breakout confirmation).
🔹 Buy Limit (DCA Style): Set limit buys at recent lows (M15/M30 swing low) for pullback entries. Layer your entries like a true strategist.
🔔 Set Alerts: Don't sleep on this. Place alerts at breakout zones – let the chart notify you when the bank door opens. 📡
🛑 Risk Management – The Escape Plan
We don't jump in blind. Place your Stop Loss ONLY AFTER the breakout confirms.
📍Suggested SL: 0.89600, near recent 4H wick low.
🔥 Reminder: Your stop depends on your lot size, risk tolerance, and how many entries you're stacking. Don't set it too tight – we don't want early alarms killing the mission.
🎯 Profit Target – Rob & Exit
📍 Primary TP: 0.91200
🎭 Or simply: Escape before the alarm rings (i.e., close early if you see price weakness near resistance or news surprises).
🧲 Scalpers, stick to long bias only. If you're running capital deep, go in hard. If not, ride with the swing team. Use trailing SLs to protect and ride the move like a ghost.
🧠 Behind the Heist – What Fuels Our Mission?
The AUD/CAD pair is showing bullish signs backed by:
✴️ Macroeconomic indicators
✴️ Central Bank divergences
✴️ COT data (Commitment of Traders)
✴️ Intermarket correlations
✴️ Sentiment shifts & positioning strategies
Before executing any trade, read your fundamentals. Study the landscape. Then strike. 🕵️♂️
⚠️ Trading Safety Alert – Timing Is Everything
🚫 Avoid placing trades during high-impact news.
✅ Use trailing SL to lock in profits and prevent whipsaw hits.
📊 Protect your capital like it’s stolen loot – because it is!
💥Support the Crew 💥
🚀 Smash that 💗 Boost Button if you’re vibing with the plan.
Every like strengthens the Thief Trading Crew – and gets us closer to daily market domination. 🎉💪
📲 Stay locked in. Another heist is coming soon.
Till then – rob smart, trade sharp, and vanish like a legend. 🐱👤💸
🔑 #AUDCAD #ThiefTrader #ForexBreakout #LongSetup #ScalpToSwing #TradeWithPlan #DCAEntry #ForexHeist #MarketStrategy #RiskReward
Audcadsignals

HUGE RETURNS PENDING! AUDCAD SHORT FORECAST Q2 W21 D21 Y25HUGE RETURNS PENDING!
AUDCAD SHORT FORECAST Q2 W21 D21 Y25
Professional Risk Managers👋
Welcome back to another FRGNT chart update📈
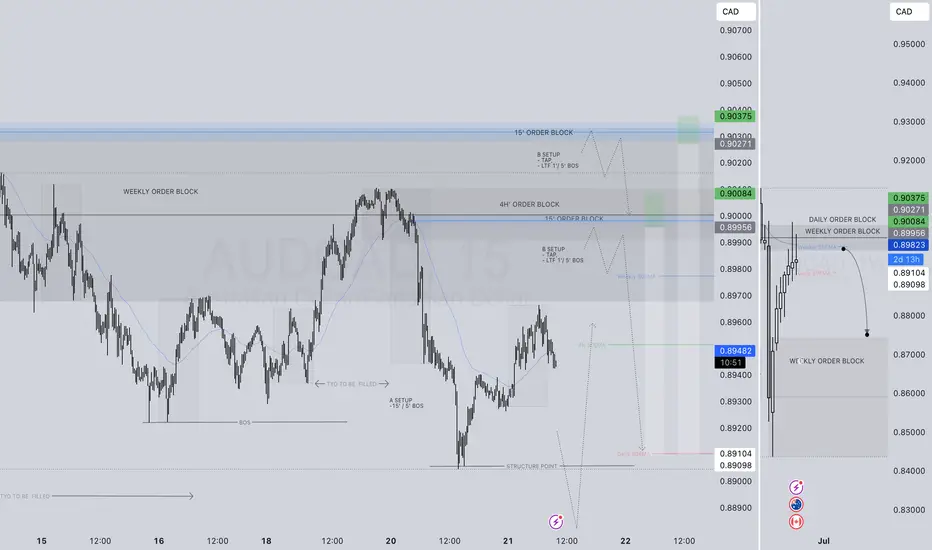
Diving into some Forex setups using predominantly higher time frame order blocks alongside confirmation breaks of structure.
Let’s see what price action is telling us today!
💡Here are some trade confluences📝
✅ Weekly order block
✅ Intraday 15 order block
✅Tokyo ranges to be filled
✅ Weekly 50 EMA
🔑 Remember, to participate in trading comes always with a degree of risk, therefore as professional risk managers it remains vital that we stick to our risk management plan as well as our trading strategies.
📈The rest, we leave to the balance of probabilities.
💡Fail to plan. Plan to fail.
🏆It has always been that simple.
❤️Good luck with your trading journey, I shall see you at the very top.
🎯Trade consistent, FRGNT X
Steal the Show: AUD/CAD Bullish Bank Run!🌍 Greetings, Wealth Warriors & Market Mavericks! 👋😎💸
Hey there, global traders! Ready to crack the vault on the AUD/CAD "Aussie-Loonie" Forex Heist? 🏦💰 Based on our slick *Thief Trading System* blending technical precision and fundamental vibes, here’s the ultimate plan to snag profits. Follow the chart’s long-entry blueprint and aim to cash out near the high-stakes Red Zone—a wild spot where overbought signals, consolidation, and bearish traps lurk. 💪🎯 Stay sharp, grab your loot, and treat yourself—you’ve earned it! 🍾🚀
🔑 Entry 1: “The vault’s open! Spot the MA breakout at 0.90500 and dive in—bullish riches are calling!”
Pro move: Set buy stop orders above the Moving Average or buy limit orders at the latest 15/30-min swing low/high for pullback action. 📊 Add a chart alert to catch the breakout wave! 🌊
🔑 Entry 2: “The heist is on! Stalk the MA pullback in the Market Maker’s Trick Zone at 0.89200, then strike—fortune loves the fearless!”
🛑 Stop Loss: “Listen up, crew! 🗣️ For buy stop orders, hold off on setting that stop loss until the breakout kicks in. 🚀 Place it at the spot I’ve marked 📍, or go rogue at your own risk—don’t blame me if the market bites! 😜 Your trade, your rules, your fire. 🔥”
📍 Thief SL set at the nearest swing low on the 4H timeframe for swing trades.
📍 Size your SL based on your risk, lot size, and number of orders.
🎯 Target: 0.91500—or make a smooth exit near the target zone. 🏴☠️
👀 Scalpers, heads up: Stick to long-side scalps. Got deep pockets? Jump in now! Otherwise, team up with swing traders for the grand heist. Use trailing SL to lock in your cash. 💰🔒
📡 Why’s AUD/CAD hot? The "Aussie-Loonie" is riding a bullish surge, fueled by key drivers. 📰 Dive into fundamentals, COT reports, sentiment analysis, intermarket trends, and future projections. Check the linkss for fundamentals, macro trends and market outlooks for the full scoop! 🔗🌐
⚠️ Trading Alert: News Flash & Position Safety 🗞️🚨
News drops can shake the market like a storm. 🌪️ To protect your trades:
- Skip new entries during news releases. 🚫
- Use trailing stop-loss orders to secure profits and shield your positions. ✅
💥 Boost Our Heist! 💪 Hit that Boost Button to supercharge our Thief Trading squad. 💸 Crush the market daily with our slick strategies. Together, we’ll stack profits with ease! 🤝❤️🎉
Catch you at the next heist, traders—stay locked in for more! 🤑🐱🚀✨

AUDCAD Excellent Channel Down bottom opportunity.The AUDCAD pair has been trading within a long-term Channel Down since the January 26 2023 High and the recent Trade War fueled sell-off took the price almost on its bottom (Lower Lows trend-line).
The 1D RSI got vastly oversold at 14.00 and a bottom is to be expected within the next 2 weeks. Still, this level is low enough to be considered a solid long-term buy opportunity already. The previous bottom rebound targeted initially the 0.5 Fibonacci retracement level, so our target is 0.88850 on the medium-term.
-------------------------------------------------------------------------------
** Please LIKE 👍, FOLLOW ✅, SHARE 🙌 and COMMENT ✍ if you enjoy this idea! Also share your ideas and charts in the comments section below! This is best way to keep it relevant, support us, keep the content here free and allow the idea to reach as many people as possible. **
-------------------------------------------------------------------------------
Disclosure: I am part of Trade Nation's Influencer program and receive a monthly fee for using their TradingView charts in my analysis.
💸💸💸💸💸💸
👇 👇 👇 👇 👇 👇

AUD/CAD "Aussie vs Canadian" Forex Market Bullish Heist Plan🌟Hi! Hola! Ola! Bonjour! Hallo!🌟
Dear Money Makers & Robbers, 🤑 💰
Based on 🔥Thief Trading style technical and fundamental analysis🔥, here is our master plan to heist the AUD/CAD "Aussie vs Canadian" Forex market. Please adhere to the strategy I've outlined in the chart, which emphasizes long entry. Our aim is the high-risk Red Zone. Risky level, overbought market, consolidation, trend reversal, trap at the level where traders and bearish robbers are stronger. 👀 Be wealthy and safe trade.💪🏆🎉
Entry 📈 : You can enter a Bull trade at any point,
however I advise placing Buy limit orders within a 15 or 30 minute timeframe. Entry from the most recent or closest low or high level should be in retest.
Stop Loss 🛑: Using the 4H period, the recent / nearest low or high level.
Goal 🎯: 0.90400
Scalpers, take note : only scalp on the Long side. If you have a lot of money, you can go straight away; if not, you can join swing traders and carry out the robbery plan. Use trailing SL to safeguard your money 💰.
Warning⚠️ : Our heist strategy is incompatible with Fundamental Analysis news 📰 🗞️. We'll wreck our plan by smashing the Stop Loss 🚫🚏. Avoid entering the market right after the news release.
Fundamental Outlook 📰🗞️
Based on the fundamental analysis, I would conclude that the AUD/CAD (Australian Dollar/Canadian Dollar) pair is: Bullish
Reasons:
Interest rate differential: The Reserve Bank of Australia's (RBA) interest rate (2.85%) is higher than the Bank of Canada's (BoC) interest rate (2.50%), making the AUD more attractive to investors.
Commodity prices: Australia is a major exporter of commodities such as iron ore, coal, and gold, which are in high demand due to the ongoing global economic growth. This is expected to support the AUD.
Economic growth: Australia's economy is expected to grow at a faster pace than Canada's, driven by the strong labor market and increasing business investment.
Trade balance: Australia's trade balance is expected to remain in surplus, driven by the strong demand for its commodities, which is expected to support the AUD.
However, it's essential to consider the following risks:
Global economic slowdown: A slowdown in global economic growth could reduce demand for commodities and negatively impact the AUD.
Canadian economic growth: Canada's economy is expected to grow at a slower pace than Australia's, but it is still expected to be driven by the strong labor market and increasing business investment.
Oil prices: Canada is a major oil exporter, and a decline in oil prices could negatively impact the CAD.
Bullish Scenario:
Interest rate differential and commodity prices support the AUD
Economic growth and trade balance support the AUD
Please note that this is a general analysis and not personalized investment advice. It's essential to consider your own risk tolerance and market analysis before making any investment decisions.
Take advantage of the target and get away 🎯 Swing Traders Please reserve the half amount of money and watch for the next dynamic level or order block breakout. Once it is resolved, we can go on to the next new target in our heist plan.
Keep in mind that these factors can change rapidly, and it's essential to stay up-to-date with market developments and adjust your analysis accordingly.
💖Supporting our robbery plan will enable us to effortlessly make and steal money 💰💵 Tell your friends, Colleagues and family to follow, like, and share. Boost the strength of our robbery team. Every day in this market make money with ease by using the Thief Trading Style.🏆💪🤝❤️🎉🚀
I'll see you soon with another heist plan, so stay tuned 🫂

AUD/CAD "Aussie-Canadian" Forex Market Bullish Heist Plan🌟Hi! Hola! Ola! Bonjour! Hallo!🌟
Dear Money Makers & Robbers, 🤑 💰
Based on 🔥Thief Trading style technical and fundamental analysis🔥, here is our master plan to heist the AUD/CAD "Aussie-Canadian" Forex market. Please adhere to the strategy I've outlined in the chart, which emphasizes long entry. Our aim is the high-risk Red Zone. Risky level, overbought market, consolidation, trend reversal, trap at the level where traders and bearish robbers are stronger. 👀 So Be Careful, wealthy and safe trade.💪🏆🎉
Entry 📈 : You can enter a Bull trade at any point,
however I advise placing Buy limit orders within a 15 or 30 minute timeframe. Entry from the most recent or closest low or high level should be in retest.
Stop Loss 🛑: Using the 2H period, the recent / nearest low or high level.
Goal 🎯: 0.90800
Scalpers, take note : only scalp on the Long side. If you have a lot of money, you can go straight away; if not, you can join swing traders and carry out the robbery plan. Use trailing SL to safeguard your money 💰.
Fundamental Outlook 📰
Considering these factors, the AUD/CAD pair may experience a bullish trend in the short-term, driven by:
Australia's relatively stronger economy.
Canada's potential rate cuts in 2025.
Weakening Canadian dollar due to decreased energy exports.
However, this outlook is subject to change based on new economic data releases and shifts in global market sentiment.
Warning⚠️ : Our heist strategy is incompatible with Fundamental Analysis news 📰 🗞️. We'll wreck our plan by smashing the Stop Loss 🚫🚏. Avoid entering the market right after the news release.
Take advantage of the target and get away 🎯 Swing Traders Please reserve the half amount of money and watch for the next dynamic level or order block breakout. Once it is resolved, we can go on to the next new target in our heist plan.
💖Supporting our robbery plan will enable us to effortlessly make and steal money 💰💵 Tell your friends, Colleagues and family to follow, like, and share. Boost the strength of our robbery team. Every day in this market make money with ease by using the Thief Trading Style.🏆💪🤝❤️🎉🚀
I'll see you soon with another heist plan, so stay tuned 🫂

AUDCAD Buy signal at the bottom of the Channel Up.The AUDCAD pair has been trading within a Channel Up pattern since the September 27 2023 Low and at the moment it is in the process of forming a new Higher Low. All previous Higher Lows were formed one the 1D RSI almost touched the 30.00 oversold barrier. Right now it is a little more than 5.0 points away from it, so buying starts getting highly favorable on the current levels.
In any case, a break above the 1D MA50 (blue trend-line) would confirm the start of the new Bullish Leg and if it follows the previous sequence, it should peak above the -0.5 Fibonacci extension. As a result, our 0.95000 Target is more than valid for the medium-term.
-------------------------------------------------------------------------------
** Please LIKE 👍, FOLLOW ✅, SHARE 🙌 and COMMENT ✍ if you enjoy this idea! Also share your ideas and charts in the comments section below! This is best way to keep it relevant, support us, keep the content here free and allow the idea to reach as many people as possible. **
-------------------------------------------------------------------------------
💸💸💸💸💸💸
👇 👇 👇 👇 👇 👇

AUD/CAD Bank Money Heist Plan on Bullish SideOla! Ola! My Dear Robbers / Money Makers & Losers, 🤑 💰
This is our master plan to Heist AUD/CAD Bank based on Thief Trading style Technical Analysis.. kindly please follow the plan I have mentioned in the chart focus on Long entry. Our target is Red Zone that is High risk Dangerous level, market is overbought / Consolidation / Trend Reversal / Trap at the level Bearish Robbers / Traders gain the strength. Be safe and be careful and Be rich.
Entry : Can be taken Anywhere, What I suggest you to Place Buy Limit Orders in 15mins Timeframe Recent / Nearest Swing Low Point
Stop Loss 🛑 : Recent Swing Low using 2h timeframe
Attention for Scalpers : If you've got a lot of money you can get out right away otherwise you can join with a swing trade robbers and continue the heist plan, Use Trailing SL to protect our money 💰.
Warning : Fundamental Analysis news 📰 🗞️ comes against our robbery plan. our plan will be ruined smash the Stop Loss. Don't Enter the market at the news update.
Loot and escape on the target 🎯 Swing Traders Plz Book the partial sum of money and wait for next breakout of dynamic level / Order block, Once it is cleared we can continue our heist plan to next new target.
Support our Robbery plan we can easily make money & take money 💰💵 Follow, Like & Share with your friends and Lovers. Make our Robbery Team Very Strong Join Ur hands with US. Loot Everything in this market everyday make money easily with Thief Trading Style.
Stay tuned with me and see you again with another Heist Plan..... 🫂

AUDCAD Excellent buy signal on the 1D MA200The AUDCAD pair gave us an excellent sell signal last time (July 08 2024, see chart below) and easily hit the 0.9000 Target:
This time, we have an established Channel Up with two Higher Highs and three Higher Lows priced in already. We are currently on the new Bullish Leg following the rebound on the 1W MA200 (orange trend-line).
As long as this holds, we will treat every touch on the 0.786 as a buy opportunity, similar to the Triple Bottom of March - April. That Bullish Leg marginally surpassed the -0.5 Fibonacci extension to print its Higher High, so our Target will be just below it at 0.94000.
-------------------------------------------------------------------------------
** Please LIKE 👍, FOLLOW ✅, SHARE 🙌 and COMMENT ✍ if you enjoy this idea! Also share your ideas and charts in the comments section below! This is best way to keep it relevant, support us, keep the content here free and allow the idea to reach as many people as possible. **
-------------------------------------------------------------------------------
💸💸💸💸💸💸
👇 👇 👇 👇 👇 👇

AUDCAD Sell signal emerging on a 3.5-year Resistance!The AUDCAD pair just hit on the week's opening the Lower Highs trend-line that was first initiated on February 22 2021. As the 1W RSI is just below its own 3.5-year Resistance Zone, the first strong long-term sell opportunity flashes.
Check below how the last AUDCAD analysis (May 29, see chart below) provided an excellent buy opportunity:
The more short-term pattern though since the September 25 2023 Double Bottom is a Channel Up and it is close to pricing its new Higher High. This is just above the 3.5 year Lower Highs trend-line, so we give the sell signal this much tolerance level for some deviation.
Our Target on the medium-term is 0.9000 (Support Zone 1, similar symmetry to the previous Higher Low on Support Zone 2).
-------------------------------------------------------------------------------
** Please LIKE 👍, FOLLOW ✅, SHARE 🙌 and COMMENT ✍ if you enjoy this idea! Also share your ideas and charts in the comments section below! This is best way to keep it relevant, support us, keep the content here free and allow the idea to reach as many people as possible. **
-------------------------------------------------------------------------------
💸💸💸💸💸💸
👇 👇 👇 👇 👇 👇

Unleashing Trade Opportunities in Ranging Markets! AUDCAD📊 In this analysis, we dissect the AUDCAD currency pair, meticulously exploring its behavior on the 1D, 4H and 30m time frames. Brace yourself for insights into range-bound dynamics! 🎯
🔍 Key Takeaways:
💹 1: Learn how to spot breakouts when the market defies its established structure.
💹 2: Discover actionable strategies for capitalising on range-bound conditions.
Remember, this content is for educational purposes only—always make independent trading decisions based on your risk management strategy.

AUDCAD About to test the 1W MA200 after more than 1 year.The AUDCAD pair has been on a structured rise since the September 25 2023 Bottom, which technical is a Double Bottom formation for the long-term. The price is about to test the 1W MA200 (orange trend-line) for the first time since the week of March 20 2023 as well as the Lower Highs trend-line that started on the February 22 2021 High.
Every time the pair approached the 1W MA200 to this distance, it broke above it, even just for the medium-term. We expect a similar development, which would be conveniently a Lower Highs test. Our Target is 0.92250.
-------------------------------------------------------------------------------
** Please LIKE 👍, FOLLOW ✅, SHARE 🙌 and COMMENT ✍ if you enjoy this idea! Also share your ideas and charts in the comments section below! This is best way to keep it relevant, support us, keep the content here free and allow the idea to reach as many people as possible. **
-------------------------------------------------------------------------------
💸💸💸💸💸💸
👇 👇 👇 👇 👇 👇

AUDCADBased on the bullish flag pattern and Elliott Wave analysis on the AUD/CAD pair's 4-hour timeframe, there seems to be a potential opportunity for a buying position. The bullish flag suggests a continuation of the previous uptrend, while the Elliott Wave count indicates the formation of the 12345 impulse wave sequence. This convergence of patterns could signal a strong upward movement in price, presenting a favorable entry point for buyers. However, it's crucial to implement proper risk management strategies and confirm signals with additional indicators before entering the trade.

AUDCAD Sell opportunity with Death Cross emergingThe AUDCAD pair is on a Lower Highs rejected and ahead of a Death Cross formation on the 1D time-frame. Since 2022, we have seen two Falling Wedge patterns, which accelerated selling after the completion of a 1D Death Cross. The first target on both occasions was the 1.236 Fibonacci extension.
As a result, we are bearish on this pair, targeting 0.86500 (Fib 1.236 ext).
-------------------------------------------------------------------------------
** Please LIKE 👍, FOLLOW ✅, SHARE 🙌 and COMMENT ✍ if you enjoy this idea! Also share your ideas and charts in the comments section below! This is best way to keep it relevant, support us, keep the content here free and allow the idea to reach as many people as possible. **
-------------------------------------------------------------------------------
💸💸💸💸💸💸
👇 👇 👇 👇 👇 👇

AUDCAD Buy signal on 1D Golden Cross.The AUDCAD pair is trading within a Channel Up pattern that has currently been rejected twice on Resistance 1 (0.905500). With the 1D MA50 (blue trend-line) crossing today (or tomorrow the latest) above the 1D MA200 (orange trend-line) to complete a 1D Golden Cross, and the 1D MACD forming now a Bullish Cross, we have a strong case for a break-out above Resistance 1 this time.
Once this takes place, we will buy and target 0.9200 as the new Higher High of the Channel Up. It will be a +3.76% rise from the recent Higher Low, which is roughly the % rise of the previous 2 bullish legs.
Bonus material (past AUDCAD trade):
-------------------------------------------------------------------------------
** Please LIKE 👍, FOLLOW ✅, SHARE 🙌 and COMMENT ✍ if you enjoy this idea! Also share your ideas and charts in the comments section below! This is best way to keep it relevant, support us, keep the content here free and allow the idea to reach as many people as possible. **
-------------------------------------------------------------------------------
💸💸💸💸💸💸
👇 👇 👇 👇 👇 👇

AUDCAD Rejection on the 1D MA200. Sell.Our last signal on the AUDCAD pair (see chart below) was a dip buy within the width of the multi-month Channel Down:
The Channel Up is adjusted as on Tuesday, the pair got rejected on the 1D MA200 (orange trend-line) forming the new Lower High. As the same time, the 1D RSI got rejected on its 5-month Resistance Zone and today the sell signal is confirmed by the formation of the 1D MACD Bearish Cross. Sell and aim for a -4.14% (previous Lower High rejection decline) drop at 0.854500.
-------------------------------------------------------------------------------
** Please LIKE 👍, FOLLOW ✅, SHARE 🙌 and COMMENT ✍ if you enjoy this idea! Also share your ideas and charts in the comments section below! This is best way to keep it relevant, support us, keep the content here free and allow the idea to reach as many people as possible. **
-------------------------------------------------------------------------------
💸💸💸💸💸💸
👇 👇 👇 👇 👇 👇

AUDCAD: 02/10/2023:🔴Short opportunity (Please read the caption)
Hello traders, we need LTF confirmation for both zones. We should not enter as a limit order.
Both zones are valid.
💡Wait for the update!
🗓02/10/2023
🔎 DYOR
💌It is my honor to share your comments with me💌

AUDCAD One Low to go inside the Channel Down.The AUDCAD pair has been trading within a Channel Down since the February 09 High, having failed to achieve any 1D candle closing above the 1D MA50 (blue trend-line) since July 26. The current price action resembles the start of the Channel Down. Based on symmetry, we have one last Lower Low to achieve and then we should be expecting a rebound to test the 1D MA50. We will buy just below Support 2 (0.85915) and target 0.8700.
-------------------------------------------------------------------------------
** Please LIKE 👍, FOLLOW ✅, SHARE 🙌 and COMMENT ✍ if you enjoy this idea! Also share your ideas and charts in the comments section below! **
-------------------------------------------------------------------------------
💸💸💸💸💸💸
👇 👇 👇 👇 👇 👇

AUDCAD Lower High rebound expected within the Channel UpThe AUDCAD pair followed our prediction on the last analysis we made a month ago (see chart below) and hit two targets on the way to the bottom of the long-term Channel Down:
The price is now on the 2nd straight green 1D candle after a flat Friday, which was most likely the bottom reversal of the Channel Down. As the 1D RSI hit the bottom of its Rectangle pattern as well, we treat this as a strong buy opportunity on the medium-term, targeting not just the 1D MA50 (blue trend-line) but also the Internal Lower Highs trend-line. Our target is 0.89000, but will book the profit earlier if the 1D RSI approaches the top of its Rectangle before that price target.
-------------------------------------------------------------------------------
** Please LIKE 👍, FOLLOW ✅, SHARE 🙌 and COMMENT ✍ if you enjoy this idea! Also share your ideas and charts in the comments section below! **
-------------------------------------------------------------------------------
💸💸💸💸💸💸
👇 👇 👇 👇 👇 👇

AUDCAD Will Fall From Falling Resistance!AUD-CAD was going up
After the pair made a rebound
From the local bottom but
The pair is still in the downtrend
And is trading in a below
The falling resistance
So after the retest I think
That a move down is
Very likely !

AUDCAD is starting a long-term corrective legIt's been 2.5 months since we last traded AUDCAD, when it gave us a sell signal (see chart below) right at the top of its Channel Down for maximum gain:
Right now, the pattern is getting wider and its new bearish leg to a new Lower Low may be starting as last Friday's inability to close above the 1D MA200 (orange trend-line) may result in a Lower High rejection at the top of the Channel Down.
The 1D RSI is trading within a Rectangle pattern, which just hit its top and that matches with the tops of the Channel Down. We are opening two sell positions now, one targeting Support 1 at 0.88350 and the other Support 2 at 0.877450. If broken and the short-term rebound gets rejected on the 1D MA50 (blue trend-line), we will open a new sell to target the bottom of the Channel Down and Support 3 at 0.8600.
-------------------------------------------------------------------------------
** Please LIKE 👍, FOLLOW ✅, SHARE 🙌 and COMMENT ✍ if you enjoy this idea! Also share your ideas and charts in the comments section below! **
-------------------------------------------------------------------------------
💸💸💸💸💸💸
👇 👇 👇 👇 👇 👇

AUDCAD Buy TF H4 TP = 0.8947On the 4-hour chart the trend started on June 30 (linear regression channel).
There is a high probability of profit. A possible take profit level is 0.8947
But do not forget about SL = 0.8740
Using a trailing stop is also a good idea!
Please leave your feedback, your opinion. I am very interested. Thank you!
Good luck!
Regards, WeBelieveInTrading

AUDCAD LongOANDA:AUDCAD
RSI was in a long oversold and it has ended. The price has also reached a very important support level. The key points for the target are the 38%, 50%, 61.8% and 88% Fibonacci percentages. what's your opinion?
