AUDCAD Trade Idea👀👉 The AUDCAD has broken structure to the downside on the daily (1D) time frame. I expect this movement may continue downward toward the previous lows indicated on the chart.
It’s important to note that these insights are speculative and not guaranteed predictions. Confirming specific price actions before entering any trades is essential, as highlighted in the video. This analysis provides a comprehensive overview of the current trend, market structure, and price behavior. Keep in mind that this content is for educational purposes and does not ensure success. Trading carries significant risks, so always apply robust risk management strategies. 📈✅
Audcadtrade

AUDCAD Bearish Robbery plan to make moneyMy Dear Robbers / Traders,
This is our master plan to Heist AUDCAD Bank based on Thief Trading style Technical Analysis.. kindly please follow the plan I have mentioned in the chart focus on Short entry. Our target is Green Zone that is High risk Dangerous level, market is oversold / Consolidation / Trend Reversal at the level Bullish Robbers / Traders gain the strength. Be safe and be careful and Be rich.
Note: If you've got a lot of money you can get out right away otherwise you can join with a swing trade robbers and continue the heist plan, Use Trailing SL to protect our money.
Stop Loss : Recent Swing High using 2h timeframe
Warning : Fundamental Analysis comes against our robbery plan. our plan will be ruined smash the Stop Loss. Don't Enter the market at the news update.
Loot and escape on the target 🎯 Swing Traders Plz Book the partial sum of money and wait for next breakout of dynamic level / Order block, Once it is cleared we can continue our heist plan to next new target.
support our robbery plan we can easily make money & take money 💰💵 Join your hands with US. Loot Everything in this market everyday make money easily with Thief Trading Style.

AUDCAD Bank Bullish Robbery PlanMy Dear Robbers / Traders,
This is our master plan to Heist AUDCAD Market based on Thief Trading style Technical Analysis.. kindly please follow the plan I have mentioned in the chart focus on Long entry. Our target is Red Zone that is High risk Dangerous level, market is overbought / Consolidation / Trend Reversal at the level Bearish Robbers / Traders gain the strength. Be safe and be careful and Be rich.
Note: If you've got a lot of money you can get out right away otherwise you can join with a swing trade robbers and continue the heist plan, Use Trailing SL to protect our money.
Stop Loss : Recent Swing Low using 2h timeframe
Warning : Fundamental Analysis comes against our robbery plan. our plan will be ruined smash the Stop Loss. Don't Enter the market at the news update.
Loot and escape on the target 🎯 Swing Traders Plz Book the partial sum of money and wait for next breakout of dynamic level / Order block, Once it is cleared we can continue our heist plan to next new target.
support our robbery plan we can easily make money & take money 💰💵 Join your hands with US. Loot Everything in this market everyday make money easily with Thief Trading Style.

AUDCAD: Easy 200+ Pips Bullish Buy! What do you all think? OANDA:AUDCAD
Price has failed to breakthrough previous lows anticipating large volume of buyers to enter in the market, which will help us gain 200+ pips . Please use accurate risk management while following this idea. Do your own research too.
**If you like our idea, then comment and like the idea which will help us encouraged**
Team SetupsFX_

AUDCADThis is the move I am expecting AUDCAD to make, a move upward to take out the previous lower high before aiming for the higher high.

Unleashing Trade Opportunities in Ranging Markets! AUDCAD📊 In this analysis, we dissect the AUDCAD currency pair, meticulously exploring its behavior on the 1D, 4H and 30m time frames. Brace yourself for insights into range-bound dynamics! 🎯
🔍 Key Takeaways:
💹 1: Learn how to spot breakouts when the market defies its established structure.
💹 2: Discover actionable strategies for capitalising on range-bound conditions.
Remember, this content is for educational purposes only—always make independent trading decisions based on your risk management strategy.

AUDCAD Short Trade Setup A #short trade opportunity recently presented itself on the #aussieloonie (#AUDCAD) #trading chart 📉.
This is indicated by the #bearish engulfing candlestick 🕯️ pattern just below the 0.90717 horizontal resistance level.
This indicates a rejection of the same level, with potential price move in the downward 👇 ⬇️ direction (#sell).
Sufficient downward momentum should see price dumping towards the 0.88500 psychological level and possibly testing the strength of the 0.88046 horizontal support level.
As always, please apply appropriate risk management.
Happy trading!
#crosspair

#AUDCAD: 300+ PIPS A GREAT BUYING OPPORTUNITY. Dear Traders,
Tonight due to news price took out the sell side liquidity, price rebounded from key level and currently looking at our price going up towards our target. Use proper risk management.
Good Luck.

AUDCAD $AUDCAD - Apr. 18th, 2024AUDCAD OANDA:AUDCAD - Apr. 18th, 2024
BUY/LONG ZONE (GREEN): 0.88750 - 0.89550
DO NOT TRADE/DNT ZONE (WHITE): 0.88500 - 0.88750
SELL/SHORT ZONE (RED): 0.87850 - 0.88500
Weekly: DNT (at last week's close it was labeled bullish, with current momentum it's DNT)
Daily: Bearish
4H: Bearish
OANDA:AUDCAD has broken done into the next zone.
This is what I would personally look at before entering trades, everything is subject to change on a daily basis and as I analyze different timeframes and ideas.
EDUCATIONAL/ENTERTAINMENT PURPOSES ONLY, NOT FINANCIAL ADVICE!
trendanalysis, trendtrading, priceaction, priceactiontrading, technical indicators, support and resistance, audcad, acad, aud, cad, GETTEX:AUD , LSE:CAD , OANDA:AUDCAD , forex, forexcurrency, forextrading, fx, fxpairs, fxaudcad, audcadtrend, audcadidea, audcadtrade, audcadsetup, audcadforecast, audcadlevel, audcadzone, audcadshort, audcadlong,

AUDCAD Trade Alert - Bearish Setup at Key Support Breakout.Bearish Trendline at 4-Hour Time Frame:
AUDCAD has been following a bearish trendline in the 4-hour time frame, indicating a prevailing downward momentum in the market.
Observation of Dow Theory:
Additionally, the market has been adhering to the principles of Dow Theory, reinforcing the bearish sentiment.
Retracement and Rejection:
A retracement up to the 0.5 Fibonacci level was observed, followed by a clear downward rejection, suggesting strong selling pressure at higher levels.
Current Position at Key Support Zone:
Presently, the price is hovering around a critical support zone, signifying a pivotal area where significant price action is anticipated.
Trade Setup:
We anticipate a continuation of the bearish move if the price breaks below this key support level.
Entry Strategy:
A prudent entry point for short positions is identified near 0.88863, aligning with the bearish outlook.
Risk Management:
To mitigate potential losses, a Stop Loss is recommended near 0.89279, providing a buffer against adverse price movements.
Profit Targets:
Our profit-taking strategy involves targeting TP-1 at 0.8450 and TP-2 at 0.88030, reflecting our expectation of downward price movement.
Conclusion:
In conclusion, based on the technical analysis of AUDCAD, we anticipate further downside potential, with a well-defined entry point, risk management, and profit-taking levels in place to optimize trading outcomes.

AUDCAD Trade IdeaIn this video, we delve into a comprehensive technical analysis and trading concept for AUDCAD. Our assessment reveals a potential trade opportunity. We meticulously analyze the current price action, closely scrutinize market structure, and incorporate market dynamics. Based on favorable conditions, we identify a potential entry point. However, it is crucial to underscore the significance of implementing robust risk management strategies. Please note that this video is purely educational and should not be construed as financial advice.

AUDCAD Bullish Breakout! AUD-CAD was trading below
The falling resistance
But now we are seeing
A bullish breakout so
I am now locally bullish
Bias and I think that we
Will see a further move up!

AUDCAD - SHORT & LONG ENTRY - 1H - Application of DOW TheoryAUDCAD Charts shows a Complex pattern in which it frequently changing trends after a small time interval. So it will be suggest to take two positions a small SHORT entry which will be hit in few hours or take LONG entry which will take more than 20 hours.
Hope this helps you.
Happy Trading

AUDCAD Trade IdeaThe AUDCAD pair has reached a critical support level, marked by this horizontal line on our chart that corresponds to a previous daily open/close. The price is clearly overextended and we expect a correction soon. A potential trade setup may arise later today when the Canadian GDP data is announced. If the data is positive for the CAD, this could offer a good sell opportunity. We are eagerly awaiting this news release. Please note that this is only a trade idea and not a trade recommendation, the information is for educational purposes only and should not be considered as financial advice.

AUDCADI am expecting AUDCAD to make a move upward, thereby taking out the previous high before making way to my TP.

AUDCADAUDCAD long term view is bullish where we expect price to grow from the current moment and there are three possible three target, possible of reaching all target duration will be by end of the January. Reason for buying is totally based on technical side of the market and charts does show strong bullish bias. Like and Comment ;)

AUDCAD Technical Analysis And Trade Idea Asian OpenIn this video, we embark on an in-depth analysis of the AUDCAD currency pair, with a primary focus on the existing bullish price momentum witnessed in both the 1-day (1D) timeframe. It is worth noting that the currency pair is approaching a critical support level, hinting at the potential for a forthcoming upswing. Throughout our discussion, we will delve deeply into the intricate aspects of technical analysis, encompassing the current market trend, price dynamics, market structure, and other essential components of technical analysis. As we progress through this video, we will explore a potential trading opportunity.
It is crucial to emphasize that the information presented in this video is intended solely for educational purposes and should not be considered as financial advice. It is essential to understand that participation in the foreign exchange market involves a significant level of risk. Consequently, it is imperative to prudently incorporate robust risk management strategies into your trading plan.

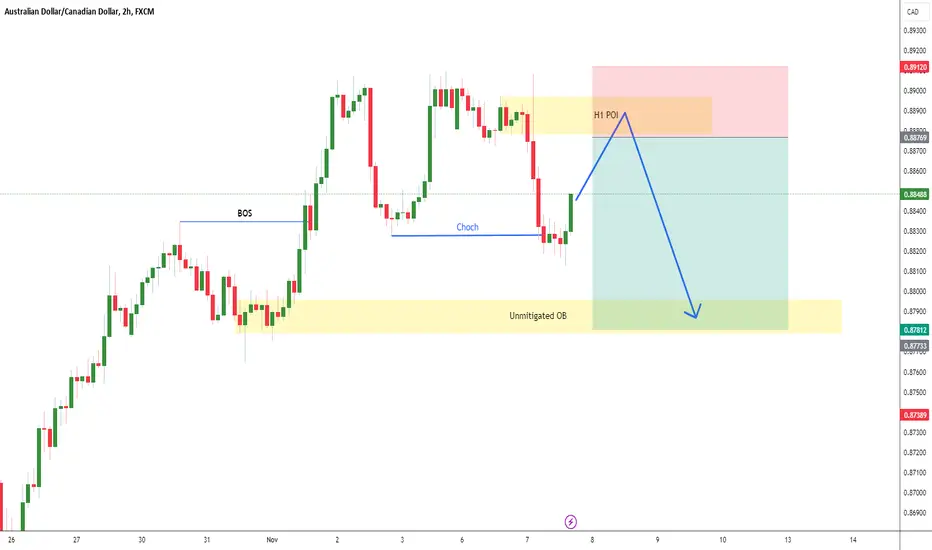
AUDCAD, Expecting down H1AUDCAD, i am Expecting down in H1 soon but it will go a little bit up to take the POI then it will fall directly down to unmitted OB.
AUDCAD Analysis H4Here is my analysis for AUDCAD on H4 using Order Block. The price could go bearish, you can put a pending order on the Order block or find an entry on LTF within OB Zone. Trade Safe!

Daily Wave Rider - AUDCAD - SELLAUDCAD
Channel: RED
WK Pivot: RED
AOB: WS1
CON: SBB
SELL Stop: 0.85838
Stop Loss: 0.86677
TP01: 0.84999
TP02: 0.83321
DWR present as a sell setup on 16 OCT, with Channel and Pivot are red bouncing off weekly support line
However, trade is not taken/considered as it is Monday which is normally correction day and market is unpredictable
SPX500: SELL
DXY: SELL
OIL: SELL
GOLD: BUY

Daily Wave Rider - AUDUSD - SELLAUDUSD
Channel: RED
WK Pivot: RED
AOB: EMA10
CON: SBB
SELL Stop: 0.63155
Stop Loss: 0.63778
TP01: 0.62532
TP02: 0.61286
DWR present as a sell setup on 6 OCT, with Channel and Pivot are red bouncing off EMA10
However, trade is not taken/considered
SPX500: BUY
DXY: SELL
OIL: SELL
GOLD: SELL

AUDCAD Analysis H1Here is my analysis for AUDCAD on H1 using Order Block. The price could go bearish, you can put a pending order on the Order block or find an entry on LTF within OB Zone. Trade Safe!
