CHF at Key Technical Support⏰CHF at key levels ⏰
Overview
The Swiss Franc is at key technical support levels on several pairs. The CHF strength is driven by the Israel-Hamas war.
The Details
The support levels will likely not hold if there is further escalation in the region. Expect the support levels to break and ***CHF pairs to move lower.
If by some miracle, the war becomes stagnant or things de-escalate, the support levels could hold.
Things to consider
Buying the CHF is painful due to Switzerland's low-interest rate. The swap rate offered by most brokers is off-putting.
A better trade may be a de-escalation trade, though we could be waiting a while
The Swiss Franc continues to downtrend longer-term. A de-escalation trade may catch a downside correction move rather than a long-term uptrend.
The CHF could strengthen on global recession fears, possibly in the coming months.
AUDCHF


AUDCHF Long OpportunityMarket Structure is KING!
Hey, if you like this idea be sure to support with a like and a follow.
Here is my analysis for AUDCHF for the upcoming week. AUD News this week. I'm looking to buy this upcoming week.
What are your thoughts? Leave it in the comments below!
Blue Signal FX Rules-Based Trading
1. CHECK THE NEWS!
2. WHAT IS THE OVERALL TREND? Market structure will give you direction.
3. IS PRICE AT A LEVEL OF SUPPLY OR DEMAND (SUPPORT OR RESISTANCE)?
4. IS PRICE APPROACHING A LEVEL OF SUPPLY OR DEMAND (SUPPORT OR RESISTANCE)?
5. ARE YOU TRADING WITH THE TREND OR AGAINST THE TREND (MAKE SURE YOU ONLY TRADE AGAINST THE TREND ON THE 4HR TIME-FRAME AND ABOVE.
6. CHECK FOR DIVERGENCE.

AUDCHF FORECASTwe are waiting for any bullish reversal confirmation on the lower time frames to let us be able to determine the strength of the current support that have multiple touches.
what do you think ?

AUDCHF: 18/10/2023:🔴Sell opportunity
Well, you can see important supply zone ond bearish order block on the chart.
In these zones we can search for a low time frame confirmation.
Please pay attention to the details.
💡Wait for the update!
🗓18/10/2023
🔎 DYOR
💌It is my honor to share your comments with me💌

AUDCHF SHORT - MOMENTUM IS BACK!Waiting for a retest of 0.86107 to short AUDCHF back to 4H swing low at 0.56064
If you agree drop a like and if you have any questions leave a comment :)

AUDCHF Potential DownsidesHey Traders, in the coming week we are monitoring AUDCHF opportunity around 0.57400 zone, AUDCHF was trading in an uptrend and successfully managed to break it out. Currently is in a correction phase in which it is approaching the retrace area at 0.57400 support and resistance zone.
Trade safe, Joe.

AUDCHF: Heading back to the descending channel boundary and ATLThis pair has been following a descending channel for months and even with positive data last week for the aussie and weaker performance for the swiss, the general direction was maintained.
We've broken back below the mid point of my channel and we seem destined to ultimately be heading for the ATL where I expect a strong bounce.
I generally look at correlation with gold, this pair tends to fall with gold from what I can see, but more of an observation than analysis (which I should look to do).

AUDCHF: Long Trade Explained
AUDCHF
- Classic bullish formation
- Our team expects growth
SUGGESTED TRADE:
Swing Trade
Buy AUDCHF
Entry Level - 0.5726
Sl - 0.5688
Tp - 0.5797
Our Risk - 1%
Start protection of your profits from lower levels
❤️ Please, support our work with like & comment! ❤️

USDCHF Potential UpsidesHey Traders, in today's trading session we are monitoring USDCHF for a buying opportunity around 0.90500 zone, USDCHF was trading in a downtrend and successfully managed to break it out and currently is in a correction phase in which it is approaching the retrace area at 0.90500 support and resistance area.
Trade safe, Joe.

AUDCHF, More sell off in the way?AUDCHF / 1D
Hello traders, welcome back to another market breakdown.
AUDCHF has been trading in a down trend, the price is now in pull-back mode. I have my eyes on this previous S/R level where a potential lower high.
Checkout the chart for the trigger plan.
Trade safely,
Trader Leo

AUDCHF - Bearish Move 📉
Hello Traders !
On 29 Friday September, The AUDCHF Price Reached A Resistance Level (0.59166 - 0.59294).
Currently, The Price Failed To Create a New Higher High.
The Last Higher High is Broken (Break of Structure).
The Support Line is Broken.
So, I Expect a Bearish Move📉.
-----------
TARGET: 0.57420🎯
___________
if you agreed with this IDEA, please leave a LIKE, SUBSCRIBE or COMMENT!

More correction down for Audchf?Likely more down side.
**Find out more from my Tradingview Stream this week**
***************************************************************************************
Hello there!
If you like my analysis and it helped you ,do give me a thumbs ups on tradingview! 🙏
And if you would like to show further support for me, you can gift me some coins on tradingview! 😁
Thank you!
Disclaimers:
The analysis shared through this channel are purely for educational and entertainment purposes only. They are by no means professional advice for individual/s to enter trades for investment or trading purposes.
The author/producer of these content shall not and will not be responsible for any form of financial/physical/assets losses incurred from trades executed from the derived conclusion of the individual from these content shared.
Thank you, and please do your due diligence before any putting on any trades!

AUDCHF | GOOD H&S FOR A SELL?Hey Traders!
I believe we have a good chance to continue dropping down for about 20-40 pips before pullback and if we break support we should be re-testing higher timeframe support.
Nice head & shoulders pattern breaking 200 ma is a good indicator for further bearish pressure.

AUDCHF Reversal scenarioWith the conflict happening in the middle east, we have seen commoditiy prices go up and this situation where gold is going up should make the australian dollar perform well as it has done in the past. Now, AUDCHF has just found a solid support at around the round number of 0.5800 and failed to create lower lows which is a sign that sellers are progressively losing control. I expect price to start going up in the near future...

AUDCHFAUDCHF is trading in descending channel and printing consistent LLs LHs. Recently the price is broken the important support zone and now retesting the broken level, which is also the 0.38% Fib retracement level.
If the sell momentum continues the next target could be 0.5770 followed by 0.5740 region.
What you guys think of this idea

AUDCHF Short Term Buy IdeaH4 - Bullish trend pattern.
Currently it looks like a pullback is happening.
No opposite signs.
Until the two strong support zones hold my short term view remains bullish here.

AUDCHF Analysis H1Here is my analysis for AUDCHF on H1 using Order Block. The price could go bearish, you can put a pending order on the Order block or find an entry on LTF within OB Zone. Trade Safe!

Why is AUD/CHF Going Down?The Australian dollar (AUD) has been on a downward trajectory against the Swiss franc (CHF) since the beginning of October 2023. The AUD/CHF exchange rate has fallen from 0.60 to 0.58, representing a decline of over 3%.
There are a number of factors that have contributed to this decline. One factor is the ongoing strength of the Swiss franc. The CHF is considered to be a safe-haven currency, and investors tend to flock to it during times of uncertainty. The current global economic climate is uncertain due to a number of factors, including the war in Ukraine, rising inflation, and concerns about a recession. As a result, the CHF has been in high demand, which has pushed its value higher.
Another factor that has contributed to the decline in the AUD/CHF exchange rate is the weakening of the Australian dollar. The AUD has been under pressure due to a number of factors, including the slowdown in the Chinese economy, rising interest rates in the United States, and concerns about the outlook for the global economy. As a result, the AUD has fallen against a number of currencies, including the CHF.
The image attached to the query shows the AUD/CHF exchange rate over the past year. The chart shows that the exchange rate has been on a downward trajectory since the beginning of October 2023. The decline in the AUD/CHF exchange rate is likely to continue in the near term, as the factors that are driving the decline are expected to remain in place.
Here is a more detailed explanation of the factors that are driving the decline in the AUD/CHF exchange rate:
Strength of the Swiss franc: The CHF is considered to be a safe-haven currency, and investors tend to flock to it during times of uncertainty. The current global economic climate is uncertain due to a number of factors, including the war in Ukraine, rising inflation, and concerns about a recession. As a result, the CHF has been in high demand, which has pushed its value higher.
Weakness of the Australian dollar: The AUD has been under pressure due to a number of factors, including the slowdown in the Chinese economy, rising interest rates in the United States, and concerns about the outlook for the global economy. As a result, the AUD has fallen against a number of currencies, including the CHF.
Trade flows: Australia and Switzerland have a relatively small trade relationship. This means that the AUD/CHF exchange rate is not as sensitive to trade flows as some other currency pairs. However, the slowdown in the Chinese economy is likely to have a negative impact on the Australian economy, and this could lead to a further decline in the AUD/CHF exchange rate.
Interest rates: The Swiss National Bank (SNB) has maintained a negative interest rate policy for several years. However, the SNB is expected to raise interest rates in the near future. This is likely to make the CHF more attractive to investors, and could lead to a further decline in the AUD/CHF exchange rate.
Overall, the decline in the AUD/CHF exchange rate is likely to continue in the near term, as the factors that are driving the decline are expected to remain in place. Investors should closely monitor the global economic climate, the strength of the Swiss franc, and the performance of the Australian economy to assess the outlook for the AUD/CHF exchange rate.
Bard may display inaccurate or offensive information that doesn’t represent Google’s views. Bard Privacy Notice

AUDCHF: Important Breakout & Very Bearish Pattern 🇦🇺🇨🇭
Take a look at a strong rejection from a key horizontal daily resistance on AUDCHF.
After a test of 0.5925 level the market dropped and violated a support line of a rising parallel channel.
Taking into consideration that the pair is trading in a long term bearish trend,
probabilities are high that the market will drop now.
Goals: 0.577 / 0.567
❤️Please, support my work with like, thank you!❤️

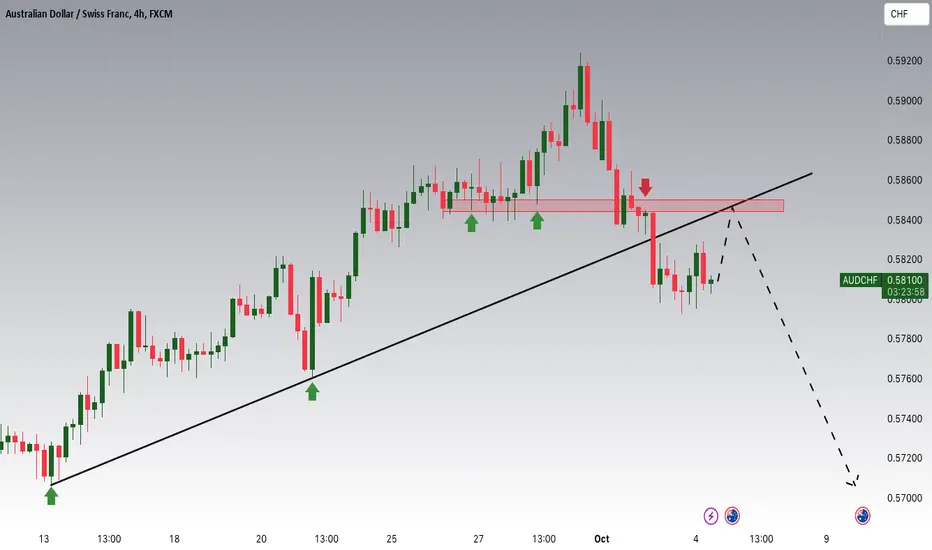
AUDCHF Potential DownsidesHey Traders, in today's trading session we are monitoring AUDCHF for a selling opportunity around 0.58400 zone, AUDCHF is trading in an uptrend and successfully managed to break it out. Currently is in a correction phase in which it is approaching the retrace area.
Trade safe, Joe.
AUDCHF -- Downtrend ContinuationHello Traders!!
Appears the AUDCHF pair is continuing to move the downward, a trend that started Jun of 2022. I have open a short swing as of last night, with my stop set at breakeven point. If today & tomorrow closes bearish, I feel confident the trend will continue!
The overall Daily trendline actually hugs the 200 MA line, which looks pretty, nonetheless.
Happy trading, Jason.

AUDCHF: Reversing near the top of the Channel Down.AUDCHF may have crossed over the 1W MA100 but eventually failed, also on the 0.5 Fibonacci level, and appears to be reversing. The technical outlook on the 1D time-frame is neutral (RSI = 55.574, MACD = 0.003, ADX = 42.778), so it is a valid sell entry. On top of that, every LH inside this 15 month Channel Down (exception Jan 23rd 2023) has been around the 0.5 Fibonacci level. All this while the 1D MACD is close to a Bearish Cross formation. Sell and target the bottom of the Channel Down over the -0.382 Fib (TP = 0.54500).
Prior idea:
## If you like our free content follow our profile to get more daily ideas. ##
## Comments and likes are greatly appreciated. ##
