Bull Hugging The Bear It's a good bullish indication, when you see one very bearish day (2017-03-16) being "hugged" by bullish days. Hoping to see a clear bullish day tomorrow as well by the end of day, to get the well known 'Three Bullish Soldiers'. Much as I like word play, I do not blindly follow that indication, yet, adding macro economics and several others indicators, it shows a bullish sentiment.
Audchfforecast

AUDCHF Uptrend.AUDCHF has been in a steady uptrend since 24/08/15.
The 50% retrace could be a good opportunity for a long position.
Only if it bounces strongly off of it at .765.
This pair is currently retracing a drop from .87.
Good TP could be .79, which is the 38.2 point.

AUDCHF Flag area good trading opportunitiesHi traders!I hold a point:Good charts does not more words to explain! Good luck!

AUDCHF short term A break of the 50ema could open up the high side and retest the .7590 zone which would act as the upper parallel for the channel. If it fails to break above the 50 we have another trend line which would act as the upper parallel and push price back down to the .75 zone to create a new low.

Aud/Chf Can the uptrend continue? (Feedback appreciated)Forgive me I am not specialist when it comes to knowing all the bullish and bearish pattern formations YET. But it has been in a clear bullish channel for a while now. But recently its created higher lows and highs. It can continue to rise up as I have drawn. I can tell it is in a breakout formation to the upside or down is too early to tell.

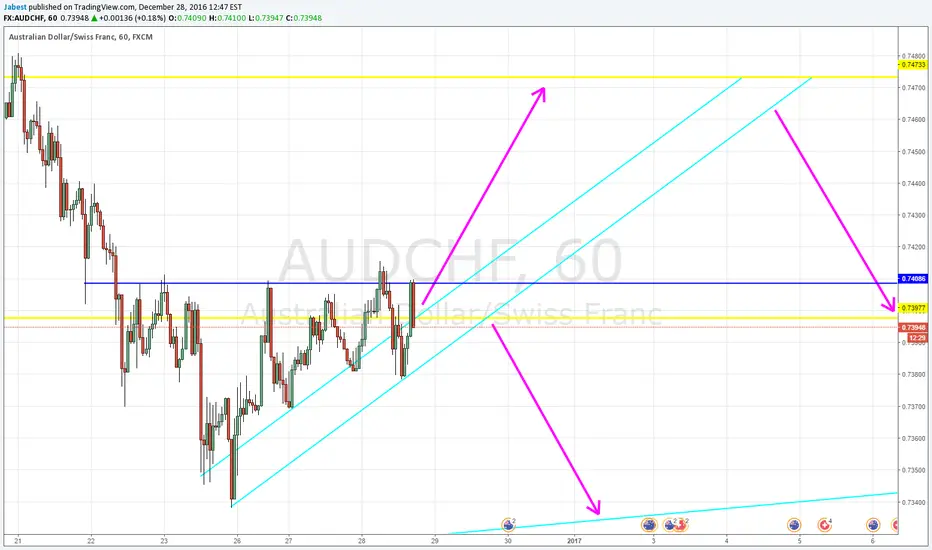
AUD/CHF Trade OpportunityThere should be an opportunity here for a buy or sell depending on what happens with the price action.
If price closes above the dark blue resistance line, I would expect price to go up to at least around the .74700 area. To take the safest trade, wait for a re-test of the resistance line (which would be support at a retest). If price ever closes below the lower of the 2 parallel trend lines then it would be time to look for a short. To take the safest trade, wait for a retest of the trend line.
If price closes below the lower of the 2 parallel upward trendlines, I would expect price to continue down to the lower trendline. Be careful with taking a short after price closes above the blue resistance line as price could reverse around the .74000 area.
As always on my charts:
Red Lines - Monthly Support & Resistance
Orange Lines - Weekly Support & Resistance
Yellow Lines - Daily Support & Resistance
Dark Blue Lines - Support & Resistance Area I'm currently looking at (in this case 1 hr -0.44% .)
AUDCHF W FORMING ! 0.5 FIB IS BROKE AND I AM WAITING TO TOUCH 0.61 ZONE AND THEN ROCKET TO THE RESISTANCE ZONE !
IT WILL BE A GOOD 140 PIPS

AUD/CHF, DAY CHART, SHORT (27-NOV-2016)AUD/CHF is trading in the range between the resistance and support zone indicated.
In recent times, the price is trading in a downward channel.
The price is approaching the resistance zone and the upper side of the downward trendline.
We see the recent candlestick as a bearish pin bar.
If the bullish trend still remain strong, don't bother to entry as the potential reward/risk is not good.
Trade safely with proper risk management :)
