Setting up for next Impulse Hi Traders,
AUDCHF has been consolidating since December in a larger channel which now the price is approaching the HTF upper boundary moving within a LTF corrective channel. If we look where the first impulse began, we can see that the price made a double top which then impulsively pushed down with a bearish continuation to give more room to fall. After a strong Impulse comes a correction and as we know, the more swing highs & lows it creates gives us confluence for another impulse movement.
Watch for a strong rejection with LTF bearish price action to catch the next impulse phase.
What's your view on this pair? Share a comment below.
Support me by clicking the like button If you feel this idea was helpful !
Trade Safe.
Audchflong

AUDCHF LongHey traders, in today's trading session we are monitoring AUDCHF for a long term buying opportunity around 0.656. Once we will receive any bullish confirmation the trade will be executed.
Trade safe, Joe.


AUDCHF | Important ZoneAUDCHF is making good higher highs and higher low. Currently it is standing at resistance. The price action is very strong at the moment and we think it will break resistance.
Alternatively, bears can attack from the resistance so the clear breakout is needed to negate this view.
Trade your levels accordingly.

AUDCHF analysis long position for AUDCHF in the small time frame
pay attention you should have 1 percent resk for entering to position

Audchf Buys 0.65000audchf: focus remains at my lower "line" for buys taken here for me at the 0.65000 region and for price to remain above this line for my bullish bias to hold true 👁️ for those that took this with me to end off the week

AUDCHF Triangle TradeIn this update we review the recent price action in AUDCHF and identify the next high probability trading opportunity and price objectives to target.

AUD/CHF BUY IDEAHey tradomaniacs,
welcome to a new free trading-setup.
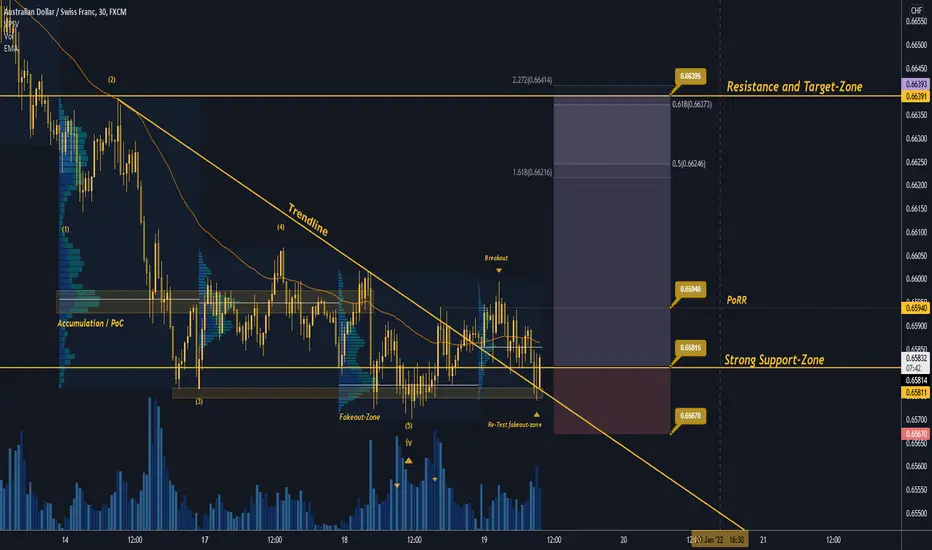
AUD/CHF:Daytrade-Execution
Market-Buy-Order: 0.65815
Stop-Loss: 0.65670
Point of Risk-Reduction: 0.65940
Take-Profit: 0.66395
Stop-Loss: 15 pips
Risk: 0,5% -1%
Risk-Reward: 4,0
LEAVE A LIKE AND A COMMENT - I appreciate every support! =)
Peace and good trades
Irasor
Wanna see more? Don`t forget to follow me
AUDCHF LongHey traders, in today's trading session we are monitoring AUDCHF for a buying opportunity around 0.665 zone. Once we will receive any bullish confirmation the trade will be executed.
Trade safe, Joe.

AUDCHF SHORTS 📉📉📉Expect bearish price action on this pair as price takes out liquidity above buy side liquidity and weekly lows which means market is due for a correction, we are in a bearish market strucutre. RISK OFF market sentiment that means CHF should be strong and AUD weak, we also took out liquidity above psychological barrier 0.66500
What do you think ?

💡Don't miss the great buy opportunity in AUDCHFTrading suggestion:
". There is a possibility of temporary retracement to the suggested support line (0.6626).
. if so, traders can set orders based on Price Action and expect to reach short-term targets."
Technical analysis:
. AUDCHF is in a range bound, and the beginning of an uptrend is expected.
. The price is above the 21-Day WEMA, which acts as a dynamic support.
. The RSI is at 50.
Take Profits:
TP1= @ 0.6671
TP2= @ 0.6695
TP3= @ 0.6715
TP4= @ 0.6731
TP5= @ 0.6758
SL= Break below S2
❤️ If you find this helpful and want more FREE forecasts in TradingView
. . . . . Please show your support back,
. . . . . . . . Hit the 👍 LIKE button,
. . . . . . . . . . Drop some feedback below in the comment!
❤️ Your support is very much 🙏 appreciated!❤️
💎 Want us to help you become a better Forex / Crypto trader?
Now, It's your turn!
Be sure to leave a comment; let us know how you see this opportunity and forecast.
Trade well, ❤️
ForecastCity English Support Team ❤️

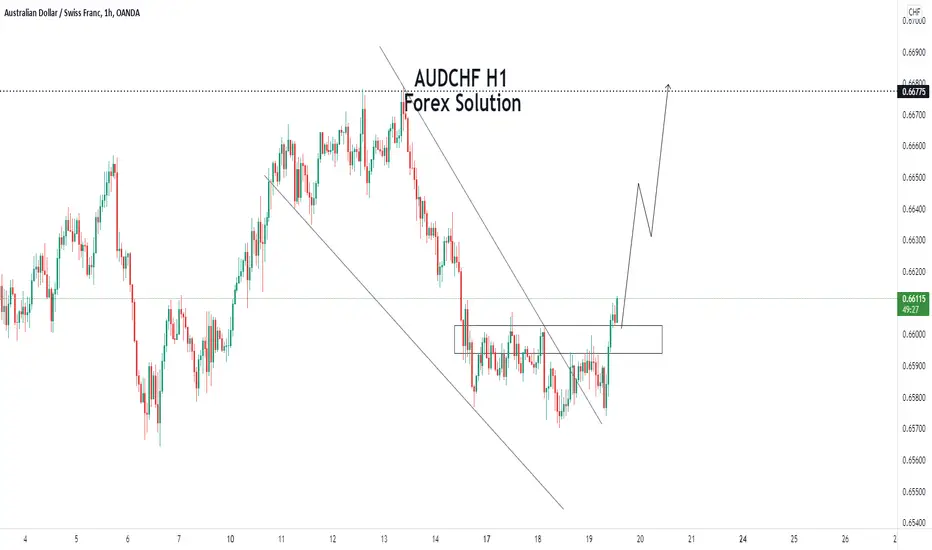
AUDCHFAUDCHF M30 - an idea ✅
Buy!
E: 0,66120
Tp: 0,66720 ( 60 pips )
Sl: 0,65900 ( 22 pips )
RRR: 1 : 2,72

AUDCHF LongAUDCHF is shifted insede a channel buy
entry - 0,65776
stoploss- 0.65511
take profit -067079
goodluck

Buy AUDCHF And Take Profit At 0.67467as we can see there is an inverted head and shoulders, the price respected the fibo level 61.8, you can buy now, for low risk set take profit below fibo level 161.8

AUDCHF SHORTS 📉📉📉Expecting short entries on this area as price closed bearish imbalance on m30 and rejected a bearish orderblock on M30, also price took out liquidity above trendline that means market is due for a selloff.
What do you think ? Comment below..

AUDCHF SHORTS 📉📉📉Price should start the selloff from this area as liquidity has been taken above 0.66000 where a lot of stops resided. Rejected a nice orderblock bearish h4 area ( resistance) and confirmed with a strong bearish momentum, we have as well a trendline liquidity area where a of traders put their stops and price should go there, i target 4-5R on this trade.
What do you think ? Comment below..

AUDCHF Price action..Good Morning, afternoon and evening traders! Don't forget to follow me after reading my post if you want more expert analysis daily.
Here we have our AUDCHF chart.
This particular chart shows us a key lesson in trading. Price action..
We often want to see price action like this as it shows us the strong beginning of a trend and the rejection of a particular price zone.
This is just an extra indication of the strength of a buy zone.

audchfWe see that the rebound will be from here, we expect the strength of the Australian dollar and the weakness of the franc, stay safe

SUPPLY AND DEMAND - AUDCHFW1 TF - Long Bias
D1 Direction
Reacting off D1 Demand already
H4 Intermediate
Wait for price to break H4 supply before looking for BUYS

AUDCHF long opportunityHi fellow traders, AUDCHF looks to have completed the expanding flat pattern. If we break below the red line the trade will be invalidated. Goodluck!

AUDCHF be prepared..Don't forget to click on the follow button for more expert daily analysis,
Here we have our AUDCHF chart.
This pair has seen a huge drop over the last 7 trading days, taking us far away from key MA's and into oversold territory.
Price is now incredibly low for this period and therefore we are accumulating long positions for a gradual move up.
Price direction is indicated by our price arrows.

audchfaudchf can touch TP1: 0.68993 then TP2: 0.71500. wait for the minor trendline to break as trigger.
