AUDCHF BUY R:R 1.9 Hi Guys,
Looking at this chart and i found that there were a few things that supported my idea:
1. Support at 0.7245 and reversal has begun at the 4H TF
2. Previous support at 0.7146 was never achieved
3. RSI supports the upward trend
I would expect a retracement period at 0.7430 (0.38 Fib) so you can take some profit here
But my main target would be:
T/P at 0.7605 (0.618 Fib)
S/L at 0.7210
R:R at 1.9
Please don't risk more than 2% of your capital
If there's no big news, this trade would look quite good
Feedbacks are always appreciated
Cheers!
Audchflong


AUDCHF BULLISH WEEK COMING 200 PIPS EXPECTED ON THIS PAIR FOR THE WEEK, ITS SHOWING DIVERGENCE ON A FUNNEL N A WEEKLY TL.. CONFLUENCE SIGNALING A BULLISH BREAKOUT COMING 500 PIP POTENTIAL


AUDCHF - Dual Pattern Completion on H4 ChartA bat and butterfly pattern has completed and reacted slightly last Friday.
Price has pulled back to PRZ, a good time to long again.
I will not be awake to when the market opens, traders who are awake can take note of this setup.
Price seems well supported at the 0.755 to 0.757 area.
R:R based on bat pattern at 1.2 (TP1) and 2.2 (TP2).
Good luck.

AUDCHF - Potential Butterfly Pattern on H1 ChartA bullish butterfly pattern seems to be completing.
Price almost hit all points of PRZ previously, I'm hoping to see the pattern complete.
Nice R:R at 2 (TP1) and 2.8 (TP2).
Good luck.

AUD/CHF long setupAUD/CHF has opened trade with a bullish gap up in the Asian session as markets open after holidays.
The pair is hovering around major trendline resistance at 0.7635, breakout to see further upside.
Technical studies support upside in the pair, price action has broken above daily cloud.
RSI shows strength above 50 levels and is gaining traction. Momentum studies bullish.
ADX and MACD also support upside in the pair.
Support levels - 0.7604 (100-DMA), 0.7596 (5-DMA), 0.7570 (50-DMA)
Resistance levels - 0.7651 (61.8% Fib retracement of 0.78 to 0.7417 fall), 0.77, 0.7715 (78.6% Fib)
Stay long on close above 0.7635, SL: 0.76, TP: 0.77/ 0.7715

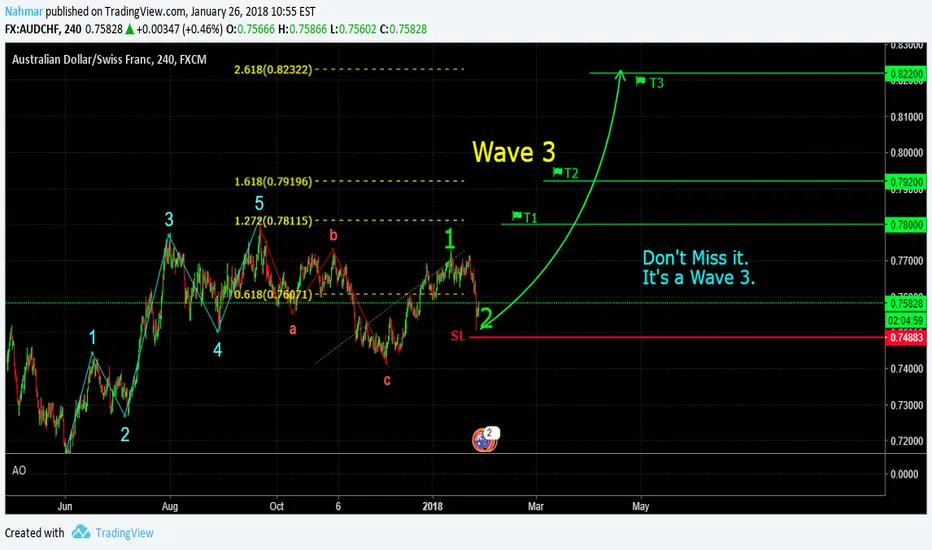
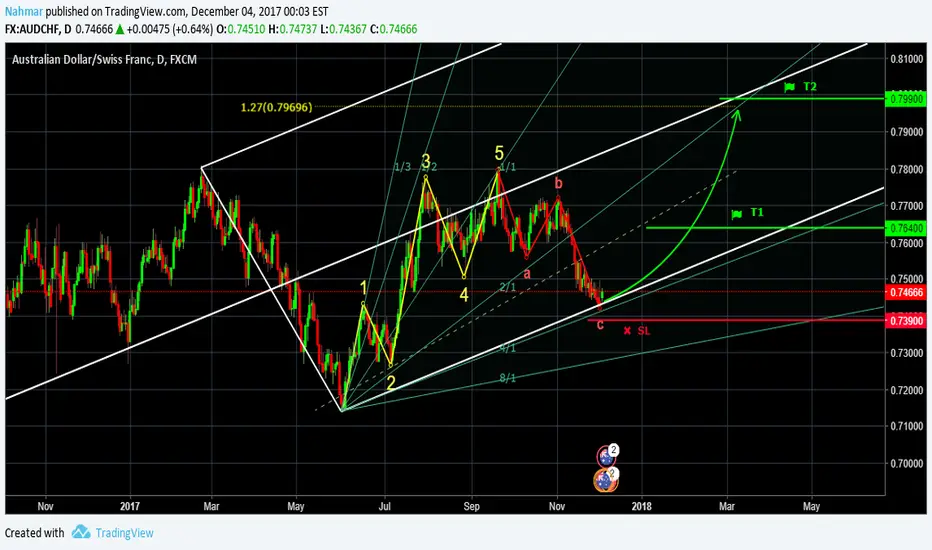
AUDCHF, Elliott Wave, Pitchfork & Gann Fan.Previous trade reached stop, but I think A new impulse wave is Beginning.
AUD/CHF - 100 Pips Long Opportunity - Bullish ContinuationAUD/CHF seems to be in a bullish continuation pattern. If the current support holds we can expect it to go further higher up about 100 pips.
The more you wait for the confirmation before entering, the less unprofitable positions you will get into.
Happy trading!


AUD/CHF 200-DMA breakout, stay long Technical Studies: Bias Bullish
- 200-DMA breakout
- Tests 50-DMA resistance at 0.7574
- RSI and Stochs biased higher, RSI above 50 gaining traction
- Bullish 5 and 20 DMA crossover
- Bollinger bands widening
Fundamental Studies:
- Aussie continues to be supported higher, extends gains across the board on strong Aussie jobs data.
- The ABS reported earlier today that the Australian economy added 61.6K jobs in November, beating consensus at 18K.
- Full-time employment stood at 41.9k (prior 24.7k), while part-time employment 19.7k (prior -20.3k), while the participation rate ticked higher to 65.5 percent from 65.1 percent.
- On Wednesday, Australia consumer confidence surprised to the upside.
- The Westpac Melbourne Institute Index of Consumer Sentiment up 3.6% to 103.3 in December from 99.7 in November.
- CHF extends weakness after SNB has kept its interest rates unchanged in its quarterly interest rate setting decision.
Support levels - 0.7562 (38.2% Fib retrace of 0.77966 to 0.7417 fall), 0.7527 (200-DMA), 0.7506 (23.6% Fib)
Resistance levels - 0.7574 (50-DMA), 0.7606 (50% Fib), 0.7650 (trendline)
Good to go long on breakout at 50-DMA, SL: 0.7530, TP: 0.76/ 0.7650

AUDCHF, Correction is over soonHi there,
the flat on the 15M will be completed in a few hours, giving us another impulse up. I will be waiting patiently for this trade.
MisterRay

AUDCHF - waiting to open longsAUDCHF - On the H4 chart we can see, that after today’s gains price is above bullish Kumo cloud. If current cloud will close above this zone, it will be a signal to open long position. In addition, Tenkan-sen just crossed above Kijun. The target for gains is on the another resistance in 0.7575 area.

AUDCHF Buy SetupLooking to buy AUDCHF as soon as it breaks the downwards channel it is currently in.
Expecting a move up above 0.7500, then bounce on the 0.7500 handle before next move up.


AUDCHF 16h Demand - Covered by high quality weekly DemandAll Trade Parameters shown on the chart. We face a level on top of level scenario. In order to have a higher risk : reward ratio we will only trade the lower demand level. Both levels can be combined as well, however stop loss has to be below lower level.


AUDCHF long in progress.Got into this earlier in the week. Note the large Bullish candle breaking and closing above the significant resistance, and then a smaller Bullish engulfing rejecting the other side of this level as support. Reward, as always, is 2 to 1.
