AUD/JPY Chart AnalysisAUD/JPY Chart Analysis
**Key Patterns Identified:**
1. **Rectangle Pattern (Range-bound Market)**
- The price traded within a horizontal range, forming a consolidation zone.
- Two clear support touches at the bottom of the range (labeled as Bottom 1 and Bottom 2).
- The price respected both support and resistance levels multiple times before breaking out.
2. **Double Bottom Formation**
- A classic reversal pattern, signaling potential bullish momentum.
- Bottom 1 and Bottom 2 indicate strong support, where buyers stepped in.
- The breakout above the rectangle confirms the pattern, suggesting further upside potential.
**Breakout Confirmation:**
- The price successfully **broke out** above the rectangle's resistance.
- Volume increased during the breakout, supporting bullish momentum.
- Moving Averages (EMA 7, 21, and 50) are aligned bullishly, confirming the uptrend.
**Target Projection:**
- The expected target is measured based on the rectangle’s height.
- The breakout suggests a potential move towards **97.00** as the next resistance zone.
**Key Levels to Watch:**
- **Support:** 94.50 (previous range support), 95.00 (psychological level).
- **Resistance:** 96.00 (current price zone), 97.00 (breakout target).
**Conclusion:**
- **Bullish Bias:** Price action and technical indicators favor more upside.
- **Watch for Retests:** A pullback to the breakout zone (around 95.00) could offer buying opportunities.
- **Risk Management:** If price re-enters the rectangle, the breakout may fail, requiring reassessment.
AUDJPY

Sentiment Extreme on the Yen Could Bode Well for Commodity FXI take a closer look at the Japanese yen futures market to highlight why I think the Japanese yen has reached an important inflection point. And that could further support the bounce of yen pairs such as AUD/JPY, CAD/JPY and NZD/JPY - alongside USD/JPY should the Fed not be as dovish as many hope.
Matt Simpson, Market Analyst at City index and Forex.com

Bearish reversal?AUD/JPY is rising towards the pivot which is a pullback resistance and could drop to the 1st support which is a pullback support.
Pivot: 95.54
1st Support: 93.95
1st Resistance: 96.26
Risk Warning:
Trading Forex and CFDs carries a high level of risk to your capital and you should only trade with money you can afford to lose. Trading Forex and CFDs may not be suitable for all investors, so please ensure that you fully understand the risks involved and seek independent advice if necessary.
Disclaimer:
The above opinions given constitute general market commentary, and do not constitute the opinion or advice of IC Markets or any form of personal or investment advice.
Any opinions, news, research, analyses, prices, other information, or links to third-party sites contained on this website are provided on an "as-is" basis, are intended only to be informative, is not an advice nor a recommendation, nor research, or a record of our trading prices, or an offer of, or solicitation for a transaction in any financial instrument and thus should not be treated as such. The information provided does not involve any specific investment objectives, financial situation and needs of any specific person who may receive it. Please be aware, that past performance is not a reliable indicator of future performance and/or results. Past Performance or Forward-looking scenarios based upon the reasonable beliefs of the third-party provider are not a guarantee of future performance. Actual results may differ materially from those anticipated in forward-looking or past performance statements. IC Markets makes no representation or warranty and assumes no liability as to the accuracy or completeness of the information provided, nor any loss arising from any investment based on a recommendation, forecast or any information supplied by any third-party.

AUDJPY INTRADAY capped by resistance at 94.70Key Trading Level: 94.70
Bearish Scenario:
The overall sentiment remains bearish, aligned with the longer-term prevailing downtrend. Recent price action suggests a sideways consolidation, indicating potential continuation of the downtrend. A bearish rejection from 94.70 could reinforce selling pressure, targeting 92.33 as the first support level, with further downside extending toward 91.18 and 89.60 if bearish momentum strengthens.
Bullish Scenario:
A confirmed breakout above 94.70 and a daily close higher would invalidate the bearish outlook, signaling a potential shift in momentum. If buyers gain control, the next upside targets would be 95.56, followed by 96.60, where further resistance may emerge.
Conclusion:
The 94.70 level is a key pivot point in determining AUDJPY’s next directional move. A rejection at this level would reinforce the bearish outlook, while a breakout higher could indicate a potential trend reversal. Traders should monitor price action around 94.70 for confirmation of the next move.
This communication is for informational purposes only and should not be viewed as any form of recommendation as to a particular course of action or as investment advice. It is not intended as an offer or solicitation for the purchase or sale of any financial instrument or as an official confirmation of any transaction. Opinions, estimates and assumptions expressed herein are made as of the date of this communication and are subject to change without notice. This communication has been prepared based upon information, including market prices, data and other information, believed to be reliable; however, Trade Nation does not warrant its completeness or accuracy. All market prices and market data contained in or attached to this communication are indicative and subject to change without notice.

AUDJPY Buyers In Panic! SELL!
My dear friends,
Please, find my technical outlook for AUDJPY below:
The instrument tests an important psychological level 94.592
Bias - Bearish
Technical Indicators: Supper Trend gives a precise Bearish signal, while Pivot Point HL predicts price changes and potential reversals in the market.
Target - 93.776
About Used Indicators:
Super-trend indicator is more useful in trending markets where there are clear uptrends and downtrends in price.
———————————
WISH YOU ALL LUCK

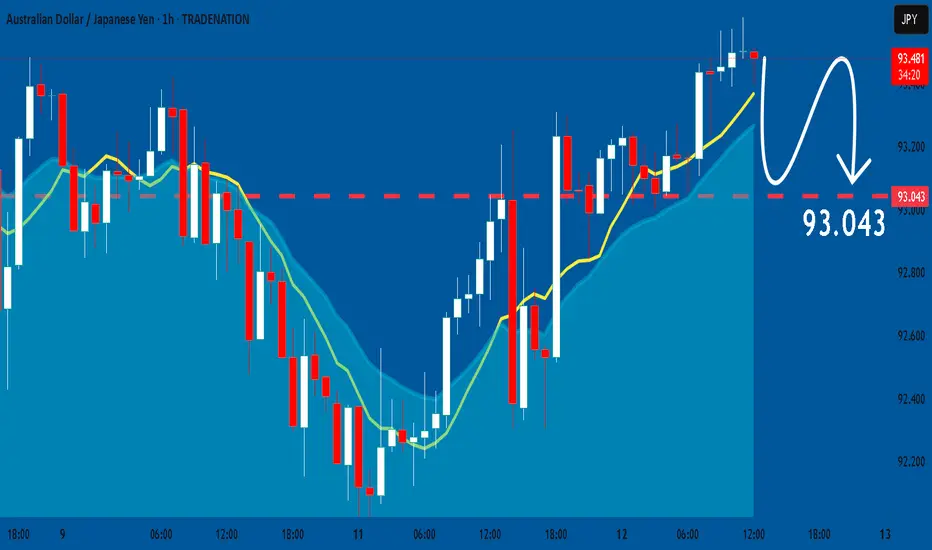
AUDJPY Will Go Down! Sell!
Please, check our technical outlook for AUDJPY.
Time Frame: 1h
Current Trend: Bearish
Sentiment: Overbought (based on 7-period RSI)
Forecast: Bearish
The price is testing a key resistance 94.552.
Taking into consideration the current market trend & overbought RSI, chances will be high to see a bearish movement to the downside at least to 94.086 level.
P.S
Overbought describes a period of time where there has been a significant and consistent upward move in price over a period of time without much pullback.
Disclosure: I am part of Trade Nation's Influencer program and receive a monthly fee for using their TradingView charts in my analysis.
Like and subscribe and comment my ideas if you enjoy them!

AUD_JPY RESISTANCE AHEAD|SHORT|
✅AUD_JPY is going up now
But a strong resistance level is ahead at 94.800
Thus I am expecting a pullback
And a move down towards the target at 94.093
SHORT🔥
✅Like and subscribe to never miss a new idea!✅

AUDJPY The Teek Ahead 17th March ‘25Key Trading Level: 94.70
Bearish Scenario:
The overall sentiment remains bearish, aligned with the longer-term prevailing downtrend. Recent price action suggests a sideways consolidation, indicating potential continuation of the downtrend. A bearish rejection from 94.70 could reinforce selling pressure, targeting 92.33 as the first support level, with further downside extending toward 91.18 and 89.60 if bearish momentum strengthens.
Bullish Scenario:
A confirmed breakout above 94.70 and a daily close higher would invalidate the bearish outlook, signaling a potential shift in momentum. If buyers gain control, the next upside targets would be 95.56, followed by 96.60, where further resistance may emerge.
Conclusion:
The 94.70 level is a key pivot point in determining AUDJPY’s next directional move. A rejection at this level would reinforce the bearish outlook, while a breakout higher could indicate a potential trend reversal. Traders should monitor price action around 94.70 for confirmation of the next move.
This communication is for informational purposes only and should not be viewed as any form of recommendation as to a particular course of action or as investment advice. It is not intended as an offer or solicitation for the purchase or sale of any financial instrument or as an official confirmation of any transaction. Opinions, estimates and assumptions expressed herein are made as of the date of this communication and are subject to change without notice. This communication has been prepared based upon information, including market prices, data and other information, believed to be reliable; however, Trade Nation does not warrant its completeness or accuracy. All market prices and market data contained in or attached to this communication are indicative and subject to change without notice.

AUD/JPY BEARS WILL DOMINATE THE MARKET|SHORT
Hello, Friends!
AUD/JPY pair is trading in a local downtrend which know by looking at the previous 1W candle which is red. On the 2H timeframe the pair is going up. The pair is overbought because the price is close to the upper band of the BB indicator. So we are looking to sell the pair with the upper BB line acting as resistance. The next target is 93.209 area.
Disclosure: I am part of Trade Nation's Influencer program and receive a monthly fee for using their TradingView charts in my analysis.
✅LIKE AND COMMENT MY IDEAS✅

AUDJPY INTRADAY Oversold bounce back capped at 94.68Key Trading Level: 94.70
Bearish Scenario:
The overall sentiment remains bearish, aligned with the longer-term prevailing downtrend. Recent price action suggests a sideways consolidation, indicating potential continuation of the downtrend. A bearish rejection from 94.70 could reinforce selling pressure, targeting 92.33 as the first support level, with further downside extending toward 91.18 and 89.60 if bearish momentum strengthens.
Bullish Scenario:
A confirmed breakout above 94.70 and a daily close higher would invalidate the bearish outlook, signaling a potential shift in momentum. If buyers gain control, the next upside targets would be 95.56, followed by 96.60, where further resistance may emerge.
Conclusion:
The 94.70 level is a key pivot point in determining AUDJPY’s next directional move. A rejection at this level would reinforce the bearish outlook, while a breakout higher could indicate a potential trend reversal. Traders should monitor price action around 94.70 for confirmation of the next move.
This communication is for informational purposes only and should not be viewed as any form of recommendation as to a particular course of action or as investment advice. It is not intended as an offer or solicitation for the purchase or sale of any financial instrument or as an official confirmation of any transaction. Opinions, estimates and assumptions expressed herein are made as of the date of this communication and are subject to change without notice. This communication has been prepared based upon information, including market prices, data and other information, believed to be reliable; however, Trade Nation does not warrant its completeness or accuracy. All market prices and market data contained in or attached to this communication are indicative and subject to change without notice.

AUDJPY: HIGH RISK, HIGH REWARD🏆 Trade Setup & Recommendation
📉 BEARISH SCENARIO (Primary Bias)
Sell Zone: 94.50 - 95.50 (retest of resistance)
Entry Confirmation: Bearish rejection candle near resistance
Targets:
TP1: 93.47 ✅
TP2: 92.99 ✅
TP3: 91.82 🎯
Stop Loss: Above 96.00 (invalidates bearish setup)
📈 BULLISH SCENARIO (Alternative Setup)
Buy Zone: 91.82 - 92.50 (if support holds)
Entry Confirmation: Bullish engulfing candle, RSI > 45
Targets:
TP1: 94.00 🏁
TP2: 95.50 🏁
Stop Loss: Below 91.50 (breaks key support)
📌 Final Thoughts
🔴 Dominant Trend: Bearish
🔴 Indicators: MAs confirm selling pressure, Oscillators neutral
🔴 Watch for retracement to resistance for shorting opportunities
🟢 If 91.82 holds, a bounce to 94+ is possible
🚨 Trade Smart – Use Stop Losses & Manage Risk Properly! 🚨

audjpy buy signal. Don't forget about stop-loss.
Write in the comments all your questions and instruments analysis of which you want to see.
Friends, push the like button, write a comment, and share with your mates - that would be the best THANK YOU.
P.S. I personally will open entry if the price will show it according to my strategy.
Always make your analysis before a trade

AUDJPY: Market of Sellers
Balance of buyers and sellers on the AUDJPY pair, that is best felt when all the timeframes are analyzed properly is shifting in favor of the sellers, therefore is it only natural that we go short on the pair.
Disclosure: I am part of Trade Nation's Influencer program and receive a monthly fee for using their TradingView charts in my analysis.
❤️ Please, support our work with like & comment! ❤️
AUDJPY The Target Is UP! BUY!
My dear friends,
My technical analysis for AUDJPY is below:
The market is trading on 92.761 pivot level.
Bias - Bullish
Technical Indicators: Both Super Trend & Pivot HL indicate a highly probable Bullish continuation.
Target - 93.288
About Used Indicators:
A pivot point is a technical analysis indicator, or calculations, used to determine the overall trend of the market over different time frames.
———————————
WISH YOU ALL LUCK

AUD/JPY BEARS ARE GAINING STRENGTH|SHORT
Hello, Friends!
AUD/JPY pair is trading in a local downtrend which know by looking at the previous 1W candle which is red. On the 1H timeframe the pair is going up. The pair is overbought because the price is close to the upper band of the BB indicator. So we are looking to sell the pair with the upper BB line acting as resistance. The next target is 92.334 area.
✅LIKE AND COMMENT MY IDEAS✅

AUDJPY - Growing SHORTS! Big Move Ahead!In one of our last AUDJPY analysis, we indicated that price looked foppish. Since then, we've had almost a 2000pip drop!
That big drop can be marked as wave 1 in our new bearish impulsive trend.
We are now in Wave 2, which is an ABC correction. We have completed Wave A (3 waves). We are now in Wave B (3 waves). We're currently in subwave b of wave B. Expecting subwave c to appear very soon.
Trade Idea:
- Watch for bearish price action on lower timeframe
- You can use trendline break, fibs or BOS to find the reversal point
- When entered, put stops above subwave B.
- Target: 91 (750pips)
4Week Chart
Goodluck and as always, trade safe!
See our previous setups below:

AUDJPY The Week Ahead 10th March ‘25. Key Trading Level: 94.70
Bearish Scenario:
The overall sentiment remains bearish, aligned with the longer-term prevailing downtrend. Recent price action suggests a sideways consolidation, indicating potential continuation of the downtrend. A bearish rejection from 94.70 could reinforce selling pressure, targeting 92.33 as the first support level, with further downside extending toward 91.18 and 89.60 if bearish momentum strengthens.
Bullish Scenario:
A confirmed breakout above 94.70 and a daily close higher would invalidate the bearish outlook, signaling a potential shift in momentum. If buyers gain control, the next upside targets would be 95.56, followed by 96.60, where further resistance may emerge.
Conclusion:
The 94.70 level is a key pivot point in determining AUDJPY’s next directional move. A rejection at this level would reinforce the bearish outlook, while a breakout higher could indicate a potential trend reversal. Traders should monitor price action around 94.70 for confirmation of the next move.
This communication is for informational purposes only and should not be viewed as any form of recommendation as to a particular course of action or as investment advice. It is not intended as an offer or solicitation for the purchase or sale of any financial instrument or as an official confirmation of any transaction. Opinions, estimates and assumptions expressed herein are made as of the date of this communication and are subject to change without notice. This communication has been prepared based upon information, including market prices, data and other information, believed to be reliable; however, Trade Nation does not warrant its completeness or accuracy. All market prices and market data contained in or attached to this communication are indicative and subject to change without notice.

AUDJPY BEARISHMy various forms of analysis, which always include a quantitative outlook, indicate that the bearish momentum should continue up to the marked price. This outlook is for the long term.

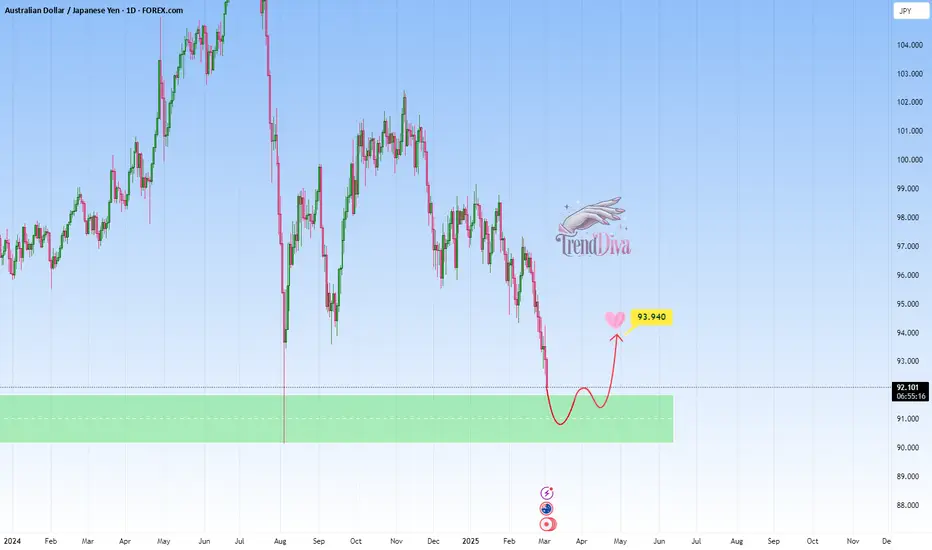
AUDJPY Approaching Key Support - Will Price Rebound to 93.940?OANDA:AUDJPY is approaching a key support level, an area where buyers have previously shown strong interest. The recent bearish movement suggests that price may soon be testing this level, potentially setting up for a rebound.
A bullish confirmation, such as a strong rejection pattern, bullish engulfing candles, or long lower wicks, would strengthen the case for a move higher. If buyers step in, the price could rally toward 93.940, aligning with the next key resistance level.
However, a decisive breakdown below this support would invalidate the bullish scenario and could lead to further downside.
This is not financial advice but rather how I approach support/resistance zones. Remember, always wait for confirmation, like a rejection candle or volume spike before jumping in.
Best of luck, TrendDiva.
AUDJPY Capped by resistance at 94.70Key Trading Level: 94.70
Bearish Scenario:
The overall sentiment remains bearish, aligned with the longer-term prevailing downtrend. Recent price action suggests a sideways consolidation, indicating potential continuation of the downtrend. A bearish rejection from 94.70 could reinforce selling pressure, targeting 92.33 as the first support level, with further downside extending toward 91.18 and 89.60 if bearish momentum strengthens.
Bullish Scenario:
A confirmed breakout above 94.70 and a daily close higher would invalidate the bearish outlook, signaling a potential shift in momentum. If buyers gain control, the next upside targets would be 95.56, followed by 96.60, where further resistance may emerge.
Conclusion:
The 94.70 level is a key pivot point in determining AUDJPY’s next directional move. A rejection at this level would reinforce the bearish outlook, while a breakout higher could indicate a potential trend reversal. Traders should monitor price action around 94.70 for confirmation of the next move.
This communication is for informational purposes only and should not be viewed as any form of recommendation as to a particular course of action or as investment advice. It is not intended as an offer or solicitation for the purchase or sale of any financial instrument or as an official confirmation of any transaction. Opinions, estimates and assumptions expressed herein are made as of the date of this communication and are subject to change without notice. This communication has been prepared based upon information, including market prices, data and other information, believed to be reliable; however, Trade Nation does not warrant its completeness or accuracy. All market prices and market data contained in or attached to this communication are indicative and subject to change without notice.

Could the price rise from here?AUD/JPY is reacting off the pivot which has been identified as a pullback support and could rise to the 1st resistance which is an overlap resistance.
Pivot: 94.11
1st Support: 92.82
1st Resistance: 95.29
Risk Warning:
Trading Forex and CFDs carries a high level of risk to your capital and you should only trade with money you can afford to lose. Trading Forex and CFDs may not be suitable for all investors, so please ensure that you fully understand the risks involved and seek independent advice if necessary.
Disclaimer:
The above opinions given constitute general market commentary, and do not constitute the opinion or advice of IC Markets or any form of personal or investment advice.
Any opinions, news, research, analyses, prices, other information, or links to third-party sites contained on this website are provided on an "as-is" basis, are intended only to be informative, is not an advice nor a recommendation, nor research, or a record of our trading prices, or an offer of, or solicitation for a transaction in any financial instrument and thus should not be treated as such. The information provided does not involve any specific investment objectives, financial situation and needs of any specific person who may receive it. Please be aware, that past performance is not a reliable indicator of future performance and/or results. Past Performance or Forward-looking scenarios based upon the reasonable beliefs of the third-party provider are not a guarantee of future performance. Actual results may differ materially from those anticipated in forward-looking or past performance statements. IC Markets makes no representation or warranty and assumes no liability as to the accuracy or completeness of the information provided, nor any loss arising from any investment based on a recommendation, forecast or any information supplied by any third-party.

AUDJPY downtrend continuation The AUDJPY currency pair maintains a bearish sentiment, supported by a longer-term downtrend. Price action remains pressured, with a key swing low acting as an immediate resistance level. However, potential upside corrections could test key resistance areas before determining the next directional move.
Key Levels to Watch
Resistance Levels: 94.50, 95.50 (20 DMA), 96.80 (50 DMA)
Support Levels: 92.70, 91.40, 90.20
Bearish Scenario
If AUDJPY fails to break above the 94.50 resistance level, a renewed bearish rejection could trigger further downside momentum. A sustained move lower could expose key support levels at 92.70, followed by 91.40 and 90.20 over the longer timeframe. Given the prevailing downtrend, sellers may look for shorting opportunities on rallies toward resistance.
Bullish Scenario
A decisive breakout above 94.50, confirmed by a daily close, would weaken the bearish outlook and signal a potential reversal. If this occurs, AUDJPY could rally toward the next resistance at 95.50 (20 DMA), with further bullish momentum potentially extending toward 96.80 (50 DMA).
Conclusion
While AUDJPY remains in a broader downtrend, the 94.50 level is a crucial pivot point that will determine the next move. A rejection from this level would reaffirm bearish dominance, whereas a breakout above it could signal a shift toward a corrective bullish phase. Traders should monitor price action around key levels for confirmation before positioning.
This communication is for informational purposes only and should not be viewed as any form of recommendation as to a particular course of action or as investment advice. It is not intended as an offer or solicitation for the purchase or sale of any financial instrument or as an official confirmation of any transaction. Opinions, estimates and assumptions expressed herein are made as of the date of this communication and are subject to change without notice. This communication has been prepared based upon information, including market prices, data and other information, believed to be reliable; however, Trade Nation does not warrant its completeness or accuracy. All market prices and market data contained in or attached to this communication are indicative and subject to change without notice.

AUDJPY Key Levels, The Week Ahead 03rd March ‘25 The AUDJPY currency pair maintains a bearish sentiment, supported by a longer-term downtrend. Price action remains pressured, with a key swing low acting as an immediate resistance level. However, potential upside corrections could test key resistance areas before determining the next directional move.
Key Levels to Watch
Resistance Levels: 94.50, 95.50 (20 DMA), 96.80 (50 DMA)
Support Levels: 92.70, 91.40, 90.20
Bearish Scenario
If AUDJPY fails to break above the 94.50 resistance level, a renewed bearish rejection could trigger further downside momentum. A sustained move lower could expose key support levels at 92.70, followed by 91.40 and 90.20 over the longer timeframe. Given the prevailing downtrend, sellers may look for shorting opportunities on rallies toward resistance.
Bullish Scenario
A decisive breakout above 94.50, confirmed by a daily close, would weaken the bearish outlook and signal a potential reversal. If this occurs, AUDJPY could rally toward the next resistance at 95.50 (20 DMA), with further bullish momentum potentially extending toward 96.80 (50 DMA).
Conclusion
While AUDJPY remains in a broader downtrend, the 94.50 level is a crucial pivot point that will determine the next move. A rejection from this level would reaffirm bearish dominance, whereas a breakout above it could signal a shift toward a corrective bullish phase. Traders should monitor price action around key levels for confirmation before positioning.
This communication is for informational purposes only and should not be viewed as any form of recommendation as to a particular course of action or as investment advice. It is not intended as an offer or solicitation for the purchase or sale of any financial instrument or as an official confirmation of any transaction. Opinions, estimates and assumptions expressed herein are made as of the date of this communication and are subject to change without notice. This communication has been prepared based upon information, including market prices, data and other information, believed to be reliable; however, Trade Nation does not warrant its completeness or accuracy. All market prices and market data contained in or attached to this communication are indicative and subject to change without notice.
