AUD/JPY VS NZD/JPYWe had a support and big candle down then went up real aggressive making new structure. i am taking the trade that gets back to my zone last out of AUD/JPY and NZD/JPY
AUDJPY

AUD/JPY At a Breaking Point – Big Move Loading!AUD/JPY is sitting at a crucial level right now. We're seeing a descending triangle pattern forming, with price getting squeezed between lower highs and key support around the 200 EMA (94.64).
A breakdown below this level could trigger a sharp drop, with targets around 90 and possibly 85-87 in the coming weeks. The bearish momentum is building, and today's red candle isn't looking too promising for bulls.
On the flip side, if buyers step in and push it back above 97.50, we might see a recovery towards the 100 level. But for now, the bias leans bearish unless we get a strong reversal signal.
Keep an eye on that 94 level – a breakdown could mean more downside ahead. 🔻

AUDJPY: 2 month range calls for a reboundAUDJPY is neutral on its 1D technical outlook (RSI = 45.920, MACD = -0.220, ADX = 20.692) as it is trading inside a Rectangle pattern. The price hit the pattern's bottom yesterday and today is rebounding towards the 4H MA50, already hitting the 0.382 Fibonacci retracement level. Such rebounds have always reached the 0.786 Fib at least, so with the 4H RSI also rebounding perfectly from the oversold area, we expect to test the 0.786 Fib again (TP = 98.385).
## If you like our free content follow our profile to get more daily ideas. ##
## Comments and likes are greatly appreciated. ##

AUDJPY: Long Trading Opportunity
AUDJPY
- Classic bullish formation
- Our team expects pullback
SUGGESTED TRADE:
Swing Trade
Long AUDJPY
Entry - 96.087
Sl - 95.573
Tp - 97.091
Our Risk - 1%
Start protection of your profits from lower levels
❤️ Please, support our work with like & comment! ❤️

AUDJPYHello Friends!
I’ve entered a long position on AUDJPY at 95.890. Expecting a small pullback to 95.948, which looks like a nice level to bounce from. After that, I’m looking for the pair to head up toward the Fibonacci Pivot point at 97.968, where there's also an imbalance, making it a key target. This setup looks solid with good technical backing, and I’m feeling optimistic about the potential move!
Peace out! :)

Potential bearish drop?AUD/JPY is rising towards the pivot and could drop to the 1st support.
Pivot: 96.78
1st Support: 95.71
1st Resistance: 97.49
Risk Warning:
Trading Forex and CFDs carries a high level of risk to your capital and you should only trade with money you can afford to lose. Trading Forex and CFDs may not be suitable for all investors, so please ensure that you fully understand the risks involved and seek independent advice if necessary.
Disclaimer:
The above opinions given constitute general market commentary, and do not constitute the opinion or advice of IC Markets or any form of personal or investment advice.
Any opinions, news, research, analyses, prices, other information, or links to third-party sites contained on this website are provided on an "as-is" basis, are intended only to be informative, is not an advice nor a recommendation, nor research, or a record of our trading prices, or an offer of, or solicitation for a transaction in any financial instrument and thus should not be treated as such. The information provided does not involve any specific investment objectives, financial situation and needs of any specific person who may receive it. Please be aware, that past performance is not a reliable indicator of future performance and/or results. Past Performance or Forward-looking scenarios based upon the reasonable beliefs of the third-party provider are not a guarantee of future performance. Actual results may differ materially from those anticipated in forward-looking or past performance statements. IC Markets makes no representation or warranty and assumes no liability as to the accuracy or completeness of the information provided, nor any loss arising from any investment based on a recommendation, forecast or any information supplied by any third-party.
ICmarkets
Following
Unfollow
IC Markets is an online forex broker specialized in providing transparent trading solutions to both retail and institutional investors alike. We provide superior execution technology, lower spreads and unrivaled liquidity.
Also on:

AUDJPY The Target Is UP! BUY!
My dear followers,
This is my opinion on the AUDJPY next move:
The asset is approaching an important pivot point 96.695
Bias - Bullish
Technical Indicators: Supper Trend generates a clear long signal while Pivot Point HL is currently determining the overall Bullish trend of the market.
Goal - 97.407
About Used Indicators:
For more efficient signals, super-trend is used in combination with other indicators like Pivot Points.
———————————
WISH YOU ALL LUCK

AUD/USD Resistance Rejection and Bearish OutlookAUD/USD represents the Australian Dollar against the US Dollar in the forex market. The current price is 0.62300, with a target price of 0.60000, indicating a bearish outlook. The expected price drop suggests a potential gain of 200+ pips if the trade moves as anticipated. The analysis is based on the support and resistance pattern, a key concept in technical trading. The price has reached a strong resistance level and is facing rejection, signaling selling pressure. A rejection at resistance often indicates a shift in momentum, leading to a possible downward move. Traders anticipate the price to decline toward the next support level at 0.60000. This setup suggests bearish dominance as long as resistance holds. If the price fails to break above resistance, further downside movement is likely. Proper risk management is crucial, as market conditions can change.

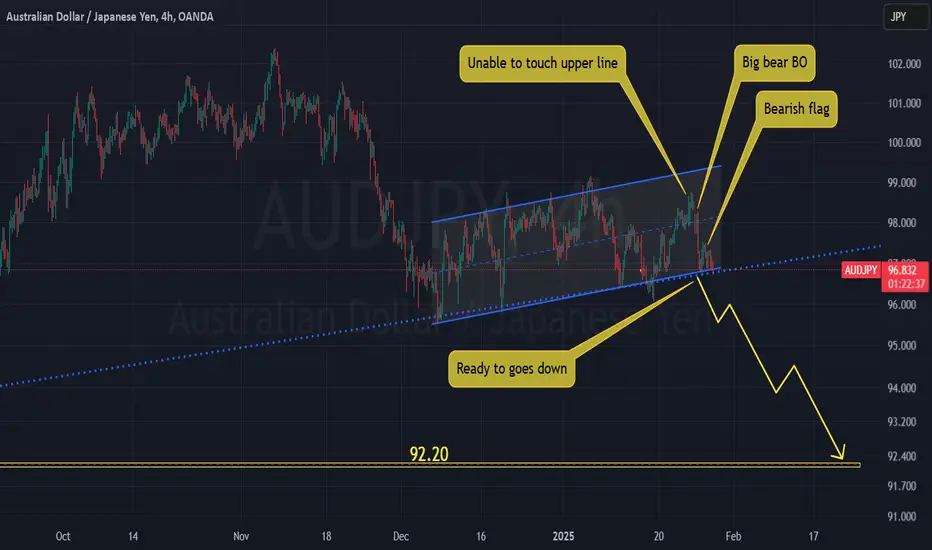
Aussie yen will weak again...After last week fake bear break out, Aussie is ready now to goes down.
Big bearish move after Aussie unable to touch upper line of the channel is good sign of bear control in Aussie yen pair.
trade safe
good luck.
AUDJPY Is Going Up! Buy!
Take a look at our analysis for AUDJPY.
Time Frame: 2h
Current Trend: Bullish
Sentiment: Oversold (based on 7-period RSI)
Forecast: Bullish
The market is trading around a solid horizontal structure 96.995.
The above observations make me that the market will inevitably achieve 97.514 level.
P.S
Please, note that an oversold/overbought condition can last for a long time, and therefore being oversold/overbought doesn't mean a price rally will come soon, or at all.
Like and subscribe and comment my ideas if you enjoy them!

Heading into 50% Fibonacci resistance?AUD/JPY is rising towards the resistance level which is an overlap resistance that aligns with the 50% Fibonacci retracement and could reverse from this level to our take profit.
Entry: 97.79
Why we like it:
There is an overlap resistance level that aligns with the 50% Fibonacci retracement.
Stop loss: 98.77
Why we like it:
There is a pullback resistance level.
Take profit: 96.63
Why we like it:
There is a pullback support level that aligns with the 78.6% Fibonacci retracement.
Enjoying your TradingView experience? Review us!
Please be advised that the information presented on TradingView is provided to Vantage (‘Vantage Global Limited’, ‘we’) by a third-party provider (‘Everest Fortune Group’). Please be reminded that you are solely responsible for the trading decisions on your account. There is a very high degree of risk involved in trading. Any information and/or content is intended entirely for research, educational and informational purposes only and does not constitute investment or consultation advice or investment strategy. The information is not tailored to the investment needs of any specific person and therefore does not involve a consideration of any of the investment objectives, financial situation or needs of any viewer that may receive it. Kindly also note that past performance is not a reliable indicator of future results. Actual results may differ materially from those anticipated in forward-looking or past performance statements. We assume no liability as to the accuracy or completeness of any of the information and/or content provided herein and the Company cannot be held responsible for any omission, mistake nor for any loss or damage including without limitation to any loss of profit which may arise from reliance on any information supplied by Everest Fortune Group.

AUDJPY: Will Keep Growing! Here is Why:
Balance of buyers and sellers on the AUDJPY pair, that is best felt when all the timeframes are analyzed properly is shifting in favor of the buyers, therefore is it only natural that we go long on the pair.
❤️ Please, support our work with like & comment! ❤️

BUY AUDJPYIn todays session we are monitoring a buy set up on AUDJPY. Our entry at 97.138 and targets at 98.337. Our stops below 96.600. Use proper risk management and best of luck.

AUD/JPY BUYERS WILL DOMINATE THE MARKET|LONG
Hello, Friends!
AUD/JPY is trending up which is evident from the green colour of the previous weekly candle. However, the price has locally plunged into the oversold territory. Which can be told from its proximity to the BB lower band. Which presents a beautiful trend following opportunity for a long trade from the support line below towards the supply level of 98.447.
✅LIKE AND COMMENT MY IDEAS✅

Key Resistance Level for AUDJPY: Towards 98.000?OANDA:AUDJPY is approaching a critical resistance level that has previously seen bearish reversals. The ongoing bullish momentum could provide an opportunity for sellers to step in and take control.
Key point: If we observe bearish signals such as rejection wicks at this resistance, the price could potentially drop towards 98.000. However, a breakout above this level would invalidate the bearish setup and shift the bias to a more bullish outlook.
It’s important to wait for clear rejection signals before considering any short positions. I'd love to hear your thoughts or different perspectives in the comments!

AUDJPY is Holding After Channel BreakoutHello Traders
In This Chart AUDJPY HOURLY Forex Forecast By FOREX PLANET
today AUDJPY analysis 👆
🟢This Chart includes_ (AUDJPY market update)
🟢What is The Next Opportunity on AUDJPY Market
🟢how to Enter to the Valid Entry With Assurance Profit
This CHART is For Trader's that Want to Improve Their Technical Analysis Skills and Their Trading By Understanding How To Analyze The Market Using Multiple Timeframes and Understanding The Bigger Picture on the Charts

AUD/JPY Reversal: Targeting 102.000 from 96.900
AUD/JPY has recently shown signs of exhaustion at lower levels, signaling a potential reversal from the 96.900 level. Here’s a detailed breakdown of why this setup presents an attractive trading opportunity:
Technical Analysis:
Key Support Zone:
The 96.900 level has proven to be a significant support area historically, as seen from previous price reactions. The pair has bounced strongly from this region multiple times, indicating the presence of strong buying interest.
Bollinger Bands:
The price is approaching the lower Bollinger Band on the daily timeframe, which often serves as a dynamic support level. This suggests a high likelihood of mean reversion toward the midline or upper band.
Fibonacci Levels:
Applying Fibonacci retracement from the recent swing low to the swing high reveals that 96.900 aligns closely with the 38.2% retracement level. This confluence strengthens the case for a reversal.
Trendline Analysis:
A rising trendline drawn from the March 2023 low intersects near 96.900. The trendline has been respected multiple times, indicating its significance.
Divergence on RSI:
On the 4-hour and daily charts, the RSI is showing bullish divergence, with the oscillator forming higher lows while the price forms lower lows. This often precedes a reversal in price.
Volume Profile:
A noticeable increase in volume near the 96.900 region suggests accumulation by institutional players, further reinforcing the support level's validity.
Fundamental Drivers:
Risk Sentiment:
The Australian Dollar, being a commodity-linked currency, is often influenced by global risk appetite. Any improvements in risk sentiment could boost AUD demand.
Japan's Monetary Policy:
The Bank of Japan’s commitment to its ultra-loose monetary policy may continue to pressure the Yen. This divergence in monetary policies between the RBA and BoJ supports a bullish bias for AUD/JPY.
Economic Indicators:
Strong economic data from Australia, particularly in the employment and commodity sectors, could act as a catalyst for further upside.
Target and Risk Management:
Entry Point:
Look for long positions near 96.900, ideally after a bullish confirmation (e.g., a pin bar or engulfing candle on the daily timeframe).
Take-Profit Levels:
First target: 98.500 (psychological level and minor resistance).
Final target: 102.000 (major resistance zone from previous highs).
Stop-Loss Placement:
A tight stop-loss below 96.400 ensures limited downside risk while providing an excellent risk-to-reward ratio.
Conclusion:
AUD/JPY is presenting a high-probability reversal opportunity from the 96.900 support zone. Both technical and fundamental factors align, making this trade idea particularly compelling. Monitor price action closely for confirmation before entering.

AUD-JPY Bullish Bias! Buy!
Hello,Traders!
AUD-JPY is trading in a
Local uptrend and the
Pair made a retest of the
Horizontal support of 97.830
And we are already seeing
A bullish rebound so we
Will be expecting a further
Bullish move up
Buy!
Comment and subscribe to help us grow!
Check out other forecasts below too!

AUDJPY My Opinion! BUY!
My dear friends,
AUDJPY looks like it will make a good move, and here are the details:
The market is trading on 96.801 pivot level.
Bias - Bullish
Technical Indicators: Supper Trend generates a clear long signal while Pivot Point HL is currently determining the overall Bullish trend of the market.
Goal - 97.463
Recommended Stop Loss - 96.413
About Used Indicators:
Pivot points are a great way to identify areas of support and resistance, but they work best when combined with other kinds of technical analysis
———————————
WISH YOU ALL LUCK

AUDJPY Will Go Down From Resistance! Short!
Here is our detailed technical review for AUDJPY.
Time Frame: 8h
Current Trend: Bearish
Sentiment: Overbought (based on 7-period RSI)
Forecast: Bearish
The market is approaching a key horizontal level 98.074.
Considering the today's price action, probabilities will be high to see a movement to 96.232.
P.S
Please, note that an oversold/overbought condition can last for a long time, and therefore being oversold/overbought doesn't mean a price rally will come soon, or at all.
Like and subscribe and comment my ideas if you enjoy them!

AUDJPY LongHello there,
pair AUDJPY has formed double bottom pattern , so for that reason i think pattern will continue to be completed, along with strong confirmation from falling peanut pattern.
Good luck !

AUDJPY: Bearish Continuation
It is essential that we apply multitimeframe technical analysis and there is no better example of why that is the case than the current AUDJPY chart which, if analyzed properly, clearly points in the downward direction.
❤️ Please, support our work with like & comment! ❤️

Potential bull flag breakout on AUD/JPYA potential bull flag on the 1-hour chart of AUD/JPY has caught my eye, and a closer look at volumes also suggests it worthy of consideration.
The weekly CVM (cumulative volume delta) has confirmed the recent rally into the bull flag pattern, but is also breakout out of its own flag to suggest bullish pressure is building. It is also near its own weekly high, a break above which provides another bullish clue.
Trading volumes were rising alongside prices before they entered the sideways consolidation (bull flag), so I am now on guard for a break higher of prices.
Bulls could seek dips towards the daily pivot point (97.32) for a move up to 97.80, just beneath the daily S1 pivot.
A break above 98 assumes bullish continuation up to 98.50 near a weekly VPOC (volume point of control).
Matt Simpson, Market Analyst at City Index and Forex.com
