AUD_JPY IS OVERBOUGHT|SHORT|
✅AUD_JPY is trading in a strong
Uptrend but the pair is now
Locally overbought so after the
Pair hits the horizontal resistance
Level of 97.350 we will be expecting
A pullback and a bearish correction
On Monday!
SHORT🔥
✅Like and subscribe to never miss a new idea!✅
Disclosure: I am part of Trade Nation's Influencer program and receive a monthly fee for using their TradingView charts in my analysis.
AUDJPY

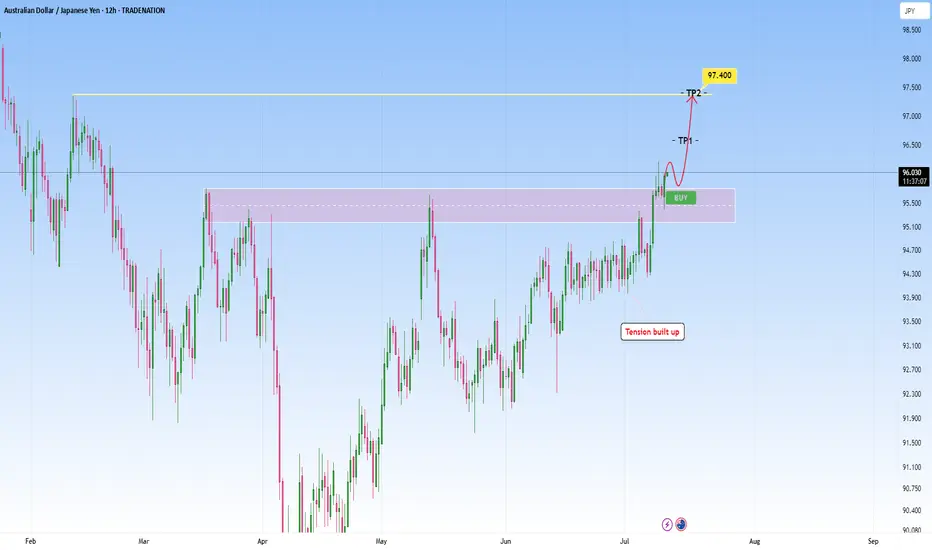
AUDJPY Technical Breakout - Targeting 97.400 Next?TRADENATION:AUDJPY has recently broken decisively above a key resistance zone that had previously capped price for several months. This breakout was preceded by a period of compression and range-bound price action, where bullish momentum steadily built up, indicated by higher lows pressing against the resistance level. This type of structure typically leads to an explosive breakout, which we are now seeing unfold.
After the breakout, price came back for a clean retest of the broken resistance zone, which has now flipped into support. The retest held firmly, suggesting strong buyer interest at this level and confirming the validity of the breakout.
With this structure in place, the bullish momentum is likely to extend further toward the next target zone around 97.400, provided price remains above the current support.
As long as the price holds above the retested zone, the bullish outlook remains intact. A breakdown back below this area, however, would be a warning sign and could open the door to a deeper pullback.
Remember, always wait for confirmation before entering trades, and maintain disciplined risk management.
AUDJPY SHORT FORECAST Q3 W27 D1 Y25AUDJPY SHORT FORECAST Q3 W27 D1 Y25
Professional Risk Managers👋
Welcome back to another FRGNT chart update📈
Diving into some Forex setups using predominantly higher time frame order blocks alongside confirmation breaks of structure.
Let’s see what price action is telling us today! 👀
💡Here are some trade confluences📝
✅Weekly Order Block Identified
✅Daily Order block identified
✅4H Order Block identified
✅15' Order block identified
🔑 Remember, to participate in trading comes always with a degree of risk, therefore as professional risk managers it remains vital that we stick to our risk management plan as well as our trading strategies.
📈The rest, we leave to the balance of probabilities.
💡Fail to plan. Plan to fail.
🏆It has always been that simple.
❤️Good luck with your trading journey, I shall see you at the very top.
🎯Trade consistent, FRGNT X

AUDJPY SHORT FORECAST Q3 D10 W28 Y25AUDJPY SHORT FORECAST Q3 D10 W28 Y25
Professional Risk Managers👋
Welcome back to another FRGNT chart update📈
Diving into some Forex setups using predominantly higher time frame order blocks alongside confirmation breaks of structure.
Let’s see what price action is telling us today! 👀
🔑 Remember, to participate in trading comes always with a degree of risk, therefore as professional risk managers it remains vital that we stick to our risk management plan as well as our trading strategies.
📈The rest, we leave to the balance of probabilities.
💡Fail to plan. Plan to fail.
🏆It has always been that simple.
❤️Good luck with your trading journey, I shall see you at the very top.
🎯Trade consistent, FRGNT X

AUDJPY Ready To "Drop A Shoulder"? Multi-Timeframe May Help!OANDA:AUDJPY is beginning to form a very convincingly strong Reversal Pattern, the Head & Shoulders!
Starting with the Daily Chart we can see that Price is Forming a Doji Candle just after trying to Breakout of a Major Resistance Zone created from the Highs of March 18th and if Price is unable to close above this level, this strengthens the Bearish and Reversal Bias.
Now the 4 Hr Chart shows both the "First Shoulder" or Previous Higher High that was surpassed by the "Head" which is the New Higher High, has formed quite quickly with a slightly Ascending "Neckline" or Support Line where Bulls were able to make their Last Stand.
With a Reversal Pattern, you want to see a Change in Trend, in this case, would be a Lower High then that of the Higher High or "Head" @ 96.204.
*If Bulls are able to Push Price above the "Left Shoulder" or Previous Higher High @ 95.952, this will Invalidate the Head & Shoulders Set-up!
**If Bulls are unable to Break Above 95.952 and Price is pushed back down to the Confirmation or "Neckline" for a 3rd time, this Confirms the Head & Shoulders Set-up!!
Based on the Distance between the Head and Neckline, we can project a potential drop down to the next Support Level as a Price Target @ 95.00 once:
1) Pattern is Confirmed
2) Breakout is Validated

AUDJPY: Short Trade with Entry/SL/TP
AUDJPY
- Classic bearish pattern
- Our team expects retracement
SUGGESTED TRADE:
Swing Trade
Sell AUDJPY
Entry - 95.749
Stop - 96.149
Take - 94.847
Our Risk - 1%
Start protection of your profits from lower levels
Disclosure: I am part of Trade Nation's Influencer program and receive a monthly fee for using their TradingView charts in my analysis.
❤️ Please, support our work with like & comment! ❤️

AUDJPY 1D: breakout toward 100–105AUDJPY has confirmed an inverse head and shoulders breakout on the daily chart, with a strong move above the neckline. All key moving averages, including MA50 and MA200, remain below the current price — confirming bullish momentum. Volume increased on the breakout, and price has held above the 95.6 neckline zone. As long as that level holds, the setup remains valid. Targets are set at 100.36 (1.618 Fibo) and 105.19 (2.0 Fibo).

AUD/JPY BEARS WILL DOMINATE THE MARKET|SHORT
Hello, Friends!
The BB upper band is nearby so AUD/JPY is in the overbought territory. Thus, despite the uptrend on the 1W timeframe I think that we will see a bearish reaction from the resistance line above and a move down towards the target at around 95.252.
Disclosure: I am part of Trade Nation's Influencer program and receive a monthly fee for using their TradingView charts in my analysis.
✅LIKE AND COMMENT MY IDEAS✅

AUDJPY Bullish Channel Still Intact, Eyeing Breakout Above 95.00AUDJPY continues to respect its ascending channel, with the current bounce occurring right at the 61.8% Fibonacci retracement and lower trendline support. The structure supports further upside as long as price holds above the 94.00–93.80 zone, with targets set toward 94.77 and 95.36, potentially extending to 95.63 highs.
🧠 Fundamentals:
AUD Strength Drivers:
RBA remains relatively hawkish vs other G10 banks.
Australia's data this week (retail sales, NAB confidence) were mixed, but no rate cut pricing in the near term supports AUD.
Iron ore demand showing resilience despite Chinese slowdown concerns.
JPY Weakness Drivers:
BoJ remains ultra-dovish. No action expected in July.
Japan’s inflation remains tame; the yield gap with other majors keeps widening.
Risk-on sentiment reduces demand for safe-havens like JPY.
🔍 Technical Structure:
Strong upward channel since early June remains valid.
Current pullback held the 61.8% Fib retracement of the June-July leg.
Bullish engulfing near support confirms entry.
Immediate resistance at 94.77 → 95.36 → potential breakout to 95.63.
Invalid if price closes below 93.80 (channel break).
⚠️ Risk Factors:
Risk-off shift (e.g., geopolitical escalation or U.S. CPI surprise) may boost JPY.
China growth fears can weigh on AUD.
A sudden dovish shift from the RBA would invalidate bullish fundamentals.
🔁 Leader/Lagger Dynamics:
AUDJPY typically leads other yen crosses (e.g., NZDJPY, CADJPY) during risk-on moves. It’s also a barometer for broader risk sentiment, often following moves in equity indices like US500 or commodity-linked assets.
✅ Trade Bias: Bullish
TP1: 94.77
TP2: 95.36
TP3 (aggressive): 95.63
SL: Below 93.80
Event to Watch: China data this week + U.S. CPI (Jul 11)
📌 Watch for a strong bullish daily candle above 94.77 for continuation confirmation. Stay nimble around key global risk events.

AUD_JPY WILL KEEP GROWING|LONG|
✅AUD_JPY is going up
Now and the pair made a bullish
Breakout of the key horizontal
Level of 95.600 and the breakout
Is confirmed so we are bullish
Biased and further growth
Is to be expected
LONG🚀
✅Like and subscribe to never miss a new idea!✅
Disclosure: I am part of Trade Nation's Influencer program and receive a monthly fee for using their TradingView charts in my analysis.

AUD-JPY Bullish Breakout! Buy!
Hello,Traders!
AUD-JPY is trading in a
Strong uptrend and the pair
Made a bullish breakout of
The key horizontal level
Of 95.650 which is now a
Support and the breakout
Is confirmed so we are bullish
Biased and we will be expecting
A further bullish move up
Buy!
Comment and subscribe to help us grow!
Check out other forecasts below too!
Disclosure: I am part of Trade Nation's Influencer program and receive a monthly fee for using their TradingView charts in my analysis.

AUDJPY SHORT FORECAST Q3 D8 W28 Y25AUDJPY SHORT FORECAST Q3 D8 W28 Y25
Professional Risk Managers👋
Welcome back to another FRGNT chart update📈
Diving into some Forex setups using predominantly higher time frame order blocks alongside confirmation breaks of structure.
Let’s see what price action is telling us today! 👀
🔑 Remember, to participate in trading comes always with a degree of risk, therefore as professional risk managers it remains vital that we stick to our risk management plan as well as our trading strategies.
📈The rest, we leave to the balance of probabilities.
💡Fail to plan. Plan to fail.
🏆It has always been that simple.
❤️Good luck with your trading journey, I shall see you at the very top.
🎯Trade consistent, FRGNT X

AUDJPY SHORT FORECAST Q3 W28 Y25AUDJPY SHORT FORECAST Q3 W28 Y25
Professional Risk Managers👋
Welcome back to another FRGNT chart update📈
Diving into some Forex setups using predominantly higher time frame order blocks alongside confirmation breaks of structure.
Let’s see what price action is telling us today! 👀
💡Here are some trade confluences📝
✅Weekly Order Block Identified
✅Daily Order block identified
✅4H Order Block identified
✅15' Order block identified
🔑 Remember, to participate in trading comes always with a degree of risk, therefore as professional risk managers it remains vital that we stick to our risk management plan as well as our trading strategies.
📈The rest, we leave to the balance of probabilities.
💡Fail to plan. Plan to fail.
🏆It has always been that simple.
❤️Good luck with your trading journey, I shall see you at the very top.
🎯Trade consistent, FRGNT X

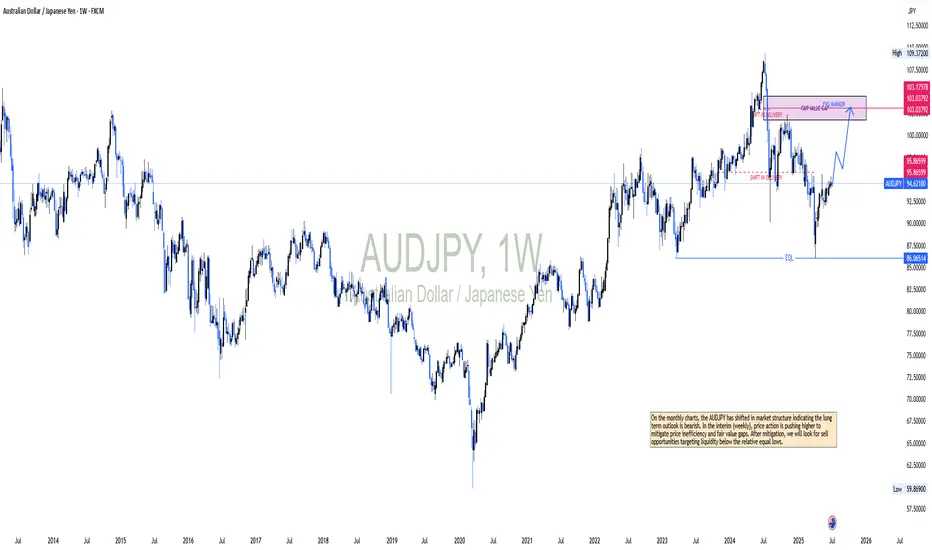
AUDJPY OUTLOOKOn the monthly charts, the AUDJPY has shifted in market structure indicating the long term outlook is bearish. In the interim (weekly), price action is pushing higher to mitigate price inefficiency and fair value gaps. After mitigation, we will look for sell opportunities targeting liquidity below the relative equal lows.
The Chart Says ''Cheer Up Japan'' – JPY Looks Safe📊🇯🇵 The Chart Says "Cheer Up Japan" – JPY Looks Safe 💙✨
There’s been talk, worry, even viral prophecy this week… but I’m here to say:
I read charts — not fear.
And right now, the JPY is showing strength, not weakness.
After running a full scan with my AI-powered Precision Master Mode, the cleanest trade setup aligned with this view is:
AUDJPY SHORT 📉
🗾 Cheer up, Japan — the Yen’s got this.
No panic in the charts. Just structure, volume, and momentum confirming that JPY is holding its ground as a safe-haven currency.
🔍 TRADE SETUP – AUDJPY SHORT
ENTRY: Market (or 94.85 for better R:R)
STOP LOSS: 95.70 (above trap high)
TARGETS:
TP1: 93.50
TP2: 91.57
TP3: 87.84 (macro target)
📈 What the chart shows:
– Strong rejection from top channel zone (structure is King!)
– SuperTrend flip starting on multiple TFs
– VWRSI fading = momentum loss
– Volume Profile confirms resistance
So while the headlines play on emotions, my execution comes from structure.
Let’s ride this JPY strength into next week — calmly, confidently.
📸 Chart attached (8H view – AI tuned)
📰 Article on the 'prophecy' that sparked the buzz:
www.telegraphindia.com
Have a nice weekend Japan and all Asia! After a 'scary prophecy' troubling your minds the weekend can end up being a crazy happy one!
One Love,
The FXPROFESSOR 💙
Disclosure: I am happy to be part of the Trade Nation's Influencer program and receive a monthly fee for using their TradingView charts in my analysis. Awesome broker, where the trader really comes first! 🌟🤝📈


AUD/JPY: Rejection at Key ResistanceThis is a high-conviction short setup on AUD/JPY based on a powerful rejection pattern that has formed on the 4-hour chart. As you can see, the price spiked into the critical resistance zone between 95.00 and 95.55 but was immediately and forcefully rejected, leaving behind a long "Exhaustion Spike."
This is a classic sign of buyer exhaustion and seller dominance. It tells us that despite the recent rally, there is significant supply waiting at these higher levels. This price action provides a clear opportunity to short the pair in anticipation of a significant move down.
🏦 Fundamental Analysis
The fundamental backdrop provides a strong tailwind for this trade, with two key drivers:
1️⃣ Central Bank Divergence: The Reserve Bank of Australia (RBA) is in an easing cycle, having recently cut rates to 3.85% with more cuts expected. In stark contrast, the Bank of Japan (BoJ) is on a path of normalization, having already raised its rate to 0.50%. This divergence in monetary policy is structurally bearish for AUD/JPY.
2️⃣ Imminent Catalysts: This week is packed with event risk that is skewed to the downside for this pair. We have the RBA interest rate decision on Tuesday, July 8th , and the U.S. tariff deadline on Wednesday, July 9th . A dovish RBA or a "risk-off" move from the tariff news would likely accelerate the decline in AUD (a risk currency) and strengthen the JPY (a safe-haven currency).
📊 Technical Analysis
The price action on the chart confirms the bearish bias:
1️⃣ 4-Hour Rejection: The "Exhaustion Spike" at the 95.00 - 95.55 supply zone is the primary signal. It shows a clear failure by buyers and a strong takeover by sellers at a key level.
2️⃣ Long-Term Trend: On the daily chart, the price is trading below the critical 200-day moving average , confirming the long-term trend remains bearish.
3️⃣ Waning Momentum: There is a clear bearish divergence on the daily RSI. The price made a higher high, but the momentum indicator made a lower high, signaling that the rally is internally weak and losing steam.
📋 Trading Setup
This is a swing trade designed to capture a significant correction with a simple "set and forget" plan.
📉 Direction: SHORT / SELL
👉 Entry: Sell Limit @ 94.85
⛔️ Stop Loss: 95.60
🎯 Take Profit: 91.10
💡 Rationale: The entry is placed strategically to capitalize on a potential retest of the rejection area. The stop loss is placed safely above the rejection wick and the major resistance zone. The take profit targets the major structural support from the May 2025 lows, offering an excellent risk-to-reward ratio.

AUDJPY SHORT FORECAST Q3 W27 D4 Y25AUDJPY SHORT FORECAST Q3 W27 D4 Y25
Professional Risk Managers👋
Welcome back to another FRGNT chart update📈
Diving into some Forex setups using predominantly higher time frame order blocks alongside confirmation breaks of structure.
Let’s see what price action is telling us today! 👀
💡Here are some trade confluences📝
✅Weekly Order Block Identified
✅Daily Order block identified
✅4H Order Block identified
✅15' Order block identified
🔑 Remember, to participate in trading comes always with a degree of risk, therefore as professional risk managers it remains vital that we stick to our risk management plan as well as our trading strategies.
📈The rest, we leave to the balance of probabilities.
💡Fail to plan. Plan to fail.
🏆It has always been that simple.
❤️Good luck with your trading journey, I shall see you at the very top.
🎯Trade consistent, FRGNT X

AUD_JPY RISKY SHORT|
✅AUD_JPY is set to retest a
Strong resistance level above at 95.600
After trading in a local uptrend for some time
Which makes a bearish pullback a likely scenario
With the target being a local support below at 95.081
SHORT🔥
✅Like and subscribe to never miss a new idea!✅
Disclosure: I am part of Trade Nation's Influencer program and receive a monthly fee for using their TradingView charts in my analysis.

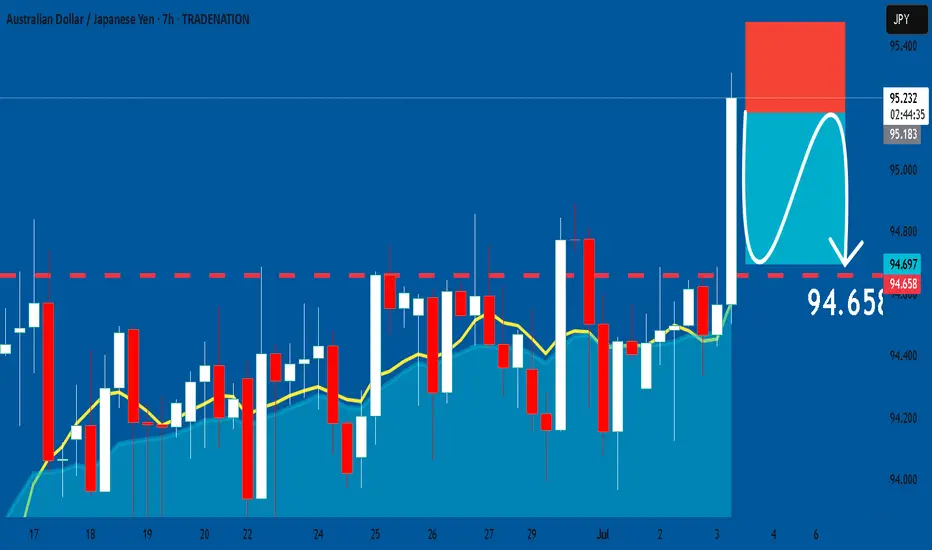
AUDJPY: Short Trade Explained
AUDJPY
- Classic bearish formation
- Our team expects fall
SUGGESTED TRADE:
Swing Trade
Sell AUDJPY
Entry Level - 95.193
Sl - 95.477
Tp - 94.658
Our Risk - 1%
Start protection of your profits from lower levels
Disclosure: I am part of Trade Nation's Influencer program and receive a monthly fee for using their TradingView charts in my analysis.
❤️ Please, support our work with like & comment! ❤️
AUD/JPY# AUD/JPY: Two High-Probability Bearish Setups 🎯
## Overview
AUD/JPY continues to respect its macro downtrend structure, offering two compelling bearish opportunities as price approaches critical resistance levels. Currently trading at 94.398, the pair sits at an inflection point between key support and resistance zones.
---
## 📊 Setup 1: Resistance Zone Rejection (Primary)
### Key Level: 95.289 (Major Resistance)
This level has proven its significance multiple times:
- ✅ Strong resistance throughout recent months
- ✅ Clear seller dominance at this zone
- ✅ Confluence with descending channel structure
### Entry Strategy:
1. **Wait** for price to approach 95.289
2. **Identify** bearish rejection patterns:
- Pin bars / Shooting stars
- Bearish engulfing candles
- Multiple wick rejections
3. **Enter** short on confirmed rejection
4. **Stop Loss**: 95.50-95.60 (above resistance)
5. **Targets**:
- TP1: 93.240 (1:2 RR)
- TP2: 92.271 (1:3.5 RR)
---
## 📊 Setup 2: Rising Wedge Breakdown (Secondary)
### Pattern Recognition:
A textbook rising wedge has formed since the May lows - a bearish reversal pattern within the larger downtrend context.
### Entry Strategy:
1. **Monitor** the lower wedge trendline
2. **Wait** for decisive breakdown with volume
3. **Enter** short on retest of broken support
4. **Stop Loss**: Above recent swing high
5. **Target**: 93.240 support zone
---
## 📈 Market Structure Analysis
### Macro Trend: BEARISH 📉
- Consistent lower highs and lower lows from 102+ levels
- Currently in corrective bounce phase
- Respecting descending channel boundaries
### Current Position:
Price trapped between:
- **Resistance**: 95.289
- **Support**: 93.240
- **Deep Support**: 92.271
---
## ⚠️ Risk Management
**Patience is key!** Current price offers poor risk/reward. Wait for:
1. **Scenario A**: Test of 95.289 resistance → Short opportunity
2. **Scenario B**: Break below wedge support → Short opportunity
3. **Scenario C**: Break above 95.289 → Invalidation, stay flat
### Position Sizing:
- Risk per trade: 1-2% of account
- Adjust position size based on stop distance
---
## 🎯 Trade Summary
**Bias**: BEARISH 🐻
**Preferred Setup**: Resistance rejection at 95.289
**Risk/Reward**: Minimum 1:2
**Timeframe**: Daily
---
*Remember: The best trades come to those who wait. Let price come to your levels, don't chase!*
**What's your view? Drop a comment below! 👇**
*Disclaimer: This is not financial advice. Always do your own research and manage risk appropriately.*
---

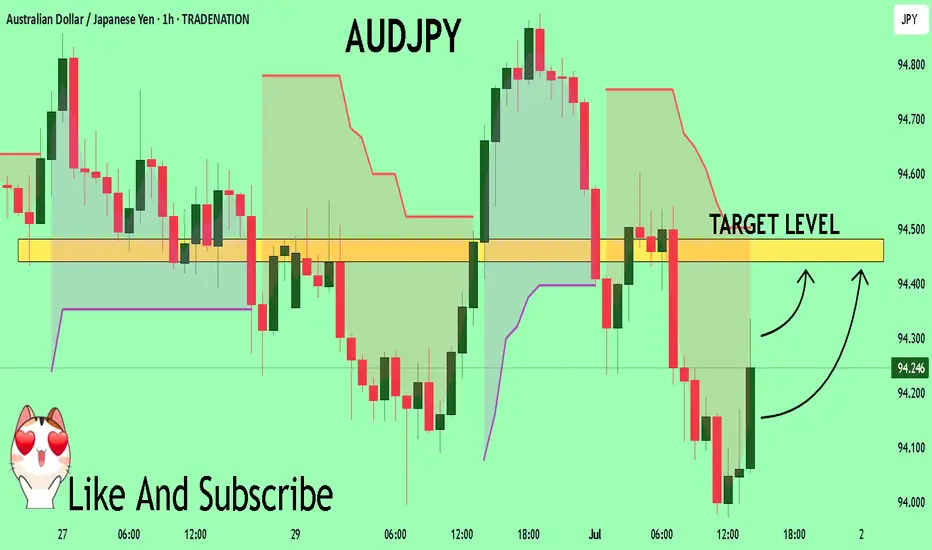
AUD/JPY SENDS CLEAR BEARISH SIGNALS|SHORT
Hello, Friends!
We are now examining the AUD/JPY pair and we can see that the pair is going up locally while also being in a uptrend on the 1W TF. But there is also a powerful signal from the BB upper band being nearby, indicating that the pair is overbought so we can go short from the resistance line above and a target at 93.578 level.
Disclosure: I am part of Trade Nation's Influencer program and receive a monthly fee for using their TradingView charts in my analysis.
✅LIKE AND COMMENT MY IDEAS✅

AUDJPY - let's do it again!Hello TradingView Family / Fellow Traders. This is Richard, also known as theSignalyst.
As per our last AUDJPY analysis (attached on the chart), it rejected the first blue circle zone and surged in a parabolic manner.
📈AUDJPY is currently retesting the intersection of the blue trendline and red support.
📚 As per my trading style:
As #AUDJPY is around the latest blue circle zone, I will be looking for bullish reversal setups (like a double bottom pattern, trendline break , and so on...)
📚 Always follow your trading plan regarding entry, risk management, and trade management.
Good luck!
All Strategies Are Good; If Managed Properly!
~Rich
Disclosure: I am part of Trade Nation's Influencer program and receive a monthly fee for using their TradingView charts in my analysis.

AUDJPY Trading Opportunity! BUY!
My dear subscribers,
My technical analysis for AUDJPY is below:
The price is coiling around a solid key level - 94.200
Bias - Bullish
Technical Indicators: Pivot Points Low anticipates a potential price reversal.
Super trend shows a clear buy, giving a perfect indicators' convergence.
Goal - 94.441
About Used Indicators:
By the very nature of the supertrend indicator, it offers firm support and resistance levels for traders to enter and exit trades. Additionally, it also provides signals for setting stop losses
Disclosure: I am part of Trade Nation's Influencer program and receive a monthly fee for using their TradingView charts in my analysis.
———————————
WISH YOU ALL LUCK