AUDJPY : Short Trade , 4hHello traders, we want to check the AUDJPY chart. The price is moving in a descending channel and has pulled back to the indicated key level. We expect this level to play the role of a resistance level and the price will fall again to around 96,900. Good luck.
AUDJPY

Daily Wedge w/ Divergence Spotted!! - AJHere I have AUD/JPY on the 4Hr and Daily Charts!
Daily Chart-
-We see Price outlining a Rising Wedge and with this the First inclination that we could see Price push down further is the Bearish Divergence shown as the HIGHS on the RSI indicator suggesting Bulls could be losing Power!
-The High created on Feb. 23rd was followed by a STEEP decline in price!! Much of this caused by BOJ rumors of JPY possibly exiting "Deflation" and with the market doing well!
4Hr Chart-
Price had made a Low after the steep decline from the High giving me an opportunity to find a Fib'd Entry Zone and Price had tested it already at the end of last week. To start this week, price as began to work down validating my Bearish Bias on this pair!
Fundamentally this week:
AUD - GDP (Tue)
JPY - Tokyo Core CPI & BOJ Ueda Speaks (Mon)
*Currently in Active Trade


AUDJPY LongWeekly chart is respecting the bullish weekly fair value gap.
DOL is the weekly swing high.
We are seeing H4 bearish levels get disrespected today. I'd like to see these levels get retested and respected as bullish arrays to then look for m15 bullish displacement entries.

AUD/JPY H4 | Potential bearish momentumAUD/JPY is falling towards a potential breakout level and could drop lower from here.
Sell entry is at 97.361 which is a potential breakout level (wait for the current 1-hour candle to close below 97.361 for confirmation of the bearish breakout).
Stop loss is at 97.900 which is a level that sits above a pullback resistance.
Take profit is at 96.850 which is an overlap support that aligns with a confluence of Fibonacci levels i.e. the 61.8% retracement and the 78.6% projection.
High Risk Investment Warning
Trading Forex/CFDs on margin carries a high level of risk and may not be suitable for all investors. Leverage can work against you.
Stratos Markets Limited (www.fxcm.com):
CFDs are complex instruments and come with a high risk of losing money rapidly due to leverage. 66% of retail investor accounts lose money when trading CFDs with this provider. You should consider whether you understand how CFDs work and whether you can afford to take the high risk of losing your money.
Stratos Europe Ltd, previously FXCM EU Ltd (www.fxcm.com):
CFDs are complex instruments and come with a high risk of losing money rapidly due to leverage. 70% of retail investor accounts lose money when trading CFDs with this provider. You should consider whether you understand how CFDs work and whether you can afford to take the high risk of losing your money.
Stratos Trading Pty. Limited (www.fxcm.com):
Trading FX/CFDs carries significant risks. FXCM AU (AFSL 309763), please read the Financial Services Guide, Product Disclosure Statement, Target Market Determination and Terms of Business at www.fxcm.com
Stratos Global LLC (www.fxcm.com):
Losses can exceed deposits.
Please be advised that the information presented on TradingView is provided to FXCM (‘Company’, ‘we’) by a third-party provider (‘TFA Global Pte Ltd’). Please be reminded that you are solely responsible for the trading decisions on your account. There is a very high degree of risk involved in trading. Any information and/or content is intended entirely for research, educational and informational purposes only and does not constitute investment or consultation advice or investment strategy. The information is not tailored to the investment needs of any specific person and therefore does not involve a consideration of any of the investment objectives, financial situation or needs of any viewer that may receive it. Kindly also note that past performance is not a reliable indicator of future results. Actual results may differ materially from those anticipated in forward-looking or past performance statements. We assume no liability as to the accuracy or completeness of any of the information and/or content provided herein and the Company cannot be held responsible for any omission, mistake nor for any loss or damage including without limitation to any loss of profit which may arise from reliance on any information supplied by TFA Global Pte Ltd.
The speaker(s) is neither an employee, agent nor representative of FXCM and is therefore acting independently. The opinions given are their own, constitute general market commentary, and do not constitute the opinion or advice of FXCM or any form of personal or investment advice. FXCM neither endorses nor guarantees offerings of third-party speakers, nor is FXCM responsible for the content, veracity or opinions of third-party speakers, presenters or participants.

AUDJPY | MY MIND TERM VIEW | 1hThis is my current view of AUDJPY. What do you think?
The Doji = indecision?? 😂🤦
DBR = Drob Base Rally

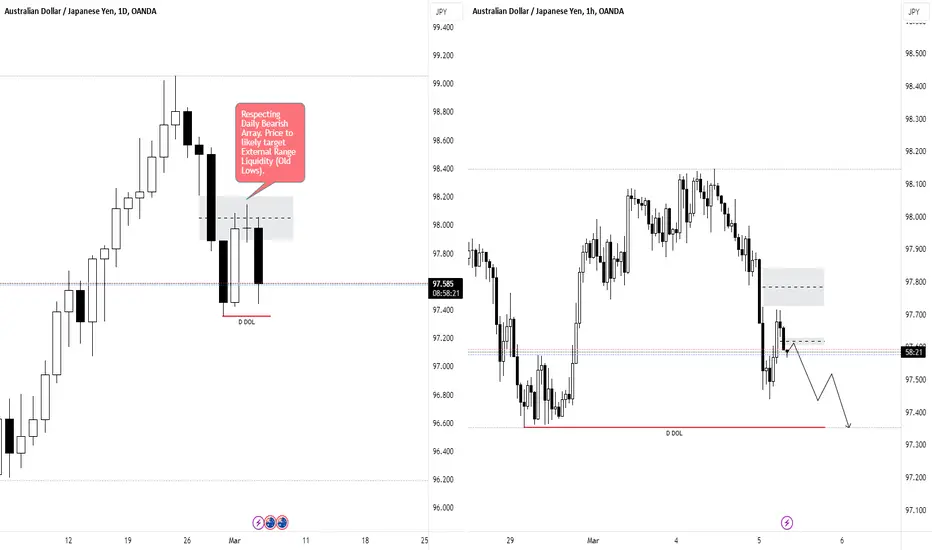
AUDJPY ShortDaily chart has seen AUDJPY respecting premium daily levels (rejecting from Daily SIBI).
The idea of this trade is that price has traded up into the daily imbalance, and rejected from it, so I now expect price to seek external range liquidity in the form of old lows on the daily chart.
I want to see bullish arrays get disrespected and bearish arrays respected to then look for m5/m15 bearish displacement for short entry.
AUD/JPY H4 | Potential bearish breakoutAUD/JPY could fall towards a potential breakout level and fall lower towards our take-profit target.
Entry: 97.360
Why we like it:
There is a potential breakout level (wait for 1-hour candle to close below 97.360 for a breakout confirmation)
Stop Loss: 97.815
Why we like it:
There is a pullback resistance level
Take Profit: 96.849
Why we like it:
There is an overlap support that aligns with the 61.8% Fibonacci retracement level
Please be advised that the information presented on TradingView is provided to Vantage (‘Vantage Global Limited’, ‘we’) by a third-party provider (‘Everest Fortune Group’). Please be reminded that you are solely responsible for the trading decisions on your account. There is a very high degree of risk involved in trading. Any information and/or content is intended entirely for research, educational and informational purposes only and does not constitute investment or consultation advice or investment strategy. The information is not tailored to the investment needs of any specific person and therefore does not involve a consideration of any of the investment objectives, financial situation or needs of any viewer that may receive it. Kindly also note that past performance is not a reliable indicator of future results. Actual results may differ materially from those anticipated in forward-looking or past performance statements. We assume no liability as to the accuracy or completeness of any of the information and/or content provided herein and the Company cannot be held responsible for any omission, mistake nor for any loss or damage including without limitation to any loss of profit which may arise from reliance on any information supplied by Everest Fortune Group.

AUDJPY - 1H - CUP & HANDLE - SHORT POSITIONIn this chart you can we have spotted inverted cup & handle and we expect a down trend but we also observe a BEARISH DIVERGENCE.
hopefully we take a right entry & hit our TP

AUD/JPY BEST PLACE TO SELL FROM|SHORT
Hello,Friends!
It makes sense for us to go short on AUD/JPY right now from the resistance line above with the target of 97.259 because of the confluence of the two strong factors which are the general downtrend on the previous 1W candle and the overbought situation on the lower TF determined by it’s proximity to the upper BB band.
✅LIKE AND COMMENT MY IDEAS✅

AUDJPY..SHORTFX:AUDJPY SHORT position can be taken in the specified ZONE
There is no position before the ZONE
Only enter with CANDEL Hammer's approval

AUDJPY Potential DownsidesHey Traders, in tomorrow’s trading session we are monitoring AUDJPY for a selling opportunity around 98.100 zone, AUDJPY is trading in a downtrend and currently is in a correction phase in which it is approaching the trend at 98.100 support and resistance area.
Trade safe, Joe.

AUD/JPY BULLISH BIAS RIGHT NOW| LONG
Hello,Friends!
Bullish trend on AUD/JPY, defined by the green colour of the last week candle combined with the fact the pair is oversold based on the BB lower band proximity, makes me expect a bullish rebound from the support line below and a retest of the local target above at 98.222.
✅LIKE AND COMMENT MY IDEAS✅

AUDJPY I Potential long from support zone Welcome back! Let me know your thoughts in the comments!
** AUDJPY Analysis - Listen to video!
We recommend that you keep this pair on your watchlist and enter when the entry criteria of your strategy is met.
Please support this idea with a LIKE and COMMENT if you find it useful and Click "Follow" on our profile if you'd like these trade ideas delivered straight to your email in the future.
Thanks for your continued support!

AUDJPY Trading Opportunity! BUY!
My dear friends,
Please, find my technical outlook for AUDJPY below:
The price is coiling around a solid key level - 97.891
Bias - Bullish
Technical Indicators: Pivot Points Low anticipates a potential price reversal.
Super trend shows a clear buy, giving a perfect indicators' convergence.
Goal - 98.312
About Used Indicators:
The pivot point itself is simply the average of the high, low and closing prices from the previous trading day.
———————————
WISH YOU ALL LUCK

AUD-JPY Bullish Rebound Ahead! Buy!
Hello,Traders!
AUD-JPY fell down sharply
And the pair is locally oversold
So I am locally bullish biased
And I will be expecting a
Local bullish rebound
From the support below at 97.700
Buy!
Like, comment and subscribe to help us grow!
Check out other forecasts below too!

AUDJPY Will Go Up! Buy!
Here is our detailed technical review for AUDJPY.
Time Frame: 3h
Current Trend: Bullish
Sentiment: Oversold (based on 7-period RSI)
Forecast: Bullish
The market is approaching a key horizontal level 98.650.
Considering the today's price action, probabilities will be high to see a movement to 99.060.
P.S
The term oversold refers to a condition where an asset has traded lower in price and has the potential for a price bounce.
Overbought refers to market scenarios where the instrument is traded considerably higher than its fair value. Overvaluation is caused by market sentiments when there is positive news.
Like and subscribe and comment my ideas if you enjoy them!

AUD-JPY Will Keep Growing! Buy!
Hello,Traders!
AUD-JPY is now trading
Firmly above the horizontal
Key level of 98.54 which is
A support now and as the pair
Is in the strong uptrend
We will be expecting a
Further move up
Buy!
Like, comment and subscribe to help us grow!
Check out other forecasts below too!

✅AUD_JPY GROWTH AHEAD|LONG🚀
✅AUD_JPY is trading in an
Uptrend and the pair is
Making a local bearish
Correction but will soon
Retest the horizontal
Support level of 98.518
From where I think we
Will see a bullish rebound
And a move up
LONG🚀
✅Like and subscribe to never miss a new idea!✅

AUD/JPY BEST PLACE TO SELL FROM|SHORT
Hello,Friends!
We are going short on the AUD/JPY with the target of 98.464 level, because the pair is overbought and will soon hit the resistance line above. We deduced the overbought condition from the price being near to the upper BB band.However, we should use low risk here because the 1W TF is green and gives us a counter-signal.
✅LIKE AND COMMENT MY IDEAS✅

JPY Pairs at Key Resistance Overview
Most Yen pairs are at or nearing key resistance on daily, weekly, and monthly time-frames.
The Details
The Yen continues to weaken against global currencies due to negative interest rates set by the Bank of Japan (BOJ) and higher interest rates from the RBA, RBNZ, ECB, BOE, SNB, FED, etc.
The BOJ are edging closer to changing rates to zero or positive. This could strengthen the Yen, or at least stabilise the JPY selling.
The BOJ may intervene in the FX rate if JPY continues to weaken further, meaning possible JPY bullish volatility.
The Technicals
AUDJPY at weekly horizontal channel resistance
CHFJPY at monthly bullish channel resistance
GBPJPY nearing monthly horizontal resistance
NZDJPY at monthly horizontal resistance
SGDJPY at daily horizontal resistance and nearing previous daily trend support as resistance
USDJPY around weekly horizontal resistance

Buy AUDJPY Megaphone PatternThe AUD/JPY pair on the M30 timeframe presents a potential buying opportunity due to the presence of a well-defined megaphone pattern. This pattern, characterized by expanding channel lines, can suggest both bullish and bearish continuations depending on the context. However, in this case, certain factors point towards a potential upside move.
Buy Entry: Consider entering a long position around the current price of 98.28, positioned close to the breakout level. This offers an entry point near the perceived shift in momentum.
Target Levels: Initial bullish targets lie at the previous resistance levels within the megaphone, now acting as potential support zones: 98.73 and 98.94. Further upside targets could be determined using other technical analysis methods like Fibonacci retracements or extensions.
Stop-Loss: To manage risk, place a stop-loss order below the broken resistance line of the megaphone, ideally around 97.95. This helps limit potential losses if the price reverses and breaks back downwards.
Thank you

AUDJPY H1 | Falling to pullback supportAUD/JPY is falling towards a pullback support and could potentially bounce off this level to climb higher.
Buy entry is at 98.178 which is a pullback support.
Stop loss is at 97.850 which is a level that sits underneath a pullback support and the 50.0% Fibonacci retracement level.
Take profit is at 98.615 which is a swing-high resistance.
High Risk Investment Warning
Trading Forex/CFDs on margin carries a high level of risk and may not be suitable for all investors. Leverage can work against you.
Stratos Markets Limited (www.fxcm.com):
CFDs are complex instruments and come with a high risk of losing money rapidly due to leverage. 66% of retail investor accounts lose money when trading CFDs with this provider. You should consider whether you understand how CFDs work and whether you can afford to take the high risk of losing your money.
Stratos Europe Ltd, previously FXCM EU Ltd (www.fxcm.com):
CFDs are complex instruments and come with a high risk of losing money rapidly due to leverage. 70% of retail investor accounts lose money when trading CFDs with this provider. You should consider whether you understand how CFDs work and whether you can afford to take the high risk of losing your money.
Stratos Trading Pty. Limited (www.fxcm.com):
Trading FX/CFDs carries significant risks. FXCM AU (AFSL 309763), please read the Financial Services Guide, Product Disclosure Statement, Target Market Determination and Terms of Business at www.fxcm.com
Stratos Global LLC (www.fxcm.com):
Losses can exceed deposits.
Please be advised that the information presented on TradingView is provided to FXCM (‘Company’, ‘we’) by a third-party provider (‘TFA Global Pte Ltd’). Please be reminded that you are solely responsible for the trading decisions on your account. There is a very high degree of risk involved in trading. Any information and/or content is intended entirely for research, educational and informational purposes only and does not constitute investment or consultation advice or investment strategy. The information is not tailored to the investment needs of any specific person and therefore does not involve a consideration of any of the investment objectives, financial situation or needs of any viewer that may receive it. Kindly also note that past performance is not a reliable indicator of future results. Actual results may differ materially from those anticipated in forward-looking or past performance statements. We assume no liability as to the accuracy or completeness of any of the information and/or content provided herein and the Company cannot be held responsible for any omission, mistake nor for any loss or damage including without limitation to any loss of profit which may arise from reliance on any information supplied by TFA Global Pte Ltd.
The speaker(s) is neither an employee, agent nor representative of FXCM and is therefore acting independently. The opinions given are their own, constitute general market commentary, and do not constitute the opinion or advice of FXCM or any form of personal or investment advice. FXCM neither endorses nor guarantees offerings of third-party speakers, nor is FXCM responsible for the content, veracity or opinions of third-party speakers, presenters or participants.
