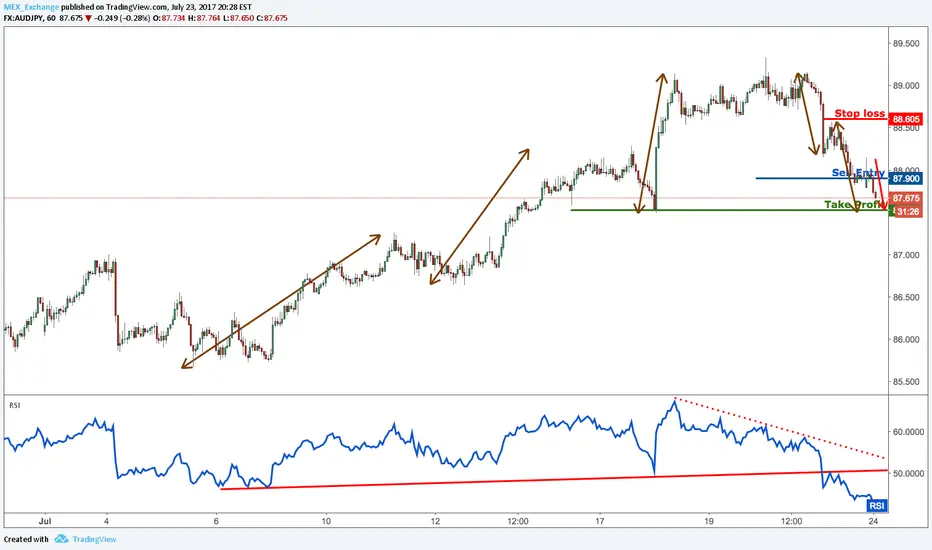
AUDJPY profit target reached perfectly, remain bearish for a furSell below 88.15. Stop loss at 88.60. Take profit at 87.52.
Reason for the trading strategy (technically):
Price has dropped perfectly from our selling area and has reached our profit target. We remain bearish looking to sell below 88.15 resistance (Fibonacci retracement, horizontal overlap resistance) for a further drop towards 87.52 support (Fibonacci extension, Fibonacci retracement, horizontal swing low support).
RSI (34) sees long term resistance holding price momentum down which helps us keep our bearish bias.
Audjpydaily
AUDJPY Easy SellEasy sell setup for AUDJPY. Going to the lower range and a chance on breaking it. Lower range is about 120 pips down. so when it gets there lock in 80 pips of profit by moving your stop loss and then wait to see if it breakout and goes all the way down to 85

AUDJPY testing strong resistance, remain bearishSell below 89.11. Stop loss at 87.52. Take profit at 89.61.
Reason for the trading strategy (technically):
Price is testing major resistance at 89.11 (Fibonacci extension, swing high resistance) and we expect to see a reaction off this level for a drop to at least 87.52 support (Fibonacci retracement, horizontal swing low support).
Stochastic (34,5,3) has started dropping from our 98% resistance nicely.

AUDJPY dropping perfectly as expected, remain bullish Sell below 88.26. Stop loss at 88.68. Take profit at 87.27.
Reason for the trading strategy (technically):
Price has reached our selling area and reacted off it perfectly. We remain bearish looking to sell on strength below major resistance at 88.26 (Fibonacci extension, Elliott wave theory) for a continued drop to at least 87.27 support (Fibonacci retracement, horizontal pullback support).
Stochastic (34,5,3) has started dropping from our 98% resistance nicely.
Correlation analysis: AUD weakness is expected today with AUDUSD similarly testing major resistance and expecting a drop.


AUDJPY approaching major resistance, prepare to sellSell below 88.26. Stop loss at 88.68. Take profit at 87.27.
Reason for the trading strategy (technically):
Price is approaching major resistance at 88.26 (Fibonacci extension, Elliott wave theory) and we expect to see a reaction off this level for a drop to at least 87.27 support (Fibonacci retracement, horizontal pullback support).
Stochastic (34,5,3) has been testing out 98% resistance for quite some time and we expect a drop on it soon.
Correlation analysis: AUD weakness is expected today with AUDUSD similarly testing major resistance and expecting a drop.

lots of HSH now a days...wait for the break
then long for a long time...
swing trading could give good benefits here...

AUDJPY approaching major resistance, prepare to sellSell below 85.06. Stop loss at 05.25. Take profit at 84.38.
Reason for the trading strategy (technically):
Price is approaching major resistance at 85.06 (Fibonacci extension, horizontal swing high resistance) and we expect a strong reaction from this level for a drop to at least 84.38 support (Fibonacci retracement, horizontal overlap support).
Stochastic (34,5,3) is seeing strong resistance below 96% where we expect a further drop from.

AUDJPY dropping perfectly towards profit target, remain bearishSell below 84.70. Stop loss at 85.71. Take profit at 83.90.
Reason for the trading strategy (technically):
Price has dropped perfectly from our selling area and is fast approaching our profit target. We remain bearish below 84.70 resistance (Fibonacci retracement, horizontal overlap resistance) for a further push down to at least 83.90 support (Fibonacci retracement, horizontal pullback support).
Stochastic (89,5,3) is seeing strong resistance below 90% where we expect a further drop from.

AUDJPY profit target reached perfectly, prepare to buy again forBuy above 82.94. Stop loss at 82.54. Take profit at 83.66.
Reason for the trading strategy (technically):
Price has shot up and reached our profit target perfectly from yesterday. We remain bullish looking to buy above 82.94 major support (Fibonacci retracement, Fibonacci extension, horizontal swing low support, ascending support line) for a push up to at least 83.66 resistance (Fibonacci extension, horizontal swing high resistance).
Stochastic (21,5,3) is also seeing strong ascending support holding price up really well.

AUDJPY approaching major resistance, prepare to sellSell below 83.48. Stop loss at 83.93. Take profit at 82.80.
Reason for the trading strategy (technically):
We prepare to sell on major resistance at 83.48 (Fibonacci retracement, Fibonacci extension) and expect a strong reaction from that level to drive price down to at least 82.80 support (Fibonacci retracement, horizontal overlap support).
Stochastic (34,5,3) is seeing major resistance below the 91% level where we expect a further drop from.
Correlation analysis: Overall JPY strength is expected today with drops on AUDJPY and USDJPY. Furthermore, we expect AUD weakness with a drop on AUDUSD expected too.

AUDJPY approaching profit target perfectly, prepare to sellSell below 82.94. Stop loss at 83.22. Take profit at 81.92.
Reason for the trading strategy (technically):
Price has bounced off our buy entry perfectly yesterday and has risen strongly towards our profit target. We prepare to sell below major resistance at 82.94 (Fibonacci retracement, horizontal resistance) for a push down to 81.92 support (Fibonacci extension, horizontal swing low support).
Stochastic (34,5,3) is seeing strong resistance below the 93% where we expect a drop from soon.

AUDJPY right on support, remain bullishBuy above 81.90. Stop loss at 81.67. Take profit at 82.90.
Reason for the trading strategy (technically):
Price has once again dropped to our support level. We remain bullish above major support at 81.90 (Fibonacci extension, horizontal swing low support, bullish divergence) and we expect a strong bounce above this level to at least 82.90 resistance (Fibonacci retracement, horizontal swing high resistance).
Stochastic (34,5,3) is seeing strong support above the 8% level and also sees bullish divergence vs price signalling that a bounce is impending.
Correlation analysis: We’re expecting overall JPY weakness with bounces expected on AUDJPY, USDJPY and EURJPY. Hence this falls very nicely into a correlated move.

AUDJPY bouncing perfectly, remain bullishBuy above 81.90. Stop loss at 81.67. Take profit at 82.90.
Reason for the trading strategy (technically):
Price has dropped perfectly to our buying area and bounced off perfectly. We remain bullish above major support at 81.90 (Fibonacci extension, horizontal swing low support, bullish divergence) and we expect a strong bounce above this level to at least 82.90 resistance (Fibonacci retracement, horizontal swing high resistance).
Stochastic (34,5,3) is seeing strong support above the 8% level and also sees bullish divergence vs price signalling that a bounce is impending.
Correlation analysis: We’re expecting overall JPY strength today across USDJPY and EURJPY, hence it is best to exercise caution on this trade.

AUDJPY approaching major support, prepare to buyBuy above 81.90. Stop loss at 81.67. Take profit at 82.53.
Reason for the trading strategy (technically):
Price is approaching major support at 81.90 (Fibonacci extension, horizontal swing low support, bullish divergence) and we expect a strong bounce above this level to at least 82.53 resistance (Fibonacci retracement, horizontal overlap resistance).
Stochastic (34,5,3) is seeing strong support above the 8% level and also sees bullish divergence vs price signalling that a bounce is impending.
Correlation analysis: We’re expecting general JPY weakness with USDJPY similarly expecting a bounce from key level.

ABC CORRECTION IN AUDJPY - DAILY CHARTHey Traders,
We are about to finish the C wave so expect a breakout of the trendline to start the new impulse.
-
Hola Traders,
Estamos a punto de terminar la onda C así que estad al tanto de la ruptura de tendencia para el nuevo impulso.

AUDJPY approaching profit target, remain bearishSell below 83.83. Stop loss at 84.23. Take profit at 83.21.
Reason for the trading strategy (technically):
Price has continued to drop towards our profit target really nicely. We remain bearish below 83.83 resistance (Fibonacci retracement, pullback resistance, horizontal overlap resistance) for a further drop towards 83.21 support (Fibonacci retracement, horizontal swing low support).
Stochastic (89,5,3) is seeing good downside potential towards 4%.

AUDJPY dropping nicely from our selling area, remain bearishSell below 84.23. Stop loss at 84.64. Take profit at 83.27.
Reason for the trading strategy (technically):
Price has reached our selling area and is dropping nicely. We now remain bearish below major resistance at 84.23 (Fibonacci retracement, Fibonacci extension, horizontal pullback resistance) and we expect price to react off this level and drop towards 83.27 support (Fibonacci retracement, horizontal pullback support).
Stochastic (34,5,3) is seeing major resistance below the 92% level where we expect a drop from.
Correlation analysis: We’re expecting overall JPY strength today with AUDJPY and EURJPY both expecting drops.


AUDJPY - Going long - Copper? So... The Aussie dollar seems to be doing alright, the yen had some unraveling with the lessened pressure from the elections - and it looks like copper may be wanting to start to make a comeback. I have taken this opportunity to go long on AUDJPY to take advantage.
I have my own SL set rather short on one position at 89.70 however, my other longer term trade I have a SL of 82.00

AUDJPY profit target reached perfectly, time to sellSell below 83.92. Stop loss at 84.51. Take profit at 82.43.
Reason for the trading strategy (technically):
Price has gapped up and reached our profit target perfectly this morning. We prepare to sell below 83.92 resistance (Fibonacci retracement, horizontal resistance, bearish divergence) for price to drop down towards 82.43 (Fibonacci retracement, horizontal pullback support, price gap) to fill up the gap that has been created.
Stochastic (55,5,3) is seeing strong resistance below 91% and also sees bearish divergence vs price signalling that a bearish reversal is impending.
To read about the daily technical analysis strategies in more detail, you can check them out here : www.theforexarmy.com
They're very useful for forex scalping, day trading and swing trading opportunities.


