Audjpydaily
AUD/JPY Long IdeaHi traders,
This is my idea for today. Good AU reports and preatty bad JP reports should drive AUD up against JPY.
Also this pair is in bull channel. My target for today is 86.00, if it breaks, can go to 62.25.
Feel free to comment your opinion !

AUDJPY: Bears IncomingThe bullish run has purged the previous high, this should now create enough liquidity for a shift in direction.
I would like to see a collapse from the AUD over the next few days with the assistance of the RBA.
Do you think this setup is feasible?

AUDJPY / Short OpportunityAfter a big impulsive move to resistance we can start looking for short opportunities for the week ahead, I am currently marking up the key levels to look out for
I will be looking on a lower timeframe to enter a short position to the most recent support area

AUDJPY TF D1 FROM 11/10/2021AUDJPY potentially forming DBW pattern (DESCENDING BROADENING WEDGE) the target price based on cluster areas Fibonacci retracement and expansion (TP1, TP2, TP3) max SL 77,827
trading call : buy on weakness

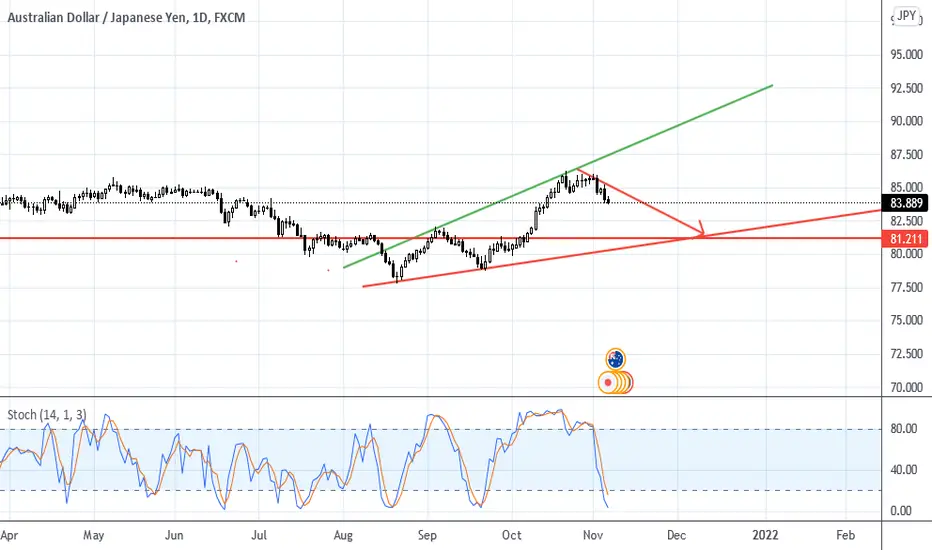
AUDJPY-Short#AUDPY
Market is currently moving in bullish channel unable to cross ascending resistance. At the same spot RSI is above 80 sign for overbought. So i am looking for a good short move in long-term.

AUD/JPY Complete a full price cycleThe currency pair has completed a full price cycle
According to the rule, if the time comes and the price does not come, the direction will change
I guess it's a good time to look for deals

AUDJPY | Small correction♻️Hello traders , Our goal in this analysis is to give you an overview of the future of symbolism.
This analysis is prepared in daily timeframe but has been published for better view in 2 days timeframe.
In this analysis, we examined the a wave in the weekly time frame.
Based on this wave count, waves 1, 2 and 3 are complete and now we are inside wave 4.
In wave 4, wave a is formed as 5 waves, so we expect wave 4 to be completed in a zigzag pattern.
Wave a is complete and Wave b is forming, and Wave b must move to a maximum of 0.618 Fibonacci.
The upward movement of the price that has started is related to one of the waves of wave b, but to be sure of wave b, we first expect the pink channel to break.
After the completion of wave b in the specified Fibo, we expect the price to fall to the specified area to form wave c.
If the price moves higher than Fibonacci 0.618, wave 4 ends at this point and wave 5 starts.
🙏If you have an idea that helps me provide a better analysis, I will be happy to write in the comments🙏
❤️Please, support this idea with a like and comment!❤️

AUDJPY | The best area to buy📍Hello traders , Our goal in this analysis is to give you an overview of the future of symbolism.
In this analysis, we examined wave a in the weekly time frame.
Based on the wave count we did in this time frame, waves 1, 2, 3 and 4 are fully forming and now the microwaves of wave 5 are forming.
In this wave, waves 1, 2, 3 and 4 are complete and wave 5 is being formed, and we expect 0.618 to be completed in the Fibo area and the price to prepare for wave b to form.
But we must also consider the potential for decline, if the price moves above Fibonacci 0.618, this analysis will be field because wave a will be 5 waves.
🙏If you have an idea that helps me provide a better analysis, I will be happy to write in the comments🙏
❤️Please, support this idea with a like and comment!❤️

AUDJPY | The best place to buy 🔥Hello traders , Our goal in this analysis is to give you an overview of the future of symbolism.
In this analysis, we examined wave a in the weekly timeframe analysis.
According to the wave count we did, waves 1, 2 and 3 are complete and now we are inside wave 4.
In wave 4, wave a is formed as 5 waves, so we expect wave 4 to be completed in a zigzag pattern.
Wave a is relatively complete, but we expect a slight further drop in price if the red circle is broken.
From the same price or finally the pink trend line , we expect the upward trend to start and the formation of wave b, wave b can finally move to Fibonacci 0.618, if wave b moves beyond Fibonacci 0.618, it indicates that wave 4 is over and wave 5 has started.
After Wave b is completed, we expect the price to move above the price targets we set for Wave c based on Wave 4.
The best place to shop is after the purple circle is broken.
This analysis is fielded if the price crosses the warning sign.
🙏If you have an idea that helps me provide a better analysis, I will be happy to write in the comments🙏
❤️Please, support this idea with a like and comment!❤️

AUDJPY | The best place to buy 🔥Hello traders , Our goal in this analysis is to give you an overview of the future of symbolism.
In this analysis, we examined wave a in the weekly timeframe analysis.
According to the wave count we did, waves 1, 2 and 3 are complete and now we are inside wave 4.
In wave 4, wave a is formed as 5 waves, so we expect wave 4 to be completed in a zigzag pattern.
Wave a is relatively complete, but we expect a slight further drop in price if the red circle is broken.
From the same price or finally the pink trend line, we expect the upward trend to start and the formation of wave b, wave b can finally move to Fibonacci 0.618, if wave b moves beyond Fibonacci 0.618, it indicates that wave 4 is over and wave 5 has started.
After Wave b is completed, we expect the price to move above the price targets we set for Wave c based on Wave 4.
The best place to shop is after the purple circle is broken.
This analysis is fielded if the price crosses the warning sign.
🙏If you have an idea that helps me provide a better analysis, I will be happy to write in the comments🙏
❤️Please, support this idea with a like and comment!❤️

AUDJPYPossible set up this week on AUDJPY
Price currently testing our H4 support.
Could see some bullish movement towards end of the week, if price respects our current levels.
Please follow, like and share.

AUDJPY | The best scenario for a fall📝Hello traders, Symbol AUDJPY ,This analysis has been prepared in a weekly time frame but has been published for a better view in a 2 week time frame.
as you can see in the chart, has a side mode price, and we did this counting based on complex waves.
In this chart, first a zigzag is connected to a flat by an X-wave , and the last wave of this flat ( c-wave ) is completed in the form of a channel.
With the price coming out of the purple channel, we came to the conclusion that the felt is over and now we have considered two possibilities:
Probability 1: X-wave
Probability 2: Start of the leading waves
At the beginning, we considered the new wave to be an X-wave , which, using fibo and harmonic patterns , identified an area to form a wave from this X-wave .
We expect wave b in the form of a pullback to move to the purple channel to Fibonacci 0.618 and then continue its upward trend in the form of wave c.
If Fibo 0.618 is broken, this analysis will be fielded.
🙏If you have an idea that helps me provide a better analysis, I will be happy to write in the comments🙏
❤️Please, support this idea with a like and comment!❤️

AUDJPY | The best scenario for a fall📝Hello traders, Symbol AUDJPY, as you can see in the chart, has a side mode price, and we did this counting based on complex waves.
In this chart, first a zigzag is connected to a flat by an X-wave, and the last wave of this flat (c-wave) is completed in the form of a channel.
With the price coming out of the purple channel, we came to the conclusion that the felt is over and now we have considered two possibilities:
Probability 1: X-wave
Probability 2: Start of the leading waves
At the beginning, we considered the new wave to be an X-wave, which, using fibo and harmonic patterns, identified an area to form a wave from this X-wave.
We expect wave b in the form of a pullback to move to the purple channel to Fibonacci 0.618 and then continue its upward trend in the form of wave c.
If Fibo 0.618 is broken, this analysis will be fielded.
🙏If you have an idea that helps me provide a better analysis, I will be happy to write in the comments🙏
❤️Please, support this idea with a like and comment!❤️

AUDJPY Long into 82.750Confluences
a. Last week closure - Doji (150pips wick)
b. Expanding wedge
c. FIB 61.8% From push ( due to corrective)
d. Trendline
e. Break of trendline

AUDJPY
So hitting the bottom of the flag we expect to have a long uptrend.
Price : 83.100
S/L : 82.776
T/P : 88.900 - 90.125
Best Regards

AUDJPY-Short#AUDJPY
From this point only look out for selling opportunities.
REASON
The market has broken out of ascending correction and formed impuls and now has formed correction.
And correction zone is not able to cross the above resistance so there will be a short move.

AUDJPY Bullish Flag Breakout DownsideAs we see on the AUDJPY daily time frame Bullish Flag pattern breakout cleanly. We are going to open a short position from the 84.400 price level.

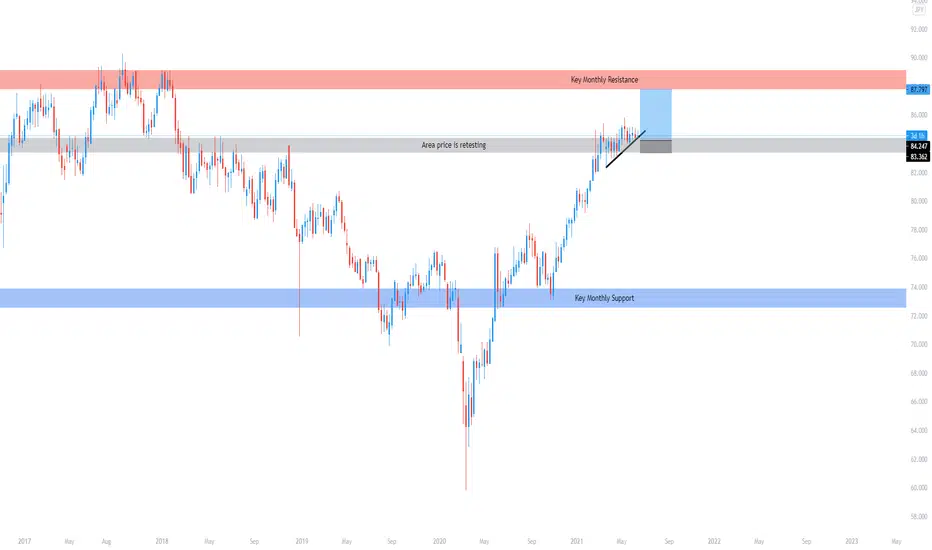
AUDJPY - Still LongPrice has broken above a resistance area and has now retested it, im expecting price to push higher into the monthly resistance area before looking for any short opportunities
AUDJPY 06th June - 11th June 2021Price movement forecast for the upcoming week in AUDJPY . Currently, the AUDJPY is in a very neutral position close to a distribution phase (Wyckoff Method). Please take not of the updated COT Data as well! Please, feel free to share your opinion with me.


#AUDJPY to seek for further uptrend#AUDJPY is a good moment to continue the bullish trend, but it could break the short-term trend

AUDJPY - Bullish Opportunities !Welcome to our Trade Setups - May 30th ( AUDJPY ) !
BUY AUDJPY
ENTRY LEVEL @ 84.734
SL @ 84.539
TP @ 85.124
Max Risk: 1% - 3%!
Risk/Reward Ratio: 2
Leave us a comment or like to keep our content for free and alive.
Have a great week everyone!
