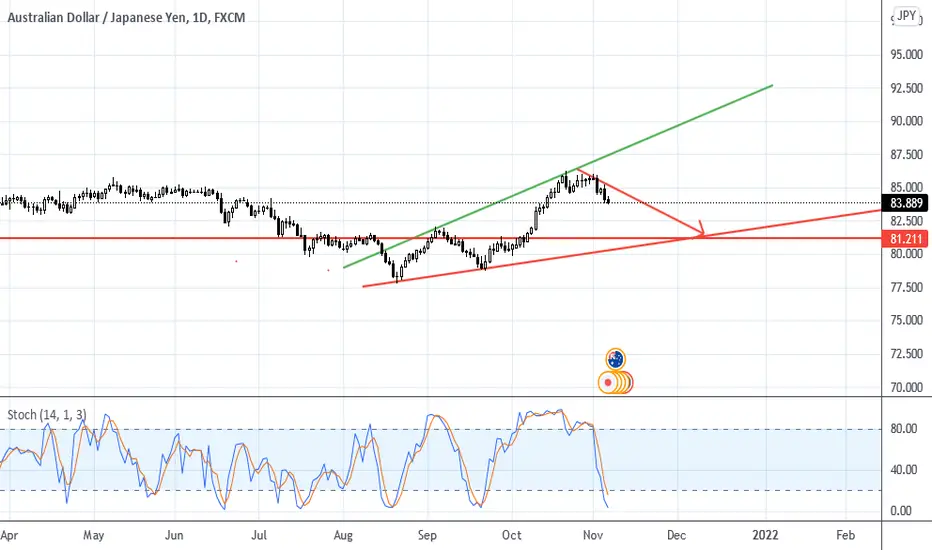
AUD/JPY BUY NOW.......
Hello Traders, here is the full analysis for this pair,
let me know in the comment section below if you have any questions,
the entry will be taken only if all rules of the strategies will be
satisfied. I suggest you keep this pair on your watch list and see if
the rules of your strategy are satisfied.
Dear Traders,
If you like this idea, do not forget to support with a like and follow.
PLZ! LIKE COMMAND AND SUBSCRIBE
Audjpyshort

AUDJPY 15MPlease take a look at the reasoning for taking shorts in the chart,
it lines up with the larger timeframe trend and includes best short
entries to reach target zones beyond the heavy order area.
(LTF should say HTF - higher timeframe)

audjpyAUDJPY - SHORT
Why are we entering?
- Expecting JPY strength after a short correction period (See JPY index)
- We look to be in a parallel bear flag
What are we waiting for to happen?
- price to retrace back to the structure and one of the fib levels
- Waiting to draw WFB
What is our confirmation?
- Break of WFB trendline once created
- Rejection of structure and parallel correction resistance
Entry
Safe Entry: Rejection of structure and then WFB (once correction is clearer)
Risk Entry: Rejection of structure and fib level
Once entered, where will our Stoploss be?
- above the rejected price
Where do we take profits?
- First TP: 81.6
- Second TP: 80.8

AUDJPY Swing trade idea. Great Risk to Reward potential.When we see a trade setup with this kind of Risk to Reward our Trade plan dictates that we must pull the trigger.
Ideally we would enter on a 30min trigger candle so a 20 pip rally from here would be ideal before we enter.

audjpyaudjpy broke early running over 80 pips, and you can enter again now it already broke the trendline trendline , look at the link below

SELL AUDJPYReason to enter sell
1. trendline (h4)
2. resistance zone (h4)
3. trendline & resistance confluence (h4)
4. massive bearish candle (w)
3. double top (w)
i think isn't good setup because zone in lower timeframe and major trend still uptrend, but you can try to enter sell with low risk and minimum risk ratio. enjoy!

audjpywe expect falling from 84.200 , Structure Alert - SHORT it is approaching structure level.
Keep an eye on for SELLS

Sell Opportunity on AUDJPYAUD - Weak Bearish
1️⃣ The RBA maintained interest rates at 0.10% and continued its asset purchase program of AUD 4 billion a week.
2️⃣ Australian jobs data is expected to weaken in October due to a fall in the manufacturing and services PMI.
3️⃣ The debt crisis of Chinese real estate companies resurfaced after Kaisa Group Holdings Ltd. and its Hong Kong-listed units were suspended from trading.
JPY - Strong Bullish
1️⃣ The decline in US Treasury bond yields supports the JPY.
2️⃣ Japanese Prime Minister Fumio Kishida is compiling an economic stimulus package on November 19 to help sentiment on the JPY.
=====
Technical
=====
The AUDJPY has broken and retested the previous support level.
=====
Risk to this trade
=====
Any change in sentiment could turn the pair's direction.
Don't forget to like, comment, and subscribe for more ideas.

AUDJPY BIG SELL INCOMING A triple top was formed at the top resistance forcing a reversal. The price broke support which has now turned into a resistance. Wil be looking to take short trades at the retest all the way to the TP's illustrated on the chart.


AUDJPY Short Trade Idea 💡 Hey traders, here is the analysis for the AUDJPY. Let me know if you guys have any questions in the comment section. If you guys like my analysis please hit like. Thanks. NOTE - Please do your own analysis before taking the trade.

AUD/JPY: PRICE ACTION ANALYSIS| SHORT SETUP...Welcome back Traders, Investors, and Community!
Check the Links on BIO and If you LIKE this analysis, Please support our Idea by hitting the LIKE 👍 button
Traders, if you like this idea or have your own opinion about it, please write your own in the comment box . We will be glad for this.
Feel free to request any pair/instrument analysis or ask any questions in the comment section below.
Have a Good Day Trading !

AUDJPY shortas we can see intraday charts (1 hour time frame) AUDJPY forming nice down trend. will see how price reaction to this order block. chart analysis on 1 hour timeframe.

audjpyAUDJPY - SHORT
Why are we entering?
- Price broke the ascending trendline = bearish
- Expecting further AUD weakness & JPY strength = AUDJPY SHORT
What are we waiting for to happen?
- price to retrace back to the structure and EMA
- Waiting to draw WFB
What is our confirmation?
- Break of WFB trendline
- Rejection of structure
- Rejection of EMA
Entry
Safe Entry: Rejection of structure and EMA and then WFB break
Risk Entry 1: Rejection of structure and EMA
Once entered, where will our Stoploss be?
- above the rejected price
Where do we take profits?
- First TP: 83
- Second TP: 81

AUDJPY Monthly Bear Flag PullbackBigger picture bigger timeframe view.
LL and LH on Monthly.
Pullback to bear flag break showing potentially good RR entry and longer term direction.
Longer term monthly target at 0.5 fib. Popular support at 72.
This could take a while.

AUD/JPY Market StructureLet's see how these psychological level are going to hold. 1% Risk on the long, 2% on the short (if price retraces & rejects the level)

AUDJPY - Short#AUDJPY H4
New Update But Still My Lat Analysis On AUDJPY Is Still Valid
More Down To Next Target TP2

AUDJPY | Sell on Strength AUDJPY after making a swing high, distribute itself and now making a move downward.
One should look to short it
Trade Plan
Sell Level 1 85.050
Sell Level 2 85.200
Stoploss 85.550
TP1 84.275
TP2 83.808
Can Short at Current levels also

Pitchfork and Supply - AUDJPY SHORT1. At the upper line of the pitchfork
2. At the supply line
Target to the point of confluence
Remember, points of confluence act as good magnets.


AUDJPY H4 ANALYSISPrice has rejected the 86.00 level numerous times. recent trendline break.
Looking for price to drop around the 84.73 and lower if we there is no support at that level.
Aussie is losing strength against yen to start off week. Looking for price to hold under 85.75

AUDJPY - SHORTPrice below local POC level. Sell on a false breakout! The target is next POC level.
AUDJPY - SHORT
ENTRY PRICE - 81.700
SL - 82.100
TP - 80.250
Always follow the 6 Golden Rules of Money Management:
1. Protect your gains and never enter into a position without setting a stop loss.
2. Always trade with a Risk-Reward Ratio of 1 to 1.5 or better.
3. Never over-leverage your account.
4. Accept your losses, move on to the next trade and trust the software.
5. Make realistic goals that can be achieved within reason.
6. Always trade with money you can afford to lose.
Please leave your comment and support me with like if you agree with my idea. If you have a different view, please also share with me your idea in the comments.
Have a nice day!
