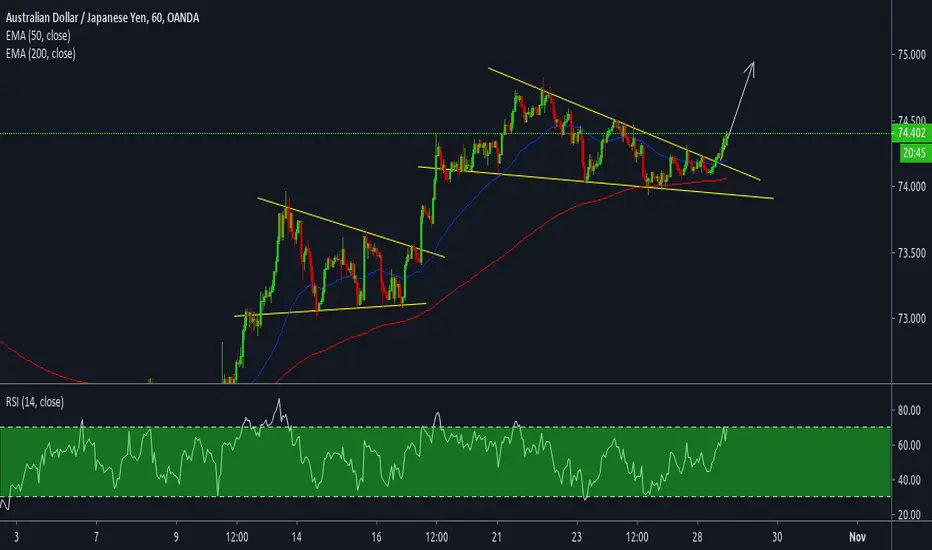
AUDJPY trade idea on H5Plan : wait for price to bounce off from horizontal or trendline support --> wait for the rejection candle pattern to form e.g. bullish engulfing, pinbar etc --> BUY
**Disclaimer** the content on this analysis is subject to change at any time without notice, and is provided for the sole purpose of assisting traders to make independent investment decisions.
Traders!! if you like my ideas and do take the same trade like i do, please write it in comment so we can manage the trade together.
_____________________________________________________________________________________________________________________
Thank you for your support ;)
GWBFX
Audjpysignal

AUDJPY 4H buy ideaMissed the entry now waiting for the pullback to complete and fill the order. Nice opportunity for a long.

AUDJPY sell on H3Plan : wait for price to bounce off from horizontal / trendline resistance --> wait for the rejection candle pattern to form e.g. bearish engulfing , pinbar etc --> SELL
**Disclaimer** the content on this analysis is subject to change at any time without notice, and is provided for the sole purpose of assisting traders to make independent investment decisions.
Traders!! if you like my ideas and do take the same trade like i do, please write it in comment so we can manage the trade together.
_____________________________________________________________________________________________________________________
Thank you for your support ;)
GWBFX


AUDJPY trade idea on H1Plan : wait for prices to bounce off horizontal support --> wait for the rejection candle pattern to form e.g. bullish engulfing , pinbar etc --> BUY
**Disclaimer** the content on this analysis is subject to change at any time without notice, and is provided for the sole purpose of assisting traders to make independent investment decisions.
Traders!! if you like my ideas and do take the same trade like i do, please write it in comment so we can manage the trade together.
_____________________________________________________________________________________________________________________
Thank you for your support ;)
GWBFX

Bearish ChangeAUDJPY is telling a bearish story. More details on Chart.
Use the Law of Supply and Demand to Read the Charts properly

AUDJPY 15MHello Traders,
on this sell trade we have an initial target
of 8.8 pips and 2nd target set at 20 pips,
all with immediate momentum.
The stop loss is at the red line up high.
Best,
Jay

AUDJPY LONG TRADE OPPORTUNITY.In the name of Allah, the Most Gracious, the Most Merciful.
We are doing some Analysis in AUDJPY in the daily Time frame.
Right now You can see on the chart that the market is forming rising wedge patter there is 80%
the probability of Market move upside because on a weekly time frame there is Falling wedge pattern which will break to the upside. if you want to take trade then follow the Risk to Reward &
Risk management strategy use Stop loss or take profit as shown on the chart
IT IS HIGHLY RECOMMENDED TO FOLLOW RISK MANAGEMENT STRATEGY.
HOW TO TRADE ON OUR SIGNALS.
We Explain above you use that lot size whatever Capital you have.
Let say, for example, you have 4000 Dollars Capital.
We Posted Trade which has 4 Take Profit.
We will use 0.20 Total lot size We will divide it
in 4 Orders.
0.20 lot Divided by 4 Take profit = 0.05 Lot size.
So we will open 4 Trade with 0.05 Lot size for each trade.
Let See How We will do.
1st Trade 0.05 Lot: Stop loss Same >> Take profit will set to First target.
2nd Trade 0.05 Lot: Stop loss Same >> Take profit will set to Second target.
3rd Trade 0.05 Lot: Stop loss Same >> Take profit will set to the Third target.
4th Trade 0.05 Lot: Stop loss Same >> Take profit will set to the fourth target.
Let Say Our First Target Hitted Then you need to Move All Remaining Trade stop loss to Entry.
If Our Second Target Hitted Then You Need to move All Remaining Trade stop loss to First Target.
If our Third Target Hitted then You need to move All Remaining Trade stop loss to Second Target and So On.
Note: This is only for Educational purposes; this is not investment advice.
Thanks
Adil Khan.

AUDJPY 15MHello traders!
This is a Tag&Go setup short, a sell stop order,
set and forget style is right on the red line at
73.662
The red circle is the stop and 1st and 2nd
targets are in green below.
Best,
Jay


AUDJPY Analysis: Rising channel breakout - retestingHi traders,
The price broke from the rising channel and is now completing the retest.
I see a high likelihood of the price going downwards if the retest will be successful.
Breaking of the price back into the channel will invalidate this analysis.


AUDJPY (MONTHLY) | LONG TERM SPECULATION*Price action is presently hovering around the 70.000/72.000 zone which is a major support.
*Also, put into consideration that price has been consolidating between this support @ 70.000 and resistance @ 90.000 zone since 1996.
*However, if the price breaks the 70.000 zone; we might be looking at a downward rally to test support @ 55.000 (which also happened in 2001 and 2009) and if price rejects this 70.000 zone, we might be looking at a consolidation into the 90.000 zone.
*We are at a crossroad and important that we keep watching the character of the price at the present zone (70.000/72.000) before making any execution.
*Lower time frame speculation shall be published as we continue to monitor price action in the present zone.

Sell AUDJPYAUDJPY
SELL
SL: 75.610
TP: 74.770
Check out my FREE Telegram channel to receive instant NOTIFICATION.
Telegram: SamuelFelixClub or SamuelFelix4Real
One of every 10 subscribers on my Telegram channel gets $100 credit. Don't miss it!

POTENTIAL BULLISH MOVE ON AUDJPY We have AUDJPY Showing bullish potential. Price has moved up bullish and met some point of resistance where we may see price retrace to the price level i have marked with the grey horizontal line. From this point, we may see price move up bullish to the price level i have marked with the green line which would be our take profit.
Risk on this trade - 1%
Risk to reward ratio - 1:2
Hit that follow button for more analysis! :)

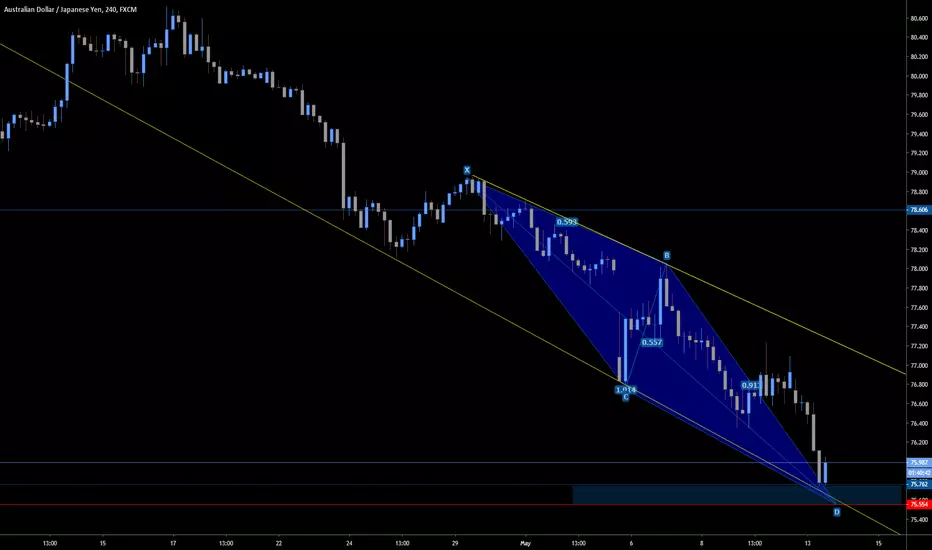
AUDJPY Harmonic AB=CD Pattern Analysis and StrategyHere is an updated chart on showing the completion of an AB=CD harmonic pattern on the 4 hr chart. Price action has found support at the completion of the pattern (the blue zone). Price has reached a major weekly support zone as well (red zone) signaling a reversal to the upside, therefore our strategy is to trade the reversal. FX:AUDJPY

AUJJPY H1 SHORTGARTLY FORM ON AUDJPY H1 OUR PREVIOUS SIGNALS NZDJPY BUY AND GBPJPY ARE IN VERY GOOD PROFIT

