AUDUSD: Gold Breakout & DXY Resistance Could Fuel Bulls!!Hey Traders,
In tomorrow’s session, we’re eyeing a buying opportunity on AUDUSD around the 0.65100 zone. The pair remains in an uptrend and is currently in a correction phase, approaching a key support level at 0.65100.
We’re also keeping a bullish bias on Gold, which is attempting to break and hold above 3,400. Given the positive correlation between Gold and AUDUSD, this could lend additional upside momentum to the pair.
Meanwhile, the DXY is approaching the 98.300 resistance. A rejection from this level could serve as a strong catalyst for AUDUSD bulls.
Trade safe, Joe.
AUDUSD

XAU/USD | Gold at Make-or-Break $3400! BUY or SHORT ? (READ)By analyzing the gold chart on the 4-hour timeframe, we can see that, as expected from the previous analysis, the price began to rise and gained over 250 pips, reaching the $3409 supply zone. Upon hitting this key level, gold faced selling pressure and dropped more than 290 pips down to $3380. When it returned to this important level, strong buying stepped in again, and it is now trading around $3391.
The total return from this analysis so far has been over 540 pips. If gold manages to hold above $3400, the next upside targets will be $3409, $3416, and $3419. Keep an eye on the $3419–$3434 zone for potential reactions. Show some strong support for this analysis, friends, and stay tuned for direct trade setups based on it!
THE Previous Analysis :
Best Regards , Arman Shaban

AUDUSD Continues the UP Move ??!!After touching strong downs on every larger time frame, AUDUSD Continues to catch the Bullish Momentum. Check your support and resistances and open positions accordingly. Wait for Price Again and strong solid breakouts to enter the market.
Disclaimer:
The content presented in this IMAGE is intended solely for educational and informational purposes. It does not constitute financial, investment, or trading advice.
Trading foreign exchange (Forex) on margin involves a high level of risk and may not be suitable for all investors. The use of leverage can work both for and against you. Before deciding to participate in the Forex market, you should carefully consider your investment objectives, level of experience, and risk tolerance.
There is a possibility that you may incur a loss of some or all of your initial investment, and therefore, you should not invest money that you cannot afford to lose. Be fully aware of all the risks associated with foreign exchange trading, and seek advice from a licensed and independent financial advisor if you have any doubts.
Past performance is not indicative of future results. Always trade responsibly.

AUDUSD: Rate Cut Tuesday + Price At A Daily -FVG! Time To Sell?Welcome back to the Weekly Forex Forecast for the week of Aug 11 - 15
In this video, we will analyze the following FX market: AUDUSD
AUDUSD has been difficult to trade, as it chops its slow grind upwards. Then last, although the week's trading range was small, the Weekly candle closed as a bearish Inside Bar. This, as price made contact with a -FVG! The scenario could be laying the ground work for a new bearish leg to form.
Couple the above with an interest rate cut coming Tuesday for the AUD, and August being a historically bad month for the aussie, things could get real interesting for sellers next week.
Enjoy!
May profits be upon you.
Leave any questions or comments in the comment section.
I appreciate any feedback from my viewers!
Like and/or subscribe if you want more accurate analysis.
Thank you so much!
Disclaimer:
I do not provide personal investment advice and I am not a qualified licensed investment advisor.
All information found here, including any ideas, opinions, views, predictions, forecasts, commentaries, suggestions, expressed or implied herein, are for informational, entertainment or educational purposes only and should not be construed as personal investment advice. While the information provided is believed to be accurate, it may include errors or inaccuracies.
I will not and cannot be held liable for any actions you take as a result of anything you read here.
Conduct your own due diligence, or consult a licensed financial advisor or broker before making any and all investment decisions. Any investments, trades, speculations, or decisions made on the basis of any information found on this channel, expressed or implied herein, are committed at your own risk, financial or otherwise.

Market Analysis: AUD/USD Much Higher—Uptrend Shows StrengthMarket Analysis: AUD/USD Much Higher—Uptrend Shows Strength
AUD/USD started a decent increase above the 0.6480 and 0.6500 levels.
Important Takeaways for AUD/USD Analysis Today
- The Aussie Dollar started a decent increase above the 0.6450 level against the US Dollar.
- There is a connecting bearish trend line forming with resistance at 0.6530 on the hourly chart of AUD/USD.
AUD/USD Technical Analysis
On the hourly chart of AUD/USD, the pair started a fresh increase from the 0.6450 support. The Aussie Dollar was able to clear the 0.6470 resistance to move into a positive zone against the US Dollar.
There was a close above the 0.6500 resistance and the 50-hour simple moving average. Finally, the pair tested the 0.6540 zone. A high was formed near 0.6541 and the pair recently started a consolidation phase.
There was a move below the 23.6% Fib retracement level of the upward move from the 0.6449 swing low to the 0.6541 high. On the downside, initial support is near the 0.6510 level.
The next major support is near the 0.6495 zone or the 50% Fib retracement level. If there is a downside break below 0.6495, the pair could extend its decline toward the 0.6470 level. Any more losses might signal a move toward 0.6450.
On the upside, the AUD/USD chart indicates that the pair is now facing resistance near 0.6530. There is also a connecting bearish trend line forming with resistance at 0.6530.
The first major resistance might be 0.6540. An upside break above it might send the pair further higher. The next major resistance is near the 0.6580 level. Any more gains could clear the path for a move toward the 0.6600 resistance zone.
This article represents the opinion of the Companies operating under the FXOpen brand only. It is not to be construed as an offer, solicitation, or recommendation with respect to products and services provided by the Companies operating under the FXOpen brand, nor is it to be considered financial advice.

AUD/USD Show Mixed Signals,Market Sentiment Remains Wait-and-SeeThe Dollar Index kicked off the new week with an optimistic tone; however, the overall outlook for the currency appears to be in a state of hesitation. In my view, August may likely see limited volatility, with few significant movements on the horizon. Meanwhile, AUD futures (6A1!) indicate a consolidation around a previous supply zone, suggesting a potential pullback before reaching the next major supply level. Additionally, data shows an increase in short positions among non-commercial traders, which could hint at a possible bearish trend emerging in the near future.
✅ Please share your thoughts about AUDUSD in the comments section below and HIT LIKE if you appreciate my analysis. Don't forget to FOLLOW ME; you will help us a lot with this small contribution.

Bearish reversal?The Aussie (AUD/USD) is rising towards the pivot and could reverse to the 1st support that aligns with the 138.2% Fibonacci extension.
Pivot: 0.6532
1st Support: 0.6383
1st Resistance: 0.6625
Risk Warning:
Trading Forex and CFDs carries a high level of risk to your capital and you should only trade with money you can afford to lose. Trading Forex and CFDs may not be suitable for all investors, so please ensure that you fully understand the risks involved and seek independent advice if necessary.
Disclaimer:
The above opinions given constitute general market commentary, and do not constitute the opinion or advice of IC Markets or any form of personal or investment advice.
Any opinions, news, research, analyses, prices, other information, or links to third-party sites contained on this website are provided on an "as-is" basis, are intended only to be informative, is not an advice nor a recommendation, nor research, or a record of our trading prices, or an offer of, or solicitation for a transaction in any financial instrument and thus should not be treated as such. The information provided does not involve any specific investment objectives, financial situation and needs of any specific person who may receive it. Please be aware, that past performance is not a reliable indicator of future performance and/or results. Past Performance or Forward-looking scenarios based upon the reasonable beliefs of the third-party provider are not a guarantee of future performance. Actual results may differ materially from those anticipated in forward-looking or past performance statements. IC Markets makes no representation or warranty and assumes no liability as to the accuracy or completeness of the information provided, nor any loss arising from any investment based on a recommendation, forecast or any information supplied by any third-party.

Potential bearish drop?AUD/USD is reacting off the resistance level, which is a pullback resistance, and could drop from this level to our take-profit.
Entry: 0.6532
Why we like it:
There is a pullback resistance level.
Stop loss: 0.6580
Why we like it:
There is a pullback resistance level that aligns with the 78.6% Fibonacci retracement.
Take profit: 0.6481
Why we like it:
There is a pullback support level that lines up with the 50% Fibonacci retracement.
Enjoying your TradingView experience? Review us!
Please be advised that the information presented on TradingView is provided to Vantage (‘Vantage Global Limited’, ‘we’) by a third-party provider (‘Everest Fortune Group’). Please be reminded that you are solely responsible for the trading decisions on your account. There is a very high degree of risk involved in trading. Any information and/or content is intended entirely for research, educational and informational purposes only and does not constitute investment or consultation advice or investment strategy. The information is not tailored to the investment needs of any specific person and therefore does not involve a consideration of any of the investment objectives, financial situation or needs of any viewer that may receive it. Kindly also note that past performance is not a reliable indicator of future results. Actual results may differ materially from those anticipated in forward-looking or past performance statements. We assume no liability as to the accuracy or completeness of any of the information and/or content provided herein and the Company cannot be held responsible for any omission, mistake nor for any loss or damage including without limitation to any loss of profit which may arise from reliance on any information supplied by Everest Fortune Group.
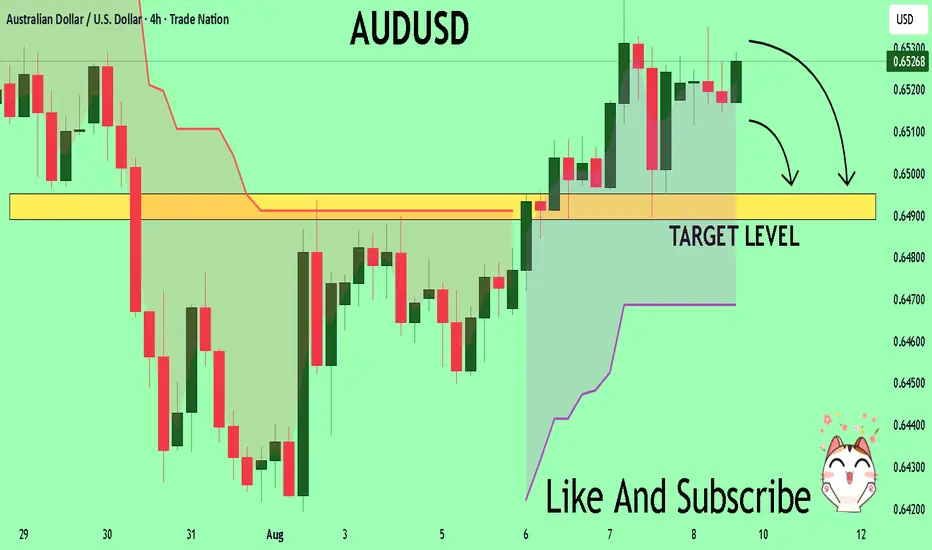
AUDUSD corrective pullback support at 0.6420Trend Overview:
The AUDUSD currency price remains in a bullish trend, characterised by higher highs and higher lows. The recent intraday price action is forming a continuation consolidation pattern, suggesting a potential pause before a renewed move higher.
Key Technical Levels:
Support: 0.6420 (primary pivot), followed by 0.6400 and 0.6370
Resistance: 0.6560 (initial), then 0.6590 and 0.6620
Technical Outlook:
A pullback to the 0.6420 level, which aligns with the previous consolidation zone, could act as a platform for renewed buying interest. A confirmed bounce from this support may trigger a continuation toward the next resistance levels at 0.6560, 0.6590, and ultimately 0.6620.
Conversely, a daily close below 0.6420 would suggest weakening bullish momentum. This scenario would shift the bias to bearish in the short term, potentially targeting 0.6400 and 0.6370 as downside levels.
Conclusion:
AUDUSD maintains a bullish structure while trading above the 0.6420 support. A bounce from this level would validate the consolidation as a continuation pattern. The loss of this level and a daily close below would suggest deeper corrective risk.
This communication is for informational purposes only and should not be viewed as any form of recommendation as to a particular course of action or as investment advice. It is not intended as an offer or solicitation for the purchase or sale of any financial instrument or as an official confirmation of any transaction. Opinions, estimates and assumptions expressed herein are made as of the date of this communication and are subject to change without notice. This communication has been prepared based upon information, including market prices, data and other information, believed to be reliable; however, Trade Nation does not warrant its completeness or accuracy. All market prices and market data contained in or attached to this communication are indicative and subject to change without notice.

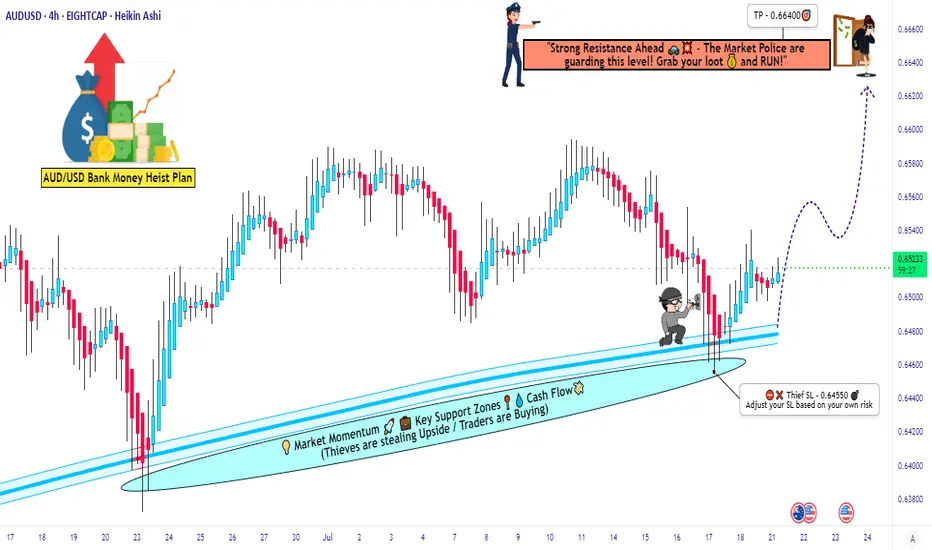
Ready for the Aussie Heist? Is This the Perfect Entry?🚨💰 - "The Aussie Vault Raid: Bullish Robbery in Progress!" 💰🚨
AUD/USD Forex Trade Idea (Thief Style Swing/Day Plan)
📈🔥 Designed for Thief Traders, Market Robbers & Money Makers Worldwide 🤑🐱👤💸
🌍 Hello Global Robbers!
🌟 Hola! Ola! Bonjour! Hallo! Salaam! Konnichiwa! 🌟
Welcome to another bold heist plan from the Thief Trading Crew. This one’s a high-stakes raid on the AUD/USD — "The Aussie" — using our signature Thief Trading Style, combining raw technical setups with real macro/fundamental edge. We're eyeing the Bullish Vault Breakout, so tighten up your gloves — it’s time to rob smart, not hard.
🔓💸 ENTRY PLAN – “The Vault is Unlocked!”
Grab the bullish loot at any valid price zone — but here’s how real thieves move:
📍 Recommended Entry Style:
Use Buy Limit Orders near local swing lows, demand zones, or key pullback entries on the 15m to 30m chart.
Execute DCA (Dollar Cost Averaging) / Layered Orders for more precision.
Align with your MA lines & candle structures for max confirmation.
🛑 STOP LOSS – “Escape Route Secured”
📍 SL hidden beneath recent swing lows below MA (on 4H):
🎯 Suggested Level: 0.64550
💡 Custom-fit your SL based on:
Trade size
Number of active positions
Account risk strategy
🎯 PROFIT TARGET – “Cash Out Before the Cops Show!”
🏴☠️ Take-Profit Zone: 0.66400
This is our bullish breakout reward zone — a high-value zone where profit meets safety.
🔍 MARKET OUTLOOK – "Cops Are Watching, but We're Ahead..."
📈 The AUD/USD market is flashing bullish momentum, supported by:
✅ Risk sentiment flow
✅ US Dollar weakness and rate expectations
✅ Intermarket signals from commodities (Gold/Iron)
✅ Positive macro positioning from smart money (via COT)
✅ Technical demand forming reversal patterns from oversold zones
📎 For a deeper breakdown —
📰 Fundamentals | COT Reports | Sentiment | Intermarket Analysis — Check Klick 🔗
⚠️ THIEF ALERT – “Avoid Sirens. Watch the News.”
Stay out of trouble by following these protocols during major news events:
🚫 Don’t enter trades blindly before/after big news
📍 Use trailing stops to protect gains
🔄 Adjust SL/TP if price nears breakout points during volatility
💥 SUPPORT THE CREW – “Smash That Boost Button!”
Love the plan? Then Boost this chart to show love for the Thief Trading Movement.
Every like, comment, and boost adds power to our robbery network across the globe. 🌍❤️💰
⚖️ DISCLAIMER – “Not Financial Advice, Just Thief Vibes”
📌 This analysis is for educational and entertainment purposes only.
📌 Trade at your own risk and always do your own analysis.
📌 Market moves fast — stay sharp, stay stealthy.
**🎭 See you at the next heist.
Until then, trade rich. Rob wise.
Thief Trader out. 🐱👤💰📉📈**
AUDUSD H4 | Falling towards 50% Fibonacci support AUSSIE (AUD/USD) is falling towards the buy entry at 0.6471, which is a pullback support that lines up with the 50% Fibonacci retracement and could bounce to the take profit.
Stop loss is at 0.6452, which is a swing low support that is slightly above the 78.6% Fibonacci retracement.
Take profit is at 0.6539, which is a pullback resistance.
High Risk Investment Warning
Trading Forex/CFDs on margin carries a high level of risk and may not be suitable for all investors. Leverage can work against you.
Stratos Markets Limited (tradu.com ):
CFDs are complex instruments and come with a high risk of losing money rapidly due to leverage. 65% of retail investor accounts lose money when trading CFDs with this provider. You should consider whether you understand how CFDs work and whether you can afford to take the high risk of losing your money.
Stratos Europe Ltd (tradu.com ):
CFDs are complex instruments and come with a high risk of losing money rapidly due to leverage. 66% of retail investor accounts lose money when trading CFDs with this provider. You should consider whether you understand how CFDs work and whether you can afford to take the high risk of losing your money.
Stratos Global LLC (tradu.com ):
Losses can exceed deposits.
Please be advised that the information presented on TradingView is provided to Tradu (‘Company’, ‘we’) by a third-party provider (‘TFA Global Pte Ltd’). Please be reminded that you are solely responsible for the trading decisions on your account. There is a very high degree of risk involved in trading. Any information and/or content is intended entirely for research, educational and informational purposes only and does not constitute investment or consultation advice or investment strategy. The information is not tailored to the investment needs of any specific person and therefore does not involve a consideration of any of the investment objectives, financial situation or needs of any viewer that may receive it. Kindly also note that past performance is not a reliable indicator of future results. Actual results may differ materially from those anticipated in forward-looking or past performance statements. We assume no liability as to the accuracy or completeness of any of the information and/or content provided herein and the Company cannot be held responsible for any omission, mistake nor for any loss or damage including without limitation to any loss of profit which may arise from reliance on any information supplied by TFA Global Pte Ltd.
The speaker(s) is neither an employee, agent nor representative of Tradu and is therefore acting independently. The opinions given are their own, constitute general market commentary, and do not constitute the opinion or advice of Tradu or any form of personal or investment advice. Tradu neither endorses nor guarantees offerings of third-party speakers, nor is Tradu responsible for the content, veracity or opinions of third-party speakers, presenters or participants.

RBA poised to lower rates, Australian dollar in holding patternThe Australian dollar is coming off a strong week, gaining almost 1% against the US dollar. In Monday's European session, AUD/USD is almost unchanged at 0.6521.
The Reserve Bank of Australia is virtually certain to lower rates at Tuesday's meeting. This would be the third cut of 2025 and would lower the cash rate to 3.60%, its lowest level since April 2023. This indicates a gradual, cautious approach to lowering rates.
The RBA had a trick up its sleeve in July, when it opted to hold rates. The markets had widely expected a rate cut but the RBA said that it wanted to see additional inflation data before delivering a rate cut.
Inflation has been cooling, as CPI for the second quarter nudged down to 2.1% y/y, down from 2.4% in Q1. This strongly supports the case for a rate cut as CPI has fallen close to the lower band of the RBA's 2%-3% target. Core inflation has also been easing lower. As well, the labor market is showing signs of cooling and the central bank wants to avoid a sharp deterioration in employment data.
With today's move practically a given, investors will be looking for hints about further cuts. Governor Bullock has sounded cautious, noting that inflation remains sticky and there is continuing uncertainty over US tariffs.
Australian goods face a low 10% US tariff, which is not expected to have a significant impact on the economy. However, US tariffs on China, which is Australia's largest trading partner, could weigh on economic growth.
In the US, it's a very light calendar with no tier-1 events. On Tuesday, the US releases CPI for July, which is expected to tick up to 2.8% from 2.7% in June.
AUD/USD is testing support at 0.6414. Below, there is support at 0.6506
There is resistance at 0.6529 and 0.6536
AUSDUSD 4Hour TF - August 10th ,2025🟦 AUDUSD 4H Analysis
📅 August 10, 2025
Top-Down Trend Bias:
• Monthly – Bearish
• Weekly – Bearish
• Daily – Bearish
• 4H – Bullish
AUDUSD is currently resting around our key zone at 0.6500 after a bullish push on the 4H. Higher timeframes remain bearish, making this a potential area for sellers to re-enter the market.
🔍 Key Zone: 0.6500
This level aligns with prior structure and could serve as a rejection point for either a bullish or bearish short term move.
✅ Scenario A: Bearish Continuation (Orange Path)
1.If price taps 0.6500 and rejects
2.Look for bearish confirmation (engulfing, LTF BOS, rejection wicks)
Target 1: 0.6350 support
This is the trend aligned setup and holds higher probability given the HTF bias.
⚠️ Scenario B: Bullish Breakout (Blue Path)
1.If price rejects 0.6500
2.Could open the door to 0.6585 resistance zone
3.Would indicate a stronger bullish correction within the broader downtrend
This path is counter-trend on HTFs and requires solid confirmation.
🧠 Final Notes
• Higher timeframe structure is bearish, so shorts are favored unless 0.6500 holds
• Patience is key let the level confirm before entering
• Manage risk carefully, especially on counter-trend setups

AUD/USD SHORT FROM RESISTANCE
Hello, Friends!
We are now examining the AUD/USD pair and we can see that the pair is going up locally while also being in a uptrend on the 1W TF. But there is also a powerful signal from the BB upper band being nearby, indicating that the pair is overbought so we can go short from the resistance line above and a target at 0.644 level.
Disclosure: I am part of Trade Nation's Influencer program and receive a monthly fee for using their TradingView charts in my analysis.
✅LIKE AND COMMENT MY IDEAS✅

AUDUSD Breakout Setup: Ready for Lift-Off!Hey Guys,
I’ve analyzed the AUDUSD pair for you. If the 0.65245 level breaks to the upside, my target will be 0.65416.
If it doesn’t break, I’ll be looking to buy around 0.65047 or 0.64954.
Either way, my final target remains 0.65416.
In this analysis, I’ve highlighted two key levels and shared my target. I’m planning to buy from these zones.
Every single like from you is my biggest source of motivation to keep sharing these analyses. Huge thanks to everyone who supports by liking!

AUDUSD What Next? SELL!
My dear followers,
This is my opinion on the AUDUSD next move:
The asset is approaching an important pivot point 0.6526
Bias - Bearish
Technical Indicators: Supper Trend generates a clear short signal while Pivot Point HL is currently determining the overall Bearish trend of the market.
Goal - 0.6495
About Used Indicators:
For more efficient signals, super-trend is used in combination with other indicators like Pivot Points.
Disclosure: I am part of Trade Nation's Influencer program and receive a monthly fee for using their TradingView charts in my analysis.
———————————
WISH YOU ALL LUCK
AUDUSD Bullish Bias!
HI,Traders !
#AUDUSD is trading in a
Local uptrend and the
Pair made a retest of the
Horizontal support of 0.64796
And we are already seeing
A bullish rebound so we
Will be expecting a further
Bullish move up !
Comment and subscribe to help us grow !

AUDUSD – Plan Ready for Both ScenariosWe're patiently waiting for price to reach our key zone. If we get a valid sell signal, we’ll take the short.
But if the market breaks above this level with strength and gives us a clean pullback, we’re ready to go long.
No guessing. No hoping. Just reacting to what the market shows us.
📌 Discipline over prediction.

AUD/USD Pullback or Trap? Key Level in FocusPrice has slipped below the rising channel and is now pulling back to retest the breakdown area. This retest could decide the next move.
If buyers fail to step in here, and price gets rejected again, it may signal the start of a deeper correction. However, reclaiming the channel could flip the bias back to bullish.

XAU/USD | Gold at a Turning Point – Breakout or Breakdown Ahead?By analyzing the gold chart on the 4-hour timeframe, we can see that after our last analysis, gold continued its correction and dropped to $3358. It’s currently trading around $3367, and for the bullish scenario to remain valid, we need to see price hold above $3358 and soon close above $3370. If this happens, another bullish move could follow.
Otherwise, if gold breaks and stabilizes below $3358, this scenario will be invalidated, and the alternative outlook suggests further downside toward $3349 and $3339. This analysis will be updated — and don’t forget to show your support, friends!
Please support me with your likes and comments to motivate me to share more analysis with you and share your opinion about the possible trend of this chart with me !
Best Regards , Arman Shaban

AUD bullish swing setupBull points
RSI div
Trend reversal
RRR 1:2
Manage your risk for longer holding

AUDUSD – DAILY FORECAST Q3 | W32 | D7 | Y25📊 AUDUSD – DAILY FORECAST
Q3 | W32 | D7 | Y25
Daily Forecast 🔍📅
Here’s a short diagnosis of the current chart setup 🧠📈
Higher time frame order blocks have been identified — these are our patient points of interest 🎯🧭.
It’s crucial to wait for a confirmed break of structure 🧱✅ before forming a directional bias.
This keeps us disciplined and aligned with what price action is truly telling us.
📈 Risk Management Protocols
🔑 Core principles:
Max 1% risk per trade
Only execute at pre-identified levels
Use alerts, not emotion
Stick to your RR plan — minimum 1:2
🧠 You’re not paid for how many trades you take, you’re paid for how well you manage risk.
🧠 Weekly FRGNT Insight
"Trade what the market gives, not what your ego wants."
Stay mechanical. Stay focused. Let the probabilities work.
FX:AUDUSD

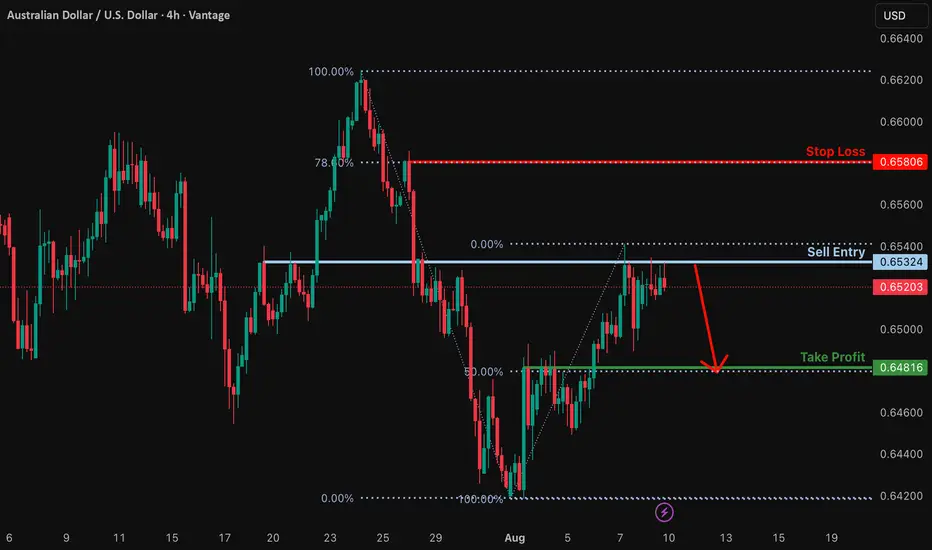
AUDUSD H4 | Bearish reversal off overlap resistanceThe Aussie (AUD/USD) is rising towards the sell entry which acts as an overlap resistance that aligns with the 61.8% Fibonacci retracement and could drop from this level to the take profit.
Sell entry is at 0.6541, which is an overlap resistance that lines up with the 61.8% Fibonacci retracement.
Stop loss is at 0.6581, which is a pullback resistance that lines up with the 78.6% Fibonacci retracement.
Take profit is at 0.6480, which is a pullback support.
High Risk Investment Warning
Trading Forex/CFDs on margin carries a high level of risk and may not be suitable for all investors. Leverage can work against you.
Stratos Markets Limited (tradu.com ):
CFDs are complex instruments and come with a high risk of losing money rapidly due to leverage. 65% of retail investor accounts lose money when trading CFDs with this provider. You should consider whether you understand how CFDs work and whether you can afford to take the high risk of losing your money.
Stratos Europe Ltd (tradu.com ):
CFDs are complex instruments and come with a high risk of losing money rapidly due to leverage. 66% of retail investor accounts lose money when trading CFDs with this provider. You should consider whether you understand how CFDs work and whether you can afford to take the high risk of losing your money.
Stratos Global LLC (tradu.com ):
Losses can exceed deposits.
Please be advised that the information presented on TradingView is provided to Tradu (‘Company’, ‘we’) by a third-party provider (‘TFA Global Pte Ltd’). Please be reminded that you are solely responsible for the trading decisions on your account. There is a very high degree of risk involved in trading. Any information and/or content is intended entirely for research, educational and informational purposes only and does not constitute investment or consultation advice or investment strategy. The information is not tailored to the investment needs of any specific person and therefore does not involve a consideration of any of the investment objectives, financial situation or needs of any viewer that may receive it. Kindly also note that past performance is not a reliable indicator of future results. Actual results may differ materially from those anticipated in forward-looking or past performance statements. We assume no liability as to the accuracy or completeness of any of the information and/or content provided herein and the Company cannot be held responsible for any omission, mistake nor for any loss or damage including without limitation to any loss of profit which may arise from reliance on any information supplied by TFA Global Pte Ltd.
The speaker(s) is neither an employee, agent nor representative of Tradu and is therefore acting independently. The opinions given are their own, constitute general market commentary, and do not constitute the opinion or advice of Tradu or any form of personal or investment advice. Tradu neither endorses nor guarantees offerings of third-party speakers, nor is Tradu responsible for the content, veracity or opinions of third-party speakers, presenters or participants.
