Bitcoin plummets!!Good day traders, I am back with yet another update on BTC/USD. My last update on bitcoin what I was expecting price to do unfortunately did not happen as price was very weak, I had a FVG(SIBI) that I really wanted price to revisit and the two price levels that make up the SIBI are 107752 and 107149.
Now that both our sellside liquidity were taken does that mean price is now gonna look for the buyside liquidity? My honest opinion is I don't think because I said 97k is insight and I believe it can still happen and it will according to my HTF perspective.
On the daily TF we have clear sight of relative highs that we wanna see price take and that might happen today but my short term objective is the high that was booked on Tuesday. That Tuesday's candlestick has a very large wick and from my time learning with ICT's content, wicks contain a lot of price data that can be used either for entries or exits.
4H- Here we had a shift in market structure lower on Thursday but price has been bullish ever since the shift happened. On this respective TF we have equal highs too, and ICT teaches us to always focus our attention on them mainly because price looks for liquidity and imbalances on the 4 hour TF...should we look closely on the left of our screens or chart, there is an order block from the wick I mentioned above. Again what are the rules of an order block?..
FROM TOMORROW PRICE WILL START TO PLUMMET!!
AUDUSD

AUDUSD Start of Week DropThe DXY index has double bottomed and left a significant FVG at around $1. This has yet to retrace and market sentiment towards seeing the USD under $1 is tough. This FVG is likely to close this week as a last ditch effort to hold the USD at $1 level.
We have business confidence news twice in the early week that is likely to be not great pressuring the AUD, then later on we have USD news that will likely hold or temporarily bolster USD confidence. This is the dynamics shift that I believe will bring on that larger retracement of the USD to $1.
Be ready for a significant rejection once we arrive at the FVG though.

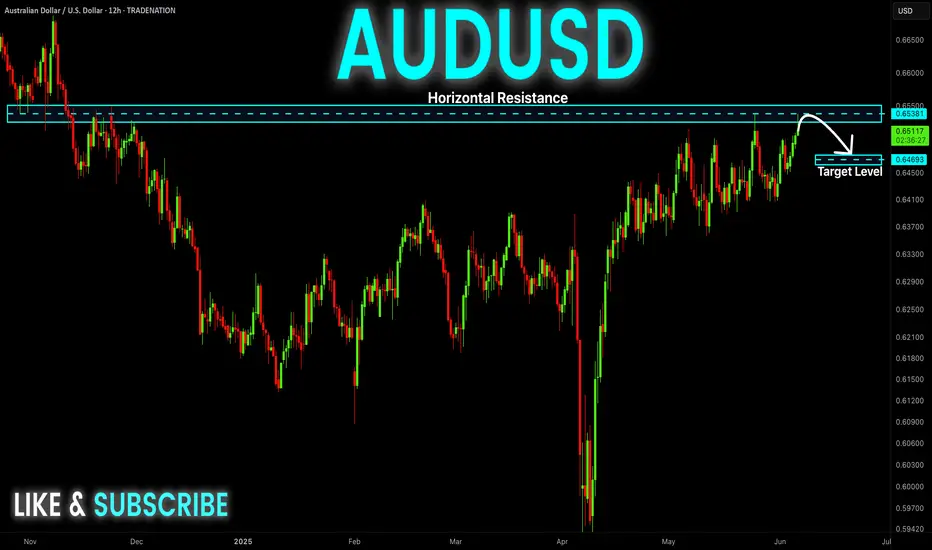
AUDUSD Will Fall! Short!
Take a look at our analysis for AUDUSD.
Time Frame: 5h
Current Trend: Bearish
Sentiment: Overbought (based on 7-period RSI)
Forecast: Bearish
The market is testing a major horizontal structure 0.649.
Taking into consideration the structure & trend analysis, I believe that the market will reach 0.645 level soon.
P.S
Overbought describes a period of time where there has been a significant and consistent upward move in price over a period of time without much pullback.
Disclosure: I am part of Trade Nation's Influencer program and receive a monthly fee for using their TradingView charts in my analysis.
Like and subscribe and comment my ideas if you enjoy them!

AUDUSD sideways consolidation supported at 0.6360The AUD/USD pair maintains a bullish bias, underpinned by a steady rising trend on the higher timeframes. However, recent intraday price action shows consolidation, indicating a pause in upward momentum as the market awaits a fresh catalyst.
Key Technical Levels:
Support:
0.6360 – Critical near-term support and prior consolidation zone. A successful retest could reinforce the bullish setup.
0.6320 – Next support level; a break below 0.6360 may trigger a deeper pullback.
0.6280 – Broader downside support zone; loss of this level would signal a shift in trend.
Resistance:
0.6500 – Primary upside target on continuation of bullish momentum.
0.6530 – Secondary resistance; break above would confirm strength.
0.6570 – Long-term resistance zone; potential target if bullish momentum accelerates.
Technical Outlook:
A pullback to 0.6360 followed by a bullish rebound would suggest continuation of the current uptrend, opening room for gains toward 0.6500, 0.6530, and 0.6570 over the medium term. On the downside, a daily close below 0.6360 would invalidate the bullish setup, exposing the pair to a potential decline toward 0.6320 and 0.6280.
Conclusion:
AUD/USD remains in a bullish structure, but near-term direction depends on the 0.6360 level. A rebound from support keeps the upside scenario in play, while a confirmed break lower may lead to a corrective retracement. Traders should watch for price behavior around 0.6360 for confirmation of the next move.
This communication is for informational purposes only and should not be viewed as any form of recommendation as to a particular course of action or as investment advice. It is not intended as an offer or solicitation for the purchase or sale of any financial instrument or as an official confirmation of any transaction. Opinions, estimates and assumptions expressed herein are made as of the date of this communication and are subject to change without notice. This communication has been prepared based upon information, including market prices, data and other information, believed to be reliable; however, Trade Nation does not warrant its completeness or accuracy. All market prices and market data contained in or attached to this communication are indicative and subject to change without notice.

Falling towards pullback support?The Aussie (AUD/USD) is falling towards the pivot, which acts as a pullback support and could bounce to the 1st resistance, which has been identified as a pullback resistance.
Pivot: 0.6487
1st Support: 0.6472
1st Resistance: 0.6528
Risk Warning:
Trading Forex and CFDs carries a high level of risk to your capital and you should only trade with money you can afford to lose. Trading Forex and CFDs may not be suitable for all investors, so please ensure that you fully understand the risks involved and seek independent advice if necessary.
Disclaimer:
The above opinions given constitute general market commentary, and do not constitute the opinion or advice of IC Markets or any form of personal or investment advice.
Any opinions, news, research, analyses, prices, other information, or links to third-party sites contained on this website are provided on an "as-is" basis, are intended only to be informative, is not an advice nor a recommendation, nor research, or a record of our trading prices, or an offer of, or solicitation for a transaction in any financial instrument and thus should not be treated as such. The information provided does not involve any specific investment objectives, financial situation and needs of any specific person who may receive it. Please be aware, that past performance is not a reliable indicator of future performance and/or results. Past Performance or Forward-looking scenarios based upon the reasonable beliefs of the third-party provider are not a guarantee of future performance. Actual results may differ materially from those anticipated in forward-looking or past performance statements. IC Markets makes no representation or warranty and assumes no liability as to the accuracy or completeness of the information provided, nor any loss arising from any investment based on a recommendation, forecast or any information supplied by any third-party.

Falling towards pullback support?AUD/USD is falling towards the support level which is a pullback support that is slightly below the 38.2% Fibonacci retracement and could bounce from this level to our take profit.
Entry: 0.6499
Why we like it:
There is a pullback support level that is slightly below the 38.2% Fibonacci retracement.
Stop loss: 0.6485
Why we like it:
There is a pullback support level that lines up with the 61.8% Fibonacci retracement.
Take profit: 0.6536
Why we like it:
There is a pullback support level.
Enjoying your TradingView experience? Review us!
Please be advised that the information presented on TradingView is provided to Vantage (‘Vantage Global Limited’, ‘we’) by a third-party provider (‘Everest Fortune Group’). Please be reminded that you are solely responsible for the trading decisions on your account. There is a very high degree of risk involved in trading. Any information and/or content is intended entirely for research, educational and informational purposes only and does not constitute investment or consultation advice or investment strategy. The information is not tailored to the investment needs of any specific person and therefore does not involve a consideration of any of the investment objectives, financial situation or needs of any viewer that may receive it. Kindly also note that past performance is not a reliable indicator of future results. Actual results may differ materially from those anticipated in forward-looking or past performance statements. We assume no liability as to the accuracy or completeness of any of the information and/or content provided herein and the Company cannot be held responsible for any omission, mistake nor for any loss or damage including without limitation to any loss of profit which may arise from reliance on any information supplied by Everest Fortune Group.

AUD-USD Short From Resistance! Sell!
Hello,Traders!
AUD-USD went up and hit
A horizontal resistance level
Of 0.6541 and as the level
Is strong we will be expecting
A local pullback and a
Bearish correction
Sell!
Comment and subscribe to help us grow!
Check out other forecasts below too!
Disclosure: I am part of Trade Nation's Influencer program and receive a monthly fee for using their TradingView charts in my analysis.
AUDUSD Support & Resistance Levels🚀 Here are some key zones I've identified on the 15m timeframe.
These zones are based on real-time data analysis performed by a custom software I personally developed.
The tool is designed to scan the market continuously and highlight potential areas of interest based on price action behavior and volume dynamics.
Your feedback is welcome!

Audusd Longprice is in bullish trend on the 4hr timeframe. price was consolidating around a 1hr poi and demand zone/ it recently broke through a 4hr key level and reached a 4hr poi. im expecting a minor pullback before continuing to the upside

AUDUSD Hello traders. Today I spotted a buy opportunity on the AUDUSD pair and wanted to share it with you as well. We’re seeing an ideal pullback setup on this one.
🔍 Trade Details
✔️ Timeframe: 15-Minute
✔️ Risk-to-Reward Ratio: 1:1.50
✔️ Trade Direction: Buy
✔️ Entry Price: 0.64987
✔️ Take Profit: 0.65088
✔️ Stop Loss: 0.64920
🔔 Disclaimer: This is not financial advice. I’m simply sharing a trade I’ve taken based on my personal trading system, strictly for educational and illustrative purposes.
📌 Interested in a systematic, data-driven trading approach?
💡 Follow the page and turn on notifications to stay updated on future trade setups and advanced market insights.

AUDUSD Breakout and Potential RetraceHey Traders, in today's trading session we are monitoring AUDUSD for a buying opportunity around 0.64900 zone, AUDUSD was trading in a downtrend and successfully managed to break it out. Currently is in a correction phase in which it is approaching the retrace area at 0.64900 support and resistance zone.
Trade safe, Joe.

THE FLEX SETUP (EURGBP)Good day traders, I'm back with another setup and it’s only an update that I believe can really provide insight into what to expect from price in the upcoming weeks.
Like I always say that I always want to see price take out a previous week high/low as I use that as a confirmation in term of the power of 3 that I use to try and avoid manipulation, but this doesn't mean I don't get on the wrong side of price moves. Looking at the HTF's overall structure we can see that we in a very bullish structure but... There's a bearish flow in price!! On the weekly TF price left a large FVG(BISI), showing how strong the bullish structure is and now that price is trading on top of this BISI I'm mentioning. If we go one TF lower to the daily TF than on the daily the weekly BISI is a balanced price range and normally how I look at Gaps after been balanced, I treat them like classic support/resistance, but they have to confluence with another PD array first than for me the rules of 'support/resistance' come into play. If you look close into the daily TF, we have relative equal highs inside the volume imbalance created on the 12th of May.
Let's look at how price delivered since opening with a gap lower on the 12th, on that same day price repriced that gap but did not close above it. Why do we want it to close above it? Well ICT teaches more on volume imbalances and the rules or pros and cons. If price closes above the volume imbalance than it becomes balanced once price retests the closure above/below obviously depending on the gap opening. On the 4HTF we saw price shift structure higher and the first thing I see is the candle that had a broken lower high because it also became our breaker. And a FVG inside it making that zone stronger again we can use all the PD arrays together.

AUDUSD A Fall Expected! SELL!
My dear followers,
I analysed this chart on AUDUSD and concluded the following:
The market is trading on 0.6494 pivot level.
Bias - Bearish
Technical Indicators: Both Super Trend & Pivot HL indicate a highly probable Bearish continuation.
Target - 0.6464
Safe Stop Loss - 0.6512
About Used Indicators:
A super-trend indicator is plotted on either above or below the closing price to signal a buy or sell. The indicator changes color, based on whether or not you should be buying. If the super-trend indicator moves below the closing price, the indicator turns green, and it signals an entry point or points to buy.
Disclosure: I am part of Trade Nation's Influencer program and receive a monthly fee for using their TradingView charts in my analysis.
———————————
WISH YOU ALL LUCK

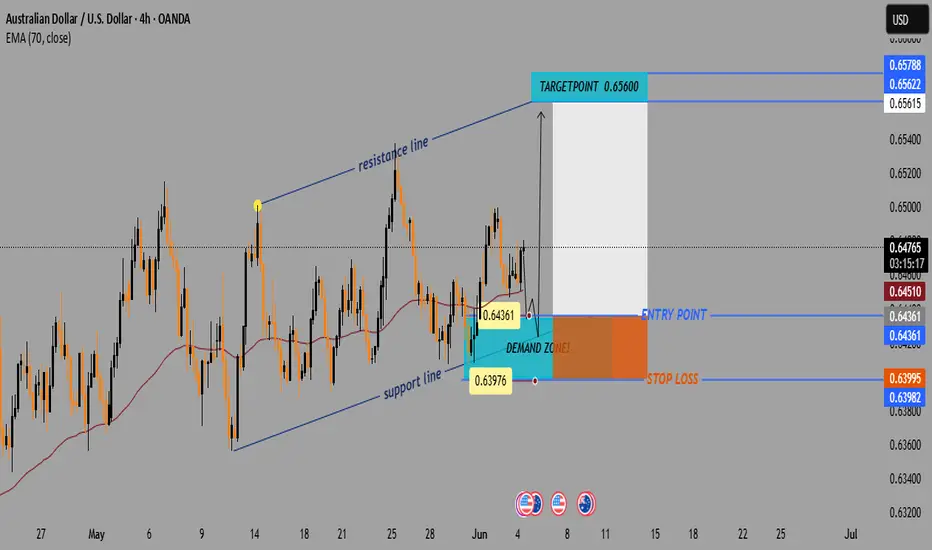
AUD/USD Bullish Setup: Demand Zone Bounce Toward 0.65600📈 Price Channel Analysis
🔼 The pair is moving within an ascending channel: • Support Line 🟦 – lower trendline showing bullish structure
* Resistance Line 🟥 – upper boundary acting as potential target
💡 This suggests bullish momentum is intact unless the price breaks below support.
📌 Key Trade Levels
🔵 Entry Point: 0.64361
* 👇 Positioned just above the DEMAND ZONE
* 📍Near the 70 EMA — a key dynamic support
🟨 Demand Zone: Area between 0.6400 – 0.6436
* 🧲 Buyers are expected here
* Good spot for a bullish entry
🔴 Stop Loss: 0.63995
* 🚨 Below the demand zone = limited risk
🟢 Target Point: 0.65600
* 🎯 Aligned with the upper resistance line
* Nice upside potential
⚙️ Technical Indicator
📉 EMA 70 (red line) = 0.64510
* Price is bouncing near it
* 📊 Acts as trend support — confirming buy idea
📊 Risk-to-Reward Ratio
🔻 Risk: ~36 pips (Entry → Stop Loss)
🔺 Reward: ~124 pips (Entry → Target)
✅ R:R Ratio ≈ 3.4:1 👍
🧠 Trade Idea Summary
📘 Trade Type 🔼 Buy (Long)
💰 Entry 0.64361
🛑 Stop Loss 0.63995
🎯 Target 0.65600
🌟 Bias Bullish
🔍 Final Thoughts
✅ Strong setup within a bullish channel
📉 EMA support + 🟦 Demand zone = Good confluence
📅 Watch out for USD news (see icons below chart)
AUD/USD BEARISH BIAS RIGHT NOW| SHORT
Hello, Friends!
Previous week’s green candle means that for us the AUD/USD pair is in the uptrend. And the current movement leg was also up but the resistance line will be hit soon and upper BB band proximity will signal an overbought condition so we will go for a counter-trend short trade with the target being at 0.643.
Disclosure: I am part of Trade Nation's Influencer program and receive a monthly fee for using their TradingView charts in my analysis.
✅LIKE AND COMMENT MY IDEAS✅

Australian Dollar Setups: AUD/USD, EUR/AUD, AUD/NZD, AUD/JPYAn update to the prior Aussie dollar video, where I reassess the setups and decide which ones I prefer.
Matt Simpson, Market Analyst at City Index and Forex.com.

Bearish reversal off 61.8% Fibonacci resistance?AUD/USD is rising towards the resistance level which is a pullback resistance that lines up with the 61.8% Fibonacci retracement and could reverse from this level to our take profit.
Entry: 0.6477
Why we like it:
There is a pullback resistance level that aligns with the 61.8% Fibonacci retracement.
Stop loss: 0.6496
Why we like it:
There is a pullback resistance level.
Take profit: 0.6450
Why we like it:
There is an overlap support level.
Enjoying your TradingView experience? Review us!
Please be advised that the information presented on TradingView is provided to Vantage (‘Vantage Global Limited’, ‘we’) by a third-party provider (‘Everest Fortune Group’). Please be reminded that you are solely responsible for the trading decisions on your account. There is a very high degree of risk involved in trading. Any information and/or content is intended entirely for research, educational and informational purposes only and does not constitute investment or consultation advice or investment strategy. The information is not tailored to the investment needs of any specific person and therefore does not involve a consideration of any of the investment objectives, financial situation or needs of any viewer that may receive it. Kindly also note that past performance is not a reliable indicator of future results. Actual results may differ materially from those anticipated in forward-looking or past performance statements. We assume no liability as to the accuracy or completeness of any of the information and/or content provided herein and the Company cannot be held responsible for any omission, mistake nor for any loss or damage including without limitation to any loss of profit which may arise from reliance on any information supplied by Everest Fortune Group.

03.06.25 AUDUSD Trade Recap (Breakeven Manual Close)A long position taken on AUDUSD for a breakeven manual close, full explanation as to why I made this decision in the recap and my current thoughts on this pairs next move

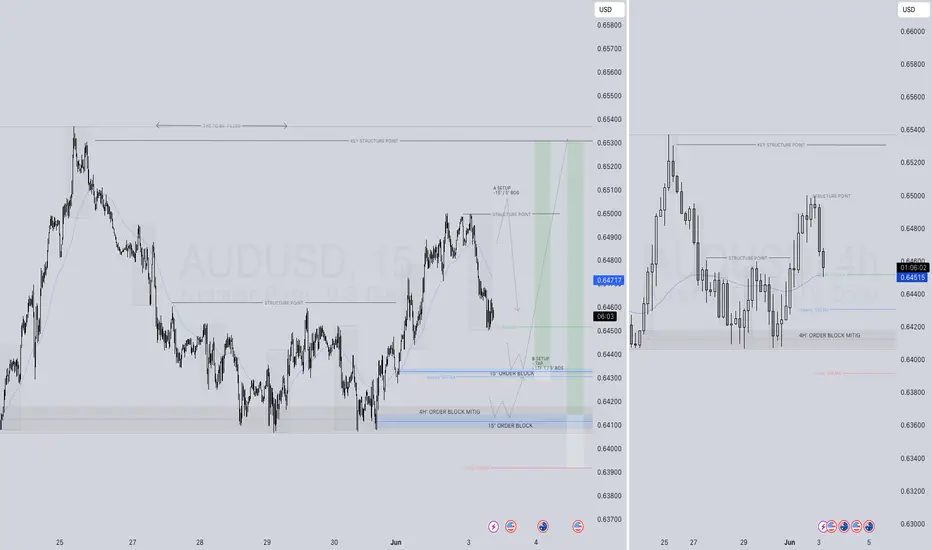
AUDUSD LONG FORECAST Q2 W23 D3 Y25👀 AUDUSD LONG FORECAST Q2 W23 D3 Y25
Professional Risk Managers👋
Welcome back to another FRGNT chart update📈
Diving into some Forex setups using predominantly higher time frame order blocks alongside intraday confirmation & breaks of structure.
Let’s see what price action is telling us today! 🔥
💡Here are some trade confluences📝
✅Weekly 50 EMA
✅Daily 50 EMA
✅15’ order block
✅Intraday bullish breaks of structure
🔑 Remember, to participate in trading comes always with a degree of risk, therefore as professional risk managers it remains vital that we stick to our risk management plan as well as our trading strategies.
📈The rest, we leave to the balance of probabilities.
💡Fail to plan. Plan to fail.
🏆It has always been that simple.
❤️Good luck with your trading journey, I shall see you at the very top.
🎯Trade consistent, FRGNT X
AUDUSD Asia SessionWe could see bullish momentum during the Asian session pushing price into the upper supply zone around 0.65200. From there, we’ll be monitoring for bearish price action (PA) to potentially confirm a short setup.
If confirmation aligns, the short idea targets the demand zone between 0.64600–0.64500.
This is a forecast — not a signal. Trade execution will depend on what price does upon reaching the supply. We’ll drop to the H1 or M15 to refine entries if bearish confirmations present themselves.
Higher Timeframe Context: clearly marked HTF supply. Price has made a corrective leg up into this zone.
Liquidity & Reaction Area: There's likely resting liquidity above the most recent highs before the 0.65200 zone — perfect for a sweep.
Entry Plan: Smart to wait for CHoCH or BOS on LTF once we enter the supply zone. Avoid rushing — let the zone prove itself.
Target Area: The 0.64600–0.64500 zone aligns with previous structure and a minor FVG — solid short-term TP.

AUD/USD Coiling for Breakout as Wedge Tightens Below 200-day SMAAUD/USD is threatening a breakout from a bullish ascending triangle pattern after weeks of tight consolidation:
Triangle Pattern: The pair has carved out a clear ascending triangle, marked by higher lows and resistance near 0.6500. Today's breakout attempt is the most convincing yet.
Key Levels in Play: 0.6500 remains the neckline to beat, while the 200-day SMA (currently near 0.6446) has served as a gravity line for weeks. A daily close above both would mark a significant technical shift.
Momentum Gauges: RSI is lifting off the 50 level, hinting at building bullish momentum. MACD is attempting to cross above the zero line but still lacks follow-through.
Targets: A confirmed breakout opens the door toward the 0.6558 Fibonacci level, with 0.6730 a stretch target if momentum builds.
Failure to break higher from here could bring a sharp drop back toward support near 0.6360. Keep an eye on volume and closing strength.
-MW

AUD/USD - Triangle Breakout (02.06.2025)The AUD/USD pair on the M30 timeframe presents a Potential Buying Opportunity due to a recent Formation of a Triangle Pattern. This suggests a shift in momentum towards the upside and a higher likelihood of further advances in the coming hours.
Possible Long Trade:
Entry: Consider Entering A Long Position around Trendline Of The Pattern.
Target Levels:
1st Resistance – 0.6490
2nd Resistance – 0.6512
🎁 Please hit the like button and
🎁 Leave a comment to support for My Post !
Your likes and comments are incredibly motivating and will encourage me to share more analysis with you.
Best Regards, KABHI_TA_TRADING
Thank you.
Disclosure: I am part of Trade Nation's Influencer program and receive a monthly fee for using their TradingView charts in my analysis.

AUDUSD The Target Is DOWN! SELL!
My dear friends,
My technical analysis for AUDUSD is below:
The market is trading on 0.6477 pivot level.
Bias - Bearish
Technical Indicators: Both Super Trend & Pivot HL indicate a highly probable Bearish continuation.
Target - 0.6446
Recommended Stop Loss - 0.6495
About Used Indicators:
A pivot point is a technical analysis indicator, or calculations, used to determine the overall trend of the market over different time frames.
Disclosure: I am part of Trade Nation's Influencer program and receive a monthly fee for using their TradingView charts in my analysis.
———————————
WISH YOU ALL LUCK