AUD/USD : Bullish Momentum Builds from Strong DemandIn the 4-hour AUD/USD chart, strong supply and demand zones are visible. A significant demand zone is observed around the 0.62269 level. Within the chart, a Change of Character (ChoCh) is identified from the 0.6323 level, and a Break of Structure (BoS) is noted at the 0.63211 level. A strong selling reaction has been observed from the supply zone, and the market has retested that level again.
On the demand side, the market has touched the strong demand zone twice and showed a bullish formation each time. Currently, the price is forming a strong bullish candle again.
Based on the Fibonacci levels, potential upside targets could be seen at 0.62717, 0.63128, and 0.63312, provided the market holds above the demand zone. However, if the demand zone is broken, there is a possibility of the market dropping down to 0.61901 .
AUDUSD

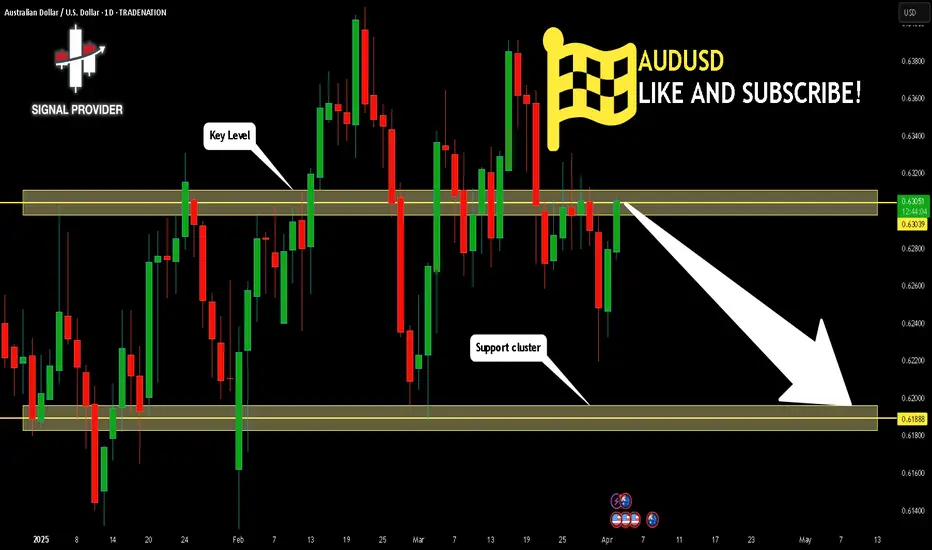
AUDUSD Will Move Lower! Sell!
Take a look at our analysis for AUDUSD.
Time Frame: 1D
Current Trend: Bearish
Sentiment: Overbought (based on 7-period RSI)
Forecast: Bearish
The market is testing a major horizontal structure 0.630.
Taking into consideration the structure & trend analysis, I believe that the market will reach 0.618 level soon.
P.S
The term oversold refers to a condition where an asset has traded lower in price and has the potential for a price bounce.
Overbought refers to market scenarios where the instrument is traded considerably higher than its fair value. Overvaluation is caused by market sentiments when there is positive news.
Disclosure: I am part of Trade Nation's Influencer program and receive a monthly fee for using their TradingView charts in my analysis.
Like and subscribe and comment my ideas if you enjoy them!
AUD/USD "The Aussie" Forex Bank Bearish Heist Plan (Swing/Day)🌟Hi! Hola! Ola! Bonjour! Hallo! Marhaba!🌟
Dear Money Makers & Robbers, 🤑💰✈️
Based on 🔥Thief Trading style technical and fundamental analysis🔥, here is our master plan to heist the AUD/USD "The Aussie" Forex Bank. Please adhere to the strategy I've outlined in the chart, which emphasizes short entry. Our aim is the high-risk Green Zone. Risky level, oversold market, consolidation, trend reversal, trap at the level where traders and bullish robbers are stronger. 🏆💸Book Profits Be wealthy and safe trade.💪🏆🎉
Entry 📈 : "The heist is on! Wait for the MA breakout then make your move at (0.62200) - Bearish profits await!"
however I advise to Place sell stop orders above the Moving average (or) after the MA level Breakout Place sell limit orders within a 15 or 30 minute timeframe most NEAREST (or) SWING low or high level.
📌I strongly advise you to set an "alert (Alarm)" on your chart so you can see when the breakout entry occurs.
Stop Loss 🛑: "🔊 Yo, listen up! 🗣️ If you're lookin' to get in on a sell stop order, don't even think about settin' that stop loss till after the breakout 🚀. You feel me? Now, if you're smart, you'll place that stop loss where I told you to 📍, but if you're a rebel, you can put it wherever you like 🤪 - just don't say I didn't warn you ⚠️. You're playin' with fire 🔥, and it's your risk, not mine 👊."
📌Thief SL placed at the nearest/swing High or Low level Using the 4H timeframe (1.42800) Day/Swing trade basis.
📌SL is based on your risk of the trade, lot size and how many multiple orders you have to take.
Target 🎯: 0.62900 (or) Escape Before the Target
🧲Scalpers, take note 👀 : only scalp on the Short side. If you have a lot of money, you can go straight away; if not, you can join swing traders and carry out the robbery plan. Use trailing SL to safeguard your money 💰.
💸💵AUD/USD "The Aussie" Forex Bank Heist Plan (Swing/Day Trade) is currently experiencing a bearishness,., driven by several key factors.👇
📰🗞️Get & Read the Fundamental, Macro, COT Report, Quantitative Analysis, Sentimental Outlook, Intermarket Analysis, Future trend targets.. go ahead to check 👉👉👉🔗
⚠️Trading Alert : News Releases and Position Management 📰 🗞️ 🚫🚏
As a reminder, news releases can have a significant impact on market prices and volatility. To minimize potential losses and protect your running positions,
we recommend the following:
Avoid taking new trades during news releases
Use trailing stop-loss orders to protect your running positions and lock in profits
💖Supporting our robbery plan 💥Hit the Boost Button💥 will enable us to effortlessly make and steal money 💰💵. Boost the strength of our robbery team. Every day in this market make money with ease by using the Thief Trading Style.🏆💪🤝❤️🎉🚀
I'll see you soon with another heist plan, so stay tuned 🤑🐱👤🤗🤩

AUDUSD breaking down following the headlinesIntraday Update: The AUDUSD has broken flag support following the headline from China that they are going to impose a 34% retaliatory tariff. The AUDUSD just surpassed the 127% extension and now may target the .6118 level intraday.
Long term targets the post covid lockdown lows.

Is the Aussie dropping?The Australian fundamentals are always weak and despite the noise, the US fundamentals are strong (for now). With tariff pressure and US news volume, I think the $AUD/USD could complete the daily head and shoulders. I'm targeting .6200 area.
AUDUSD POTENTIAL LONG POSITION Q2 W14 Y25 FRIDAY 4TH APRIL 2025AUDUSD POTENTIAL LONG POSITION Q2 W14 Y25 FRIDAY 4TH APRIL 2025
Could well be the only position to provide fun coupons on a successful week of trading.
The concept is quite simple but does lack a few of our favourite confluences. If this was the beginning of the week, we would perhaps wait for a 15' break of structure but this takes away the Tokyo range fill confluences.
We require a tap into the 15' order block, followed by a bullish move from the point of interest. This in turn we wish to leave behind a void and order block creation. In the same breath, we require lower time frame breaks of structure since the break of 15' would not then give us enough time on an NFP Friday for price action to pull back to the low point of interest and a move long.
Lets see how it plays.
FRGNT x

AUDUSD Bears "Flag Down" Potential OpportunitiesOn the Technical Analysis stand-point, FX:AUDUSD has been Consolidating in an Ascending Channel since the beginning of this year after having a sharp decline which started in October last year. Now the past 6 Months, Price Action seems to be forming a strong Continuation Pattern, the Bear Flag!
Based on the Retracement from the Swing High @ .6942 to the Swing Low @ .60872, Price has made a 38.2% Retracement to .64081, resulting in a False Break, pushing Price back into Pattern!
Price has been trading Under the 200 EMA since the start of the "Flagpole" and with the separation between it and the 34 EMA Band, feeds the Bearish Bias after we see Price heavily rejected after touching the 34 EMA Band!
*Once Price makes a Breakout of the Rising Support of the Channel -> Bear Flag Confirmed
*Increase in Volume after Break -> Breakout Validated
If we get a True Breakout that is Validated by the checklist of factors, we could be looking at great opportunities to take FX:AUDUSD down to the current 5 Year Low of .55063 set back in March 16th 2020 (Initial Outbreak of Covid) based on the Flagpole and Potential Extension of a Valid Break and Retest of the Bear Flag!
Now, Fundamentally what is driving the Weaker Aussie Dollar is the fear of the impact of what the US Tariffs will do to Australia's "Key Trading Partners" being China, Japan and South Korea all being high on the Reciprocal Tariff List. Because of this, the RBA has now priced in 100 Basis Points worth of Rate Cuts to come with the expectations of a "dampened broader outlook for global trade and economic growth."
www.tradingview.com
Stay Tuned!

DXY to 80? ...Tariffs the First Domino in a Multi-Year Collapse?This is a pure technical walkthrough of the U.S. Dollar Index—no fluff, no indicators, no fundamentals. Just market structure, smart money, and liquidity concepts.
Back on January 14th , I posted about a potential 20%+ drop in the DXY — you can view it here . This video builds on that thesis and walks you through the full technical story from 1986 to today , including accumulation cycles, yearly trap zones, and my long-term target of 80. Am I crazy? Maybe. Let's see if I can convince you to be crazy too 😜
There is a video breakdown above, and a written breakdown below.
Here are timestamps if you want to jump around the video:
00:00 – The Case for $80: Not as Crazy as It Sounds
02:30 – The 0.786 Curse: Why the Dollar Keeps Faking Out
06:15 – How Smart Money Really Moves: The 4-Phase Playbook
12:30 – The Trap Is Set: Yearly Highs as Liquidity Bait
20:00 – Inside the Mind of the Market: 2010–2025 Unpacked
25:00 – The Bear Channel No One’s Talking About
36:00 – The First Domino: Is the Dollar’s Slide Just Beginning?
👇 If you're a visual learner, scroll down—each chart tells part of the story.
Chart: Monthly View – Three Highs, .786 Retraces, and Trendline Breaks
History doesn’t repeat, but it sure rhymes.
Each major DXY rally has formed a sequence of three swing highs right after a break of trendline structure. In both instances, price retraced to the .786 level on the yearly closes—an often overlooked fib level that institutional players respect.
We’re now sitting at a high again. You’ll notice price has already reversed from that zone. That doesn’t guarantee a collapse, but when we line it up with other confluences (next charts), the probability of a deeper markdown becomes hard to ignore.
I'd also like to note that all of the highlighted moves, are 2-3 year trend runs. Which means if we are bearish, this could be the exact start of a 2-3 bear market.
Market Phases Since 1986
This chart illustrates how DXY has moved through repeating cycles of:
🟡 Accumulation: Smart money building positions quietly.
🔵 Markup: Price accelerates with buy orders + media hype.
🟣 Distribution: Smart money sells to latecomers.
🔴 Markdown: Public panic → smart money reloads.
If we are indeed entering another markdown phase, this would align perfectly with the pattern seen over the past 40 years.
You’ll also notice the "Point of Control" (POC) zones—volume-based magnets that price often returns to. These spots often act as the origin of the move, and as such, they make for strong targets and areas of interest.
Liquidity Zones and Stop Loss Traps
This is where it gets juicy.
The majority of breakout traders placed long entries at the blue lines—above swing highs, thinking resistance was broken. But what’s under those highs? Stop loss clusters.
Institutions use these areas as liquidity harvests.
Several key levels are marked as “OPEN” in this chart, meaning price has yet to return to sweep those orders. That’s why I’m expecting price to begin seeking out that liquidity over the coming months.
There's also an imbalance gap (thin price action) around the 85–86 zone. If price falls into that trap door, there’s nothing to stop it until the 80s.
The 2025 Outlook
Here’s how I’m approaching this year:
✅ Bearish bias under 105
🎯 Targets at 100, 95, and 90
🚪 Trap door under 86 if volume is thin
Price is currently stuck under the recent point of control and showing signs of distribution. If that level continues to hold as resistance, we could see a multi-leg push downward, with the 100 and 95 zones acting as check-in points.
If we break under the 90s and enter the imbalance zone, 80 becomes more than just possible—it becomes probable.
🗣️ Let’s Sharpen Together
Do you see this unfolding the same way?
Do you disagree with the 80 target?
Drop a comment with your view or share your own markup—this is why we trade!
Stay safe,
⚠️ Risk Disclaimer
This post is for educational purposes only and reflects my personal analysis and opinions. It is not financial advice. Trading involves significant risk and may not be suitable for all investors. Always do your own research, manage your risk appropriately, and never trade money you can’t afford to lose.

Bullish Setup on AUD/USD – Are You In?Hi traders ! , Analyzing AUD/USD on the 1H timeframe, spotting a potential long entry :
🔹 Entry: 0.62851
🔹 TP: 0.63934 🎯
🔹 SL: 0.61863 🔻
AUD/USD is respecting the lower boundary of the ascending channel and bouncing off support. If this trend continues, we could see a push toward 0.63934. RSI is neutral, leaving room for further upside.
⚠️ DISCLAIMER: This is not financial advice. Every trader makes their own decision.

AUDUSD(20250403)Today's AnalysisToday's buying and selling boundaries:
0.6297
Support and resistance levels:
0.6380
0.6349
0.6329
0.6266
0.6246
0.6215
Trading strategy:
If the price breaks through 0.6266, consider buying, the first target price is 0.6297
If the price breaks through 0.6246, consider selling, the first target price is 0.6215

FXAN & Heikin Ashi Trade IdeaOANDA:AUDUSD
In this video, I’ll be sharing my analysis of AUDUSD, using FXAN's proprietary algo indicators with my unique Heikin Ashi strategy. I’ll walk you through the reasoning behind my trade setup and highlight key areas where I’m anticipating potential opportunities.
I’m always happy to receive any feedback.
Like, share and comment! ❤️
Thank you for watching my videos! 🙏

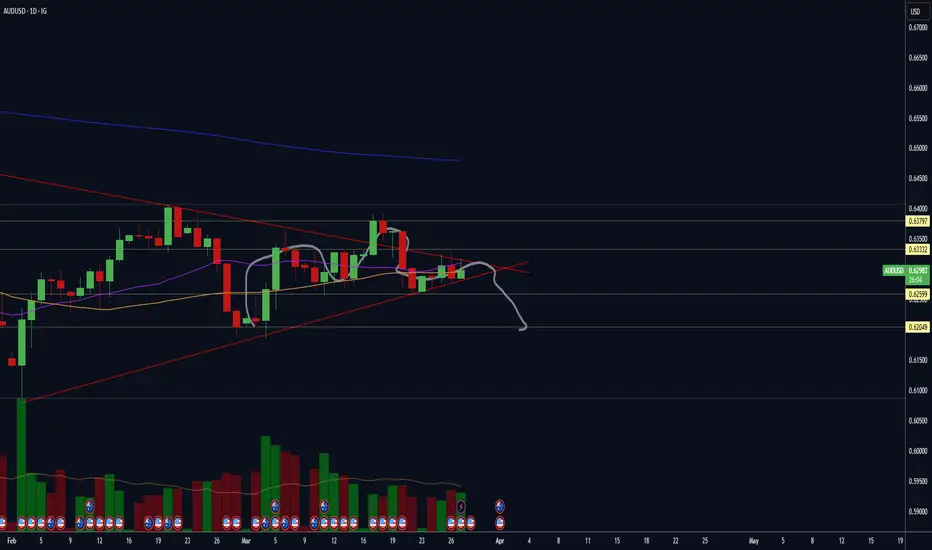
DeGRAM | AUDUSD back in the channelAUDUSD is in an ascending channel above the trend lines.
The price is moving from the support level and has already returned to the channel.
The chart has formed a harmonic pattern and is now holding above the 38.2% retracement level.
The 30m Timeframe indicators have formed a hidden bearish divergence.
We expect the growth to continue after the retest of the lower channel boundary.
-------------------
Share your opinion in the comments and support the idea with like. Thanks for your support!

AUDUSD Tap Reading/ Trading Math Analysis Reversal Predictions BDear Trader,
Please find attached my analysis of $Subject, which uses mathematical calculations to identify potential reversal times and price levels.
The analysis details projected south and north price targets (horizontal lines on the chart), along with estimated time frames for possible reversals (vertical lines on the chart, accurate to within +/- 1-2 candles). Please note that all times indicated on the chart, including the vertical lines representing potential reversal times, are based on the UTC+4 time zone.
To increase the probability of these analysis, I recommend monitoring the 5-minute and 15-minute charts for the following key reversal candlestick patterns:
Doji’s
Hammer/Inverted Hammer
Double/Triple Bottom/Top
Shooting Star
Morning Star
Hanging Man
I welcome your feedback on this analysis, as it will inform and enhance my future research.
3rd Apr12:05 PM
3rd Apr 4:30 PM
3rd APr 6:10 PM
3rd APr 6:30 PM
3rd Apr 10:25PM
4th Apr 2:10 AM to 2:30 AM
4th 4:30 AM to 5:35 AM
4th 10:30 AM
Regards,
Shunya Trade
⚠️ Disclaimer: This post is educational content and does not constitute investment advice, financial advice, or trading recommendations. The views expressed here are based on technical analysis and are shared solely for informational purposes. The stock market is subject to risks, including capital loss, and readers should exercise due diligence before investing. We do not take responsibility for decisions made based on this content. Consult a certified financial advisor for personalized guidance.

Aussie H4 | Overlap resistance at 78.6% Fibonacci projectionThe Aussie (AUD/USD) is rising towards an overlap resistance and could potentially reverse off this level to drop lower.
Sell entry is at 0.6324 which is an overlap resistance that aligns with the 78.6% Fibonacci projection.
Stop loss is at 0.6370 which is a level that sits above the 127.2% Fibonacci extension, 100% projection and a swing-high resistance.
Take profit is at 0.6264 which is a swing-low support.
High Risk Investment Warning
Trading Forex/CFDs on margin carries a high level of risk and may not be suitable for all investors. Leverage can work against you.
Stratos Markets Limited (www.fxcm.com):
CFDs are complex instruments and come with a high risk of losing money rapidly due to leverage. 63% of retail investor accounts lose money when trading CFDs with this provider. You should consider whether you understand how CFDs work and whether you can afford to take the high risk of losing your money.
Stratos Europe Ltd (www.fxcm.com):
CFDs are complex instruments and come with a high risk of losing money rapidly due to leverage. 63% of retail investor accounts lose money when trading CFDs with this provider. You should consider whether you understand how CFDs work and whether you can afford to take the high risk of losing your money.
Stratos Trading Pty. Limited (www.fxcm.com):
Trading FX/CFDs carries significant risks. FXCM AU (AFSL 309763), please read the Financial Services Guide, Product Disclosure Statement, Target Market Determination and Terms of Business at www.fxcm.com
Stratos Global LLC (www.fxcm.com):
Losses can exceed deposits.
Please be advised that the information presented on TradingView is provided to FXCM (‘Company’, ‘we’) by a third-party provider (‘TFA Global Pte Ltd’). Please be reminded that you are solely responsible for the trading decisions on your account. There is a very high degree of risk involved in trading. Any information and/or content is intended entirely for research, educational and informational purposes only and does not constitute investment or consultation advice or investment strategy. The information is not tailored to the investment needs of any specific person and therefore does not involve a consideration of any of the investment objectives, financial situation or needs of any viewer that may receive it. Kindly also note that past performance is not a reliable indicator of future results. Actual results may differ materially from those anticipated in forward-looking or past performance statements. We assume no liability as to the accuracy or completeness of any of the information and/or content provided herein and the Company cannot be held responsible for any omission, mistake nor for any loss or damage including without limitation to any loss of profit which may arise from reliance on any information supplied by TFA Global Pte Ltd.
The speaker(s) is neither an employee, agent nor representative of FXCM and is therefore acting independently. The opinions given are their own, constitute general market commentary, and do not constitute the opinion or advice of FXCM or any form of personal or investment advice. FXCM neither endorses nor guarantees offerings of third-party speakers, nor is FXCM responsible for the content, veracity or opinions of third-party speakers, presenters or participants.

Australian dollar rally continues, Trump tariffs loomThe Australian dollar has posted strong gains for a second straight day. In the European session, AUD/USD is trading at 0.6306, up 0.47% on the day.
The Reserve Bank of Australia maintained the cash rate at 4.10% on Tuesday, in a move that was widely expected by markets. Still, the Australian dollar reacted positively, gaining 0.48% on Tuesday.
The RBA statement noted that underlying inflation continued to ease in line with the Bank's forecast, but the Board "needs to be confident that this progress will continue" so that inflation remains sustainable at the midpoint of the 2%-3% target band. The statement said there was "significant" uncertainty over global trade developments, pointing to the threat of further US tariffs and possible counter-tariffs from targeted countries.
The central bank's decision was made in the midst of a hotly contested election campaign, and a rate cut would likely have been attacked by the opposition parties as political interference.
In a press conference after the meeting, Governor Michele Bullock acknowledged the uncertainty over the global outlook due to US trade policy but sought to assure the markets by saying that Australia was "well placed" to weather the potential storm of a global trade war.
US President Trump has not specifically targeted Australia with any tariffs but China is Australia's number one trading partner and a US-China trade war would inflict damage on Australia's economy.
The new US tariffs are expected to be announced later today and take effect on Thursday. The financial markets remain volatile as investors look for some clarity from Washington about the tariffs, as it remains unclear which countries will be targeted and the extent of the tariff rates.

Falling towards pullback support?AUD/USD is falling towards the support level which is an overlap support that lines up with the 50% Fibonacci retracement and could bounce from this level to our take profit.
Entry: 0.6270
Why we like it:
There is an overlap support level that lines up with the 50% Fibonacci retracement.
Stop loss: 0.6236
Why we like it:
There is a pullback support level
Take profit: 0.6329
Why we like it:
There is a pullback resistance level that lines up with the 61.8% Fibonacci retracement.
Enjoying your TradingView experience? Review us!
Please be advised that the information presented on TradingView is provided to Vantage (‘Vantage Global Limited’, ‘we’) by a third-party provider (‘Everest Fortune Group’). Please be reminded that you are solely responsible for the trading decisions on your account. There is a very high degree of risk involved in trading. Any information and/or content is intended entirely for research, educational and informational purposes only and does not constitute investment or consultation advice or investment strategy. The information is not tailored to the investment needs of any specific person and therefore does not involve a consideration of any of the investment objectives, financial situation or needs of any viewer that may receive it. Kindly also note that past performance is not a reliable indicator of future results. Actual results may differ materially from those anticipated in forward-looking or past performance statements. We assume no liability as to the accuracy or completeness of any of the information and/or content provided herein and the Company cannot be held responsible for any omission, mistake nor for any loss or damage including without limitation to any loss of profit which may arise from reliance on any information supplied by Everest Fortune Group.

USD/JPY : Bulls are coming back?! Let's See! (READ THE CAPTION)Upon analyzing the USD/JPY daily chart, we observe that the price precisely hit our previously forecasted target of 148.65 before declining further to 146.5. Following that, USDJPY rallied back up to 151 and is currently trading around 150.680. Should the price manage to stabilize above 150.5, we can anticipate further gains in this pair. This analysis will be updated accordingly.
Please support me with your likes and comments to motivate me to share more analysis with you and share your opinion about the possible trend of this chart with me !
Best Regards , Arman Shaban

AUDUSD Discretional Analysis: It's Going Down, BroI don't know man, I have a feeling it's gonna go down. If I'm right I'll make some money and if I'm wrong I'll lose some money.
Just my opinion, not financial advice.

Potential bullish rise?The Aussie (AUD/USD) has bounced off the pivot and could rise to the 1st resistance.
Pivot: 0.6261
1st Support: 0.6229
1st Resistance: 0.6322
Risk Warning:
Trading Forex and CFDs carries a high level of risk to your capital and you should only trade with money you can afford to lose. Trading Forex and CFDs may not be suitable for all investors, so please ensure that you fully understand the risks involved and seek independent advice if necessary.
Disclaimer:
The above opinions given constitute general market commentary, and do not constitute the opinion or advice of IC Markets or any form of personal or investment advice.
Any opinions, news, research, analyses, prices, other information, or links to third-party sites contained on this website are provided on an "as-is" basis, are intended only to be informative, is not an advice nor a recommendation, nor research, or a record of our trading prices, or an offer of, or solicitation for a transaction in any financial instrument and thus should not be treated as such. The information provided does not involve any specific investment objectives, financial situation and needs of any specific person who may receive it. Please be aware, that past performance is not a reliable indicator of future performance and/or results. Past Performance or Forward-looking scenarios based upon the reasonable beliefs of the third-party provider are not a guarantee of future performance. Actual results may differ materially from those anticipated in forward-looking or past performance statements. IC Markets makes no representation or warranty and assumes no liability as to the accuracy or completeness of the information provided, nor any loss arising from any investment based on a recommendation, forecast or any information supplied by any third-party.

XAU/USD: Bull or Bear? (READ THE CAPTION)By analyzing the gold chart on the 15-minute timeframe, we can see that after the market opened today, a price gap appeared. Once gold filled this gap, it resumed its bullish move and recorded a new all-time high at $3,128. Currently, gold is trading around $3,119, and if the price stabilizes below $3,120, we may see a slight correction.
However, note that there’s been no new structural break on the higher timeframes, so for a more accurate outlook, we need to wait for the price to react to key levels.
This analysis will be updated with your continued support, as always!
Please support me with your likes and comments to motivate me to share more analysis with you and share your opinion about the possible trend of this chart with me !
Best Regards , Arman Shaban

AUD_USD WILL FALL|SHORT|
✅AUD_USD is trading in an
Downtrend and the pair
Made a bearish breakout
Then made a retest and
Is going down now again
So we are bearish biased
And a bearish continuation
Is to be expected
SHORT🔥
✅Like and subscribe to never miss a new idea!✅
Disclosure: I am part of Trade Nation's Influencer program and receive a monthly fee for using their TradingView charts in my analysis.

No Rate Hike, No Mercy – AUD/USD Selling in Style!Riding the wave of bearish structure, AUD/USD continues to follow the macro trend with laser precision. After the RBA held rates steady, we’re seeing the typical post-news dump play out—fueled by the market’s disappointment and reduced sentiment.
Technically, price respected the 4H Fair Value Gap (FVG) and showed strong displacement to the downside, confirming continuation.
Key Targets:
🔻 0.62311 – Minor liquidity
🔻 0.62185 – 1H Sell-side liquidity
🔻 0.61703 – Ultimate short-term sell-side target
Expecting the market to bleed lower unless major fundamentals flip the bias. Until then... the trend is your bestie.
DYOR 🧠📉

RBA Holds Their Cash Rate, May Cut Neither Confirmed Nor DeniedThe RBA held their cash rate at 4.1%, and keep a May cut up in the air without any appetite to commit to one. I highlight my observations on the RBA's statement, before updating my analysis for AUD/USD, AUD/CAD and GBP/AUD.
Matt Simpson, Market Analyst at City Index and Forex.com
