AUD/USD Surges Past 0.6200: Optimism Fuels the RallyIn the Asian trading session on Monday, the AUD/USD currency pair continued its upward movement, breaking above the 0.6200 mark. Traders are feeling hopeful as they approach the inauguration of US President-elect Donald Trump, despite the People's Bank of China's decision to keep the Loan Prime Rate steady. The Australian Dollar has faced challenges against a robust US Dollar but has managed to recover some lost ground recently, aided by a slight decline in the Greenback's value.
The US Dollar's rally, which started in October in tandem with the so-called "Trump trade," has exerted significant pressure on the Aussie. However, from a technical perspective, the Australian Dollar appears poised for a rebound around the demand zone at 0.6200, suggesting a potential retracement. We are considering a long position in this scenario.
✅ Please share your thoughts about AUD/USD in the comments section below and HIT LIKE if you appreciate my analysis. Don't forget to FOLLOW ME; you will help us a lot with this small contribution.
AUDUSD

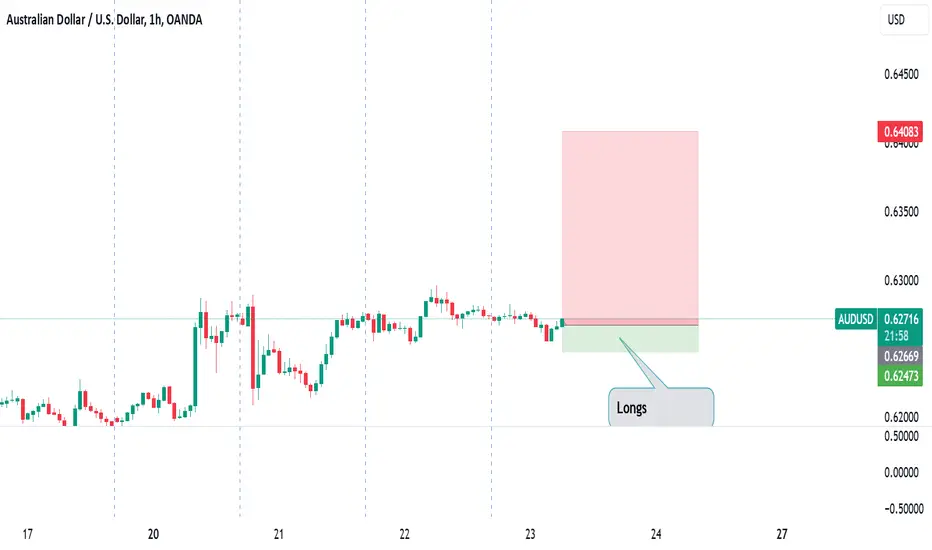
AUDUSD Will Go Up From Support! Long!
Take a look at our analysis for AUDUSD.
Time Frame: 1D
Current Trend: Bullish
Sentiment: Oversold (based on 7-period RSI)
Forecast: Bullish
The market is trading around a solid horizontal structure 0.632.
The above observations make me that the market will inevitably achieve 0.650 level.
P.S
The term oversold refers to a condition where an asset has traded lower in price and has the potential for a price bounce.
Overbought refers to market scenarios where the instrument is traded considerably higher than its fair value. Overvaluation is caused by market sentiments when there is positive news.
Like and subscribe and comment my ideas if you enjoy them!

AudUsd could rise to 0.65AUD/USD is another USD major pair that I’m bullish on.
As shown in the posted chart, AUD, like many other currencies, faced a challenging time during the final quarter of 2024.
However, after hitting a new low at the beginning of 2025, the pair has reversed course and broken back above the falling trendline.
Additionally, a combination of bullish reversal candles and the formation of an inverted head and shoulders pattern further supports the bullish outlook.
In this context, my strategy is to buy on dips, aligning with the positive technical setup.

AUDUSD H4 I Bullish ContinuationBased on the H4 chart, the price is approaching our sell entry level at 0.6346, which aligns with a strong resistance level and the 127.2% Fibonacci extension. This level is expected to act as a potential reversal point in the bearish setup.
Our take profit is set at 0.6281, an overlap support level.
The stop loss is placed at 0.6422, an overlap resistance level.
High Risk Investment Warning
Trading Forex/CFDs on margin carries a high level of risk and may not be suitable for all investors. Leverage can work against you.
Stratos Markets Limited (www.fxcm.com):
CFDs are complex instruments and come with a high risk of losing money rapidly due to leverage. 68% of retail investor accounts lose money when trading CFDs with this provider. You should consider whether you understand how CFDs work and whether you can afford to take the high risk of losing your money.
Stratos Europe Ltd, previously FXCM EU Ltd (www.fxcm.com):
CFDs are complex instruments and come with a high risk of losing money rapidly due to leverage. 73% of retail investor accounts lose money when trading CFDs with this provider. You should consider whether you understand how CFDs work and whether you can afford to take the high risk of losing your money.
Stratos Trading Pty. Limited (www.fxcm.com):
Trading FX/CFDs carries significant risks. FXCM AU (AFSL 309763), please read the Financial Services Guide, Product Disclosure Statement, Target Market Determination and Terms of Business at www.fxcm.com
Stratos Global LLC (www.fxcm.com):
Losses can exceed deposits.
Please be advised that the information presented on TradingView is provided to FXCM (‘Company’, ‘we’) by a third-party provider (‘TFA Global Pte Ltd’). Please be reminded that you are solely responsible for the trading decisions on your account. There is a very high degree of risk involved in trading. Any information and/or content is intended entirely for research, educational and informational purposes only and does not constitute investment or consultation advice or investment strategy. The information is not tailored to the investment needs of any specific person and therefore does not involve a consideration of any of the investment objectives, financial situation or needs of any viewer that may receive it. Kindly also note that past performance is not a reliable indicator of future results. Actual results may differ materially from those anticipated in forward-looking or past performance statements. We assume no liability as to the accuracy or completeness of any of the information and/or content provided herein and the Company cannot be held responsible for any omission, mistake nor for any loss or damage including without limitation to any loss of profit which may arise from reliance on any information supplied by TFA Global Pte Ltd.
The speaker(s) is neither an employee, agent nor representative of FXCM and is therefore acting independently. The opinions given are their own, constitute general market commentary, and do not constitute the opinion or advice of FXCM or any form of personal or investment advice. FXCM neither endorses nor guarantees offerings of third party speakers, nor is FXCM responsible for the content, veracity or opinions of third-party speakers, presenters or participants.

AUD/USD "The AUSSIE" Forex Market Heist Plan on Bullish🌟Hi! Hola! Ola! Bonjour! Hallo!🌟
Dear Money Makers & Robbers, 🤑 💰
Based on 🔥Thief Trading style technical and fundamental analysis🔥, here is our master plan to heist the AUD/USD "The AUSSIE" Forex market. Please adhere to the strategy I've outlined in the chart, which emphasizes long entry. Our aim is the high-risk Red Zone. Risky level, overbought market, consolidation, trend reversal, trap at the level where traders and bearish robbers are stronger. Be wealthy and safe trade.💪🏆🎉
Entry 📈 : Traders & Thieves with New Entry A bull trade can be initiated at any price level.
However I advise placing Buy limit orders within a 15 or 30 minute timeframe. Entry from the most recent or closest low or high level should be in retest.
Stop Loss 🛑: Using the 4H period, the recent / nearest low or high level.
Goal 🎯: 0.63800 (or) Escape Before the Target
Scalpers, take note 👀 : only scalp on the Long side. If you have a lot of money, you can go straight away; if not, you can join swing traders and carry out the robbery plan. Use trailing SL to safeguard your money 💰.
Fundamental Outlook 📰🗞️
The AUD/USD pair is looking interesting right now, with some mixed signals from the latest analysis. On one hand, the pair has stabilized at its horizontal support area, which could lead to a bullish continuation, with the price potentially breaking above the range's resistance. On the other hand, some experts are warning of a potential reversal, with the pair showing signs of exhaustion and a possible shift in momentum.
In terms of fundamentals, the Australian Consumer Inflation Expectations for July increased 6.3% annualized, while the Australian Employment Change for June came in at 88.4K and the Unemployment Rate at 3.5% . The US Initial Jobless Claims for the week of July 9th are predicted at 235K, and US Continuing Claims for the week of July 2nd are predicted at 1,383K. The US PPI for June is predicted to increase 0.8% monthly and 10.7% annualized.
The forecast for the AUD/USD turned bullish after the pair stabilized at its horizontal support area, with short-term volatility likely to rise as bulls and bears fight for control. However, the Ichimoku Kinko Hyo Cloud continues to apply downside pressure, suggesting a rocky path higher. Traders should monitor the CCI after it has formed a positive divergence in extreme oversold territory followed by a breakout above -100.
Overall, it's a bit of a mixed bag, but the bullish scenario is gaining traction. The AUD/USD pair could move in a bullish direction.
BULLISH FACTORS:
Strong US Economy: A strong US economy could lead to an increase in demand for the US dollar, which could put upward pressure on the AUD/USD pair.
Interest Rate Differentials: The interest rate differential between the US and Australia is expected to remain positive, which could support the US dollar and put upward pressure on the AUD/USD pair.
Commodity Prices: A rise in commodity prices, particularly iron ore, could put upward pressure on the Australian dollar and support the AUD/USD pair.
Trading Alert⚠️ : News Releases and Position Management 📰 🗞️ 🚫🚏
As a reminder, news releases can have a significant impact on market prices and volatility. To minimize potential losses and protect your running positions,
we recommend the following:
Avoid taking new trades during news releases
Use trailing stop-loss orders to protect your running positions and lock in profits
Please note that this is a general analysis and not personalized investment advice. It's essential to consider your own risk tolerance and market analysis before making any investment decisions.
Keep in mind that these factors can change rapidly, and it's essential to stay up-to-date with market developments and adjust your analysis accordingly.
💖Supporting our robbery plan will enable us to effortlessly make and steal money 💰💵 Tell your friends, Colleagues and family to follow, like, and share. Boost the strength of our robbery team. Every day in this market make money with ease by using the Thief Trading Style.🏆💪🤝❤️🎉🚀
I'll see you soon with another heist plan, so stay tuned 🫂

AUDUSD Set To Fall! SELL!
My dear followers,
This is my opinion on the AUDUSD next move:
The asset is approaching an important pivot point 0.6274
Bias - Bearish
Safe Stop Loss - 0.6310
Technical Indicators: Supper Trend generates a clear short signal while Pivot Point HL is currently determining the overall Bearish trend of the market.
Goal - 0.6211
About Used Indicators:
For more efficient signals, super-trend is used in combination with other indicators like Pivot Points.
———————————
WISH YOU ALL LUCK

XAU/USD : Liquidity Grab at $2733, Next Trend Awaits NY Session!By analyzing the 4-hour gold chart, we see that the price finally broke out of the neutral range of $2702-$2714 today, reaching as high as $2733 and clearing liquidity above $2727. After this liquidity grab, gold experienced a slight correction, retracing to $2717. Currently, the price is trading around $2722.
As the New York market opens, we’ll see if gold can establish its next trend. It’s still too early to declare a bearish shift, as the bullish trend remains intact until the price breaks and stabilizes below $2688. For now, consider these levels for positions:
Supply Zones: $2727, $2742, $2753
Demand Zones: $2717, $2711, $2703
Please support me with your likes and comments to motivate me to share more analysis with you and share your opinion about the possible trend of this chart with me !
Best Regards , Arman Shaban

AUDUSD Long!AUDUSD Long!
Tight stop-loss, staying optimistic on the Aussie dollar long.
Remember to manage your risk diligently!

Bearish drop?THE Aussie (AUD/USD) has reacted off the pivot and could drop to the 50% Fibonacci support.
Pivot: 0.6292
1st Support: 0.6217
1st Resistance: 0.6345
Risk Warning:
Trading Forex and CFDs carries a high level of risk to your capital and you should only trade with money you can afford to lose. Trading Forex and CFDs may not be suitable for all investors, so please ensure that you fully understand the risks involved and seek independent advice if necessary.
Disclaimer:
The above opinions given constitute general market commentary, and do not constitute the opinion or advice of IC Markets or any form of personal or investment advice.
Any opinions, news, research, analyses, prices, other information, or links to third-party sites contained on this website are provided on an "as-is" basis, are intended only to be informative, is not an advice nor a recommendation, nor research, or a record of our trading prices, or an offer of, or solicitation for a transaction in any financial instrument and thus should not be treated as such. The information provided does not involve any specific investment objectives, financial situation and needs of any specific person who may receive it. Please be aware, that past performance is not a reliable indicator of future performance and/or results. Past Performance or Forward-looking scenarios based upon the reasonable beliefs of the third-party provider are not a guarantee of future performance. Actual results may differ materially from those anticipated in forward-looking or past performance statements. IC Markets makes no representation or warranty and assumes no liability as to the accuracy or completeness of the information provided, nor any loss arising from any investment based on a recommendation, forecast or any information supplied by any third-party.

AUDUSD Potential 1:3 up to 1:11 RR | POSITION | LONGAs seen in the chart, it was expected that the ideal "supply" zone was swept. As a retailer, your normal reaction is to buy on that support area; however, looking at the bigger picture, due to the momentum of the bears, there was no clear indication for us to buy in that area, hence using SMC, we should be buying at our actual discount/supply zone. By buying in this area, we can potentially reach 1:11 RR with a minimum RR of 1:3, a reward I am sure that most of us would like, especially for those trading with big lots.
Reminder: Do not risk more than 1-3% of your port so you can make up your losses.
Disclaimer: I am not a guru or a professional trader, I am simply sharing my insight based on my understanding of the market.

FOREX Forecast UPDATES! Jan 22, WednesdayIn this video, we will update the forecasts for the following FX markets:
USD Index
EURUSD
GBPUSD
AUDUSD
NZDUSD
CAD, USDCAD
CHF, USDCHF
JPY, USDJPY
The USD Index is now reacting to the Weekly Supply Zone, turning over. There was a bearish MSS, so sells are valid. A BOS would confirm the bearish trend starting, but we need to see how the price action plays out over the next two days.
Enjoy!
May profits be upon you.
Leave any questions or comments in the comment section.
I appreciate any feedback from my viewers!
Like and/or subscribe if you want more accurate analysis.
Thank you so much!
Disclaimer:
I do not provide personal investment advice and I am not a qualified licensed investment advisor.
All information found here, including any ideas, opinions, views, predictions, forecasts, commentaries, suggestions, expressed or implied herein, are for informational, entertainment or educational purposes only and should not be construed as personal investment advice. While the information provided is believed to be accurate, it may include errors or inaccuracies.
I will not and cannot be held liable for any actions you take as a result of anything you read here.
Conduct your own due diligence, or consult a licensed financial advisor or broker before making any and all investment decisions. Any investments, trades, speculations, or decisions made on the basis of any information found on this channel, expressed or implied herein, are committed at your own risk, financial or otherwise.

AUSSIE H1 Sweetpot! Buyers market!
Assie AUDUSD Long!
Taking a long position on this Aussie sweetpot—does it have potential? Let’s find out while locking in profits along the way.
Heed your DD!

Why dips appear favourable for AUD/USD bullsTrump's reluctance immediately sign an executive order to implement tariffs on China has allowed the yuan to rise against the US dollar. And where the yuan goes, AUD/USD tends to follow these days. And give AUD/USD has already seen an extended move to the downside, some bullish mean reversion is surely due.
The weekly RSI reached oversold ahead of a false break of the 2022 low, and a bullish divergence also formed on the daily RSI. A higher low has formed on prices, and I suspect AUD/USD is due at least one more leg higher.
Bulls could seek dips towards 0.621 or the 10/20-day EMAs in anticpation of a move up towards the August low, a break above which brings 65c into view near the high-volume node (HVN) from the decline from September to January.
Matt Simpson, Market Analyst at City Index and Forex.com

AUDUSD potential buyMy last idea on this pair did move up & hit TP1 as I predicated. An order block was previously on the same level as TP1 from last week is now gone indicating that this price might move back up.
As this is a long term trade it might take a few days to play out so my prediction is that it move down to retest the green oderblock then bounce up. I would exit at TP1 again and it it breaks past TP1 trail stop till you reach TP3

AUD/USD BEARS WILL DOMINATE THE MARKET|SHORT
Hello, Friends!
AUD/USD uptrend evident from the last 1W green candle makes short trades more risky, but the current set-up targeting 0.616 area still presents a good opportunity for us to sell the pair because the resistance line is nearby and the BB upper band is close which indicates the overbought state of the AUD/USD pair.
✅LIKE AND COMMENT MY IDEAS✅

Ghost Traders FX AUD/USD Trend Continuation [SHORT]The Ghost Traders FX gang has been taking shorts pretty much off every pump for very easy wins, as per last idea for Short, price is still yet to take the weak low which I would attribute to just manipulation & speculation in the market during Trump's Inauguration week.
My bias is still short until 0.613 is taken and 0.6 - 0.611 is tapped into.
Trade Record for GTFX stands at 126 wins, 17 breakevens, 7 losses with a 94%+ W/R & +2670 pips gained.
Best of luck to everyone.

Could the Aussie bounce from here?The price is falling towards the pivot and could bounce to the 1st resistance which is a pullback resistance.
Pivot: 0.6179
1st Support: 0.6130
1st Resistance: 0.6284
Risk Warning:
Trading Forex and CFDs carries a high level of risk to your capital and you should only trade with money you can afford to lose. Trading Forex and CFDs may not be suitable for all investors, so please ensure that you fully understand the risks involved and seek independent advice if necessary.
Disclaimer:
The above opinions given constitute general market commentary, and do not constitute the opinion or advice of IC Markets or any form of personal or investment advice.
Any opinions, news, research, analyses, prices, other information, or links to third-party sites contained on this website are provided on an "as-is" basis, are intended only to be informative, is not an advice nor a recommendation, nor research, or a record of our trading prices, or an offer of, or solicitation for a transaction in any financial instrument and thus should not be treated as such. The information provided does not involve any specific investment objectives, financial situation and needs of any specific person who may receive it. Please be aware, that past performance is not a reliable indicator of future performance and/or results. Past Performance or Forward-looking scenarios based upon the reasonable beliefs of the third-party provider are not a guarantee of future performance. Actual results may differ materially from those anticipated in forward-looking or past performance statements. IC Markets makes no representation or warranty and assumes no liability as to the accuracy or completeness of the information provided, nor any loss arising from any investment based on a recommendation, forecast or any information supplied by any third-party.

AUD_USD WILL FALL|SHORT|
✅AUD_USD will be retesting a resistance level of 0.6300 soon
From where I am expecting a bearish reaction
With the price going down but we need
To wait for a reversal pattern to form
Before entering the trade, so that we
Get a higher success probability of the trade
SHORT🔥
✅Like and subscribe to never miss a new idea!✅

AUDUSD Potential UpsidesHey Traders, in today's trading session we are monitoring AUDUSD for a buying opportunity around 0.61700 zone, AUDUSD is trading in an uptrend and currently is in a correction phase in which it is approaching the trend at 0.61700 support and resistance area.
Trade safe, Joe.

Aussie H4 | Approaching swing-high resistanceThe Aussie (AUD/USD) is rising towards a swing-high resistance and could potentially reverse off this level to drop lower.
Sell entry is at 0.6242 which is a swing-high resistance.
Stop loss is at 0.6312 which is a level that sits above the 38.2% Fibonacci retracement level and a swing-high resistance.
Take profit is at 0.6135 which is a swing-low support.
High Risk Investment Warning
Trading Forex/CFDs on margin carries a high level of risk and may not be suitable for all investors. Leverage can work against you.
Stratos Markets Limited (www.fxcm.com):
CFDs are complex instruments and come with a high risk of losing money rapidly due to leverage. 64% of retail investor accounts lose money when trading CFDs with this provider. You should consider whether you understand how CFDs work and whether you can afford to take the high risk of losing your money.
Stratos Europe Ltd (www.fxcm.com):
CFDs are complex instruments and come with a high risk of losing money rapidly due to leverage. 66% of retail investor accounts lose money when trading CFDs with this provider. You should consider whether you understand how CFDs work and whether you can afford to take the high risk of losing your money.
Stratos Trading Pty. Limited (www.fxcm.com):
Trading FX/CFDs carries significant risks. FXCM AU (AFSL 309763), please read the Financial Services Guide, Product Disclosure Statement, Target Market Determination and Terms of Business at www.fxcm.com
Stratos Global LLC (www.fxcm.com):
Losses can exceed deposits.
Please be advised that the information presented on TradingView is provided to FXCM (‘Company’, ‘we’) by a third-party provider (‘TFA Global Pte Ltd’). Please be reminded that you are solely responsible for the trading decisions on your account. There is a very high degree of risk involved in trading. Any information and/or content is intended entirely for research, educational and informational purposes only and does not constitute investment or consultation advice or investment strategy. The information is not tailored to the investment needs of any specific person and therefore does not involve a consideration of any of the investment objectives, financial situation or needs of any viewer that may receive it. Kindly also note that past performance is not a reliable indicator of future results. Actual results may differ materially from those anticipated in forward-looking or past performance statements. We assume no liability as to the accuracy or completeness of any of the information and/or content provided herein and the Company cannot be held responsible for any omission, mistake nor for any loss or damage including without limitation to any loss of profit which may arise from reliance on any information supplied by TFA Global Pte Ltd.
The speaker(s) is neither an employee, agent nor representative of FXCM and is therefore acting independently. The opinions given are their own, constitute general market commentary, and do not constitute the opinion or advice of FXCM or any form of personal or investment advice. FXCM neither endorses nor guarantees offerings of third-party speakers, nor is FXCM responsible for the content, veracity or opinions of third-party speakers, presenters or participants.

The Aussie has a strong bearish momentum, could it drop further?The price is rising towards the pivot which is a pullback resistance and could drop to the pullback support.
Pivot: 0.6250
1st Support: 0.6144
1st Resistance: 0.6301
Risk Warning:
Trading Forex and CFDs carries a high level of risk to your capital and you should only trade with money you can afford to lose. Trading Forex and CFDs may not be suitable for all investors, so please ensure that you fully understand the risks involved and seek independent advice if necessary.
Disclaimer:
The above opinions given constitute general market commentary, and do not constitute the opinion or advice of IC Markets or any form of personal or investment advice.
Any opinions, news, research, analyses, prices, other information, or links to third-party sites contained on this website are provided on an "as-is" basis, are intended only to be informative, is not an advice nor a recommendation, nor research, or a record of our trading prices, or an offer of, or solicitation for a transaction in any financial instrument and thus should not be treated as such. The information provided does not involve any specific investment objectives, financial situation and needs of any specific person who may receive it. Please be aware, that past performance is not a reliable indicator of future performance and/or results. Past Performance or Forward-looking scenarios based upon the reasonable beliefs of the third-party provider are not a guarantee of future performance. Actual results may differ materially from those anticipated in forward-looking or past performance statements. IC Markets makes no representation or warranty and assumes no liability as to the accuracy or completeness of the information provided, nor any loss arising from any investment based on a recommendation, forecast or any information supplied by any third-party.

AUDUSD (4H) UT ANALYSIS🔹 Current Market Overview:
The AUD/USD pair is trading at a current price of 0.62085 . Recent price movements suggest consolidation near this level, forming a potential base for upward momentum.
📈 Buy Signal Details:
Entry Price: 0.6243
Stop Loss: 0.61994
Take Profit: 0.62866
🔹 Key Observations:
Trend Analysis:
The pair is recovering from oversold conditions on the 4-hour timeframe.
RSI indicates neutral-to-bullish momentum, currently hovering near the 50-55 range .
Support and Resistance Levels:
Strong support identified at 0.6190–0.6200 .
Immediate resistance is observed at 0.6240–0.6250 , aligning with our entry point.
Volume Analysis:
Buying pressure is building, with consistent above-average volume near 0.6200 .
🔹 Strategy Commentary:
A break above 0.6243 confirms bullish momentum and validates the buy entry.
A well-placed stop loss at 0.61994 ensures minimal downside risk.
The take-profit target at 0.62866 aligns with the upper channel of recent price action, offering a favorable risk-to-reward ratio.
🔹 Risk Management Tips:
Consider monitoring economic events that may impact AUD, such as commodity price trends or Reserve Bank of Australia announcements.
Adjust your position size based on your risk tolerance, ensuring the total loss from the stop loss remains within your acceptable limits.
