AUDUSD SHORTbased on the technicals of the 4h and 1h, I would expect this to approach the 0.63000 level once more before falling(asian session). At london open I will be looking for rejection of this level and will begin taking short positions when possible.
AUDUSD

AUDUSD Scenario 1.1.2025The trade is still going according to plan, I'm just not sure if we have the SFP confirmed or not, after the SFP is set below the low, we can consider a long position, I'm still out of the market for now.

Levels discussed on livestream 6th Jan 20256th January 2025
DXY: Consolidating along 108.90, could test 108.50 (61.8%) before trading higher again to 109 round number (below 108.50 could test bottom of channel)
NZDUSD: Sell 0.5575 SL 30 TP 60
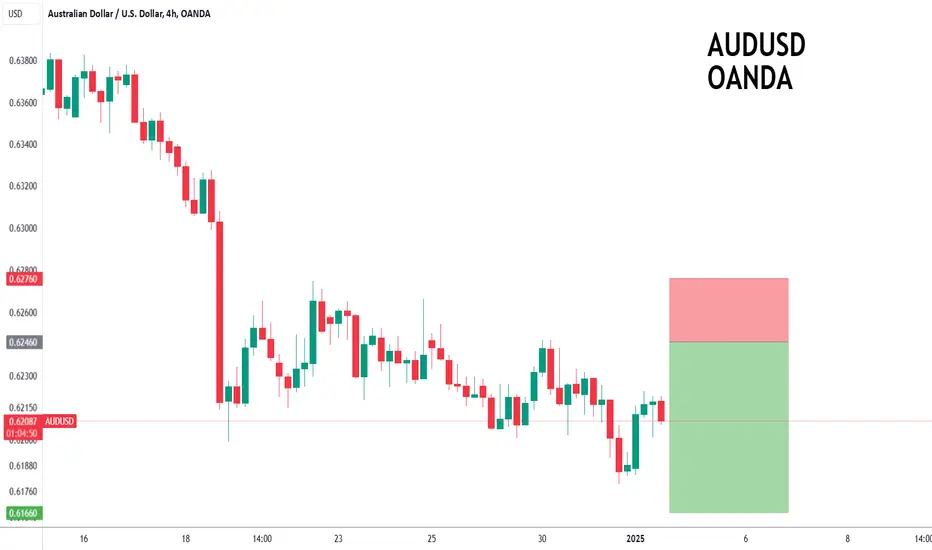
AUDUSD: Sell 0.6265 SL 30 TP 60
GBPUSD: Wait for reaction at 1.25 round number resistance level
EURUSD: Look for rejection of 1.04, Sell 1.0315 SL 30 TP 90
USDJPY: Sell 157.65 SL 50 TP 150
EURJPY: Buy 163.55 SL 40 TP 120
GBPJPY: Sell 196.40 SL 50 TP 150
USDCHF: Look for reaction at bottom of channel 0.9060 or support level 0.9020
USDCAD: Ranging between 1.4335 and 1.4465
XAUUSD: Break 2624 to trade down to 2610 (bullish trendline)

AUDUSD TRADE IDEA: BUY | LONG (06/01/25)Price has created its range - I expect it to either sweep upwards or simply re enter for a buy.
RR: 2.35
This is not financial advice - Trade safely and at your own risk.

GBPUSD Analysis: Falling Wedge Pattern and Potential 500+ Pips The forex pair GBPUSD is currently trading at 1.247, with a target price set at 1.290, presenting a potential gain of 500+ pips. The market is forming a falling wedge pattern, a bullish technical setup that often signals a potential breakout to the upside. This pattern indicates a gradual narrowing of price movement, with sellers losing momentum and buyers preparing for a reversal. Traders are closely watching for a breakout above the wedge, which would confirm the bullish bias. A breakout could trigger significant upward movement, aligning with the target price. This setup provides an attractive risk-to-reward opportunity for buyers. However, confirmation through price action and volume is essential before entering a trade. Risk management is critical due to forex market volatility. Monitoring momentum indicators can help validate the expected breakout. The next move depends on how the pair reacts at key resistance levels.

Analyzing AUDCAD Falling Wedge Breakout and 200+ Pips Target The forex pair AUDCAD is currently trading at 0.89700, with a target price of 0.91500, indicating an upward potential of 200+ pips. A falling wedge breakout has occurred, which is a bullish technical pattern that often signals a trend reversal or continuation of an uptrend. The breakout suggests buyers have taken control, pushing the price higher. The retesting phase has also been completed, confirming the breakout's validity and strengthening the bullish outlook. Traders often wait for retests as confirmation to enter trades with reduced risk. The target price aligns with the expected upward momentum post-breakout. With the breakout confirmed, buyers might find this setup attractive. Price action and momentum indicators should be monitored for sustained movement toward the target. Risk management is crucial, given forex volatility.

AUDUSD H4 | Bullish Bounce ?Based on the H4 chart analysis, we can see that the price is falling to our buy entry at 0.6217, which is a pullback support close to the 38.2% Fibo retracement.
Our take profit will be at 0.6242, a multi-swing high resistance.
The stop loss will be placed at 0.6199, which is an overlap support level.
High Risk Investment Warning
Trading Forex/CFDs on margin carries a high level of risk and may not be suitable for all investors. Leverage can work against you.
Stratos Markets Limited (www.fxcm.com):
CFDs are complex instruments and come with a high risk of losing money rapidly due to leverage. 64% of retail investor accounts lose money when trading CFDs with this provider. You should consider whether you understand how CFDs work and whether you can afford to take the high risk of losing your money.
Stratos Europe Ltd, previously FXCM EU Ltd (www.fxcm.com):
CFDs are complex instruments and come with a high risk of losing money rapidly due to leverage. 66% of retail investor accounts lose money when trading CFDs with this provider. You should consider whether you understand how CFDs work and whether you can afford to take the high risk of losing your money.
Stratos Trading Pty. Limited (www.fxcm.com):
Trading FX/CFDs carries significant risks. FXCM AU (AFSL 309763), please read the Financial Services Guide, Product Disclosure Statement, Target Market Determination and Terms of Business at www.fxcm.com
Stratos Global LLC (www.fxcm.com):
Losses can exceed deposits.
Please be advised that the information presented on TradingView is provided to FXCM (‘Company’, ‘we’) by a third-party provider (‘TFA Global Pte Ltd’). Please be reminded that you are solely responsible for the trading decisions on your account. There is a very high degree of risk involved in trading. Any information and/or content is intended entirely for research, educational and informational purposes only and does not constitute investment or consultation advice or investment strategy. The information is not tailored to the investment needs of any specific person and therefore does not involve a consideration of any of the investment objectives, financial situation or needs of any viewer that may receive it. Kindly also note that past performance is not a reliable indicator of future results. Actual results may differ materially from those anticipated in forward-looking or past performance statements. We assume no liability as to the accuracy or completeness of any of the information and/or content provided herein and the Company cannot be held responsible for any omission, mistake nor for any loss or damage including without limitation to any loss of profit which may arise from reliance on any information supplied by TFA Global Pte Ltd.
The speaker(s) is neither an employee, agent nor representative of FXCM and is therefore acting independently. The opinions given are their own, constitute general market commentary, and do not constitute the opinion or advice of FXCM or any form of personal or investment advice. FXCM neither endorses nor guarantees offerings of third party speakers, nor is FXCM responsible for the content, veracity or opinions of third-party speakers, presenters or participants.

AUDUSD Will Go Up From Support! Buy!
Here is our detailed technical review for AUDUSD.
Time Frame: 12h
Current Trend: Bullish
Sentiment: Oversold (based on 7-period RSI)
Forecast: Bullish
The price is testing a key support 0.621.
Current market trend & oversold RSI makes me think that buyers will push the price. I will anticipate a bullish movement at least to 0.633 level.
P.S
Overbought describes a period of time where there has been a significant and consistent upward move in price over a period of time without much pullback.
Like and subscribe and comment my ideas if you enjoy them!

Potential Counter Trend Trade for a possible longFX:AUDUSD has been on a steady drop looking at it on the monthly time frame. However it has come to a major Monthly support area and showing some significant slow down in momentum. It is very more than likely to see price bounce off that area and start a bullish move.
I will however wait for a break of an immediate structure on the H4 TF retest the area before taking a trade. I recommend proper risk management if considering this trade.
Past results does not guarantee future results

AUD/USD at Support into 2025 OpenAUD/USD is testing downtrend support here into the start of the month / year at the lower parallel. The focus is on possible inflection off the 2022 low / yearly open at 6170/88 over he next few days.
Bottom line: Rallies would need to be limited to 6348/62 IF price is heading lower here with a close below this pivot zone exposing the 61.8% extension of the 2021 high / 78.6% retracement of he 2020 advance at 6022/45.
Published a more in-depth review of this AUD/USD setup earlier today.
MB

AUDUSD Continues To Fall!Hey Traders, in this week we are monitoring AUDUSD for a selling opportunity around 0.62250 zone, AUDUSD is trading in a downtrend and currently is in a correction phase in which it is approaching 0.62250 support and resistance area.
Trade safe, Joe.

AUDUSD Clear cut triangle, extended move in the waitingThis beggining of the year it seems triangles are shaping up and extended moves following breakout are in the waiting. Following yesterday's idea, this one is similar but now on AUDUSD.
A clear cut triangle appeared in the 1H chart and the breakout should be happening in the next 24 hours. Better to wait for the breakout to be confirmed in the 4H or ideally in the daily.
Then, it is up to you how to play it. I have put a FIB retracement ranging between the main weekly support and resistance, starting from the 2020 low and the 2021 high. The FIB levels match very well the price action and offer good guidance.

🦘🦘 Aussie Kangaroo Returns Home In The OutbackThe Australian dollar has been taking a bath. It’s gone from buying 71 US cents at the beginning of the year to netting you just 63.3 US cents against the benchmark greenback.
The dollar is down over the last year against most currencies, and down over the past few weeks against almost every currency.
The humble Aussie dollar is suffering in particular against European currencies: Pound Sterling, the Swiss Franc and the Euro.
However, even in Japan where the AUD is up over the year so far, it is down in recent weeks.
What’s going on? The answer is two-fold.
👉 America’s economy is stronger than expected. And China is weaker, so Chinese yuan has little to no chance of dethroning the US dollar, even as global de-dollarization happens.
👉 Australia gets hit on both of those trades.
Difference between 10-Year United States and Australian Govt Debt becomes lower
Technical graph for FX:AUDUSD indicates that Aussie has a lot down to deliver.

AUD_USD SWING LONG|
✅AUD_USD is set to retest a
Strong support level below at 0.6171
After trading in a local downtrend from some time
Which makes a bullish rebound a likely scenario
With the target being a local resistance above at 0.6224
LONG🚀
✅Like and subscribe to never miss a new idea!✅

AUDUSD to continue in the downward move?AUDUSD - 24h expiry
Broken out of the channel formation to the downside.
Trades at the lowest level in 26-months.
Buying posted in Asia.
Bespoke resistance is located at 0.6246.
The previous swing high is located at 0.6246.
We look to Sell at 0.6246 (stop at 0.6276)
Our profit targets will be 0.6166 and 0.6146
Resistance: 0.6246 / 0.6271 / 0.6275
Support: 0.6179 / 0.6150 / 0.6130
Risk Disclaimer
The trade ideas beyond this page are for informational purposes only and do not constitute investment advice or a solicitation to trade. This information is provided by Signal Centre, a third-party unaffiliated with OANDA, and is intended for general circulation only. OANDA does not guarantee the accuracy of this information and assumes no responsibilities for the information provided by the third party. The information does not take into account the specific investment objectives, financial situation, or particular needs of any particular person. You should take into account your specific investment objectives, financial situation, and particular needs before making a commitment to trade, including seeking advice from an independent financial adviser regarding the suitability of the investment, under a separate engagement, as you deem fit.
You accept that you assume all risks in independently viewing the contents and selecting a chosen strategy.
Where the research is distributed in Singapore to a person who is not an Accredited Investor, Expert Investor or an Institutional Investor, Oanda Asia Pacific Pte Ltd (“OAP“) accepts legal responsibility for the contents of the report to such persons only to the extent required by law. Singapore customers should contact OAP at 6579 8289 for matters arising from, or in connection with, the information/research distributed.
Aussie H4 | Bearish downturn to extend further?The Aussie (AUD/USD) is rising towards a swing-high resistance and could potentially reverse off this level to drop lower. The presence of the red Ichimoku Cloud adds further significance to the strength of the bearish momentum.
Sell entry is at 0.6242 which is a swing-high resistance.
Stop loss is at 0.6284 which is a level that sits above the 23.6% Fibonacci retracement and a pullback resistance.
Take profit is at 0.6184 which is a swing-low support.
High Risk Investment Warning
Trading Forex/CFDs on margin carries a high level of risk and may not be suitable for all investors. Leverage can work against you.
Stratos Markets Limited (www.fxcm.com):
CFDs are complex instruments and come with a high risk of losing money rapidly due to leverage. 64% of retail investor accounts lose money when trading CFDs with this provider. You should consider whether you understand how CFDs work and whether you can afford to take the high risk of losing your money.
Stratos Europe Ltd (www.fxcm.com):
CFDs are complex instruments and come with a high risk of losing money rapidly due to leverage. 66% of retail investor accounts lose money when trading CFDs with this provider. You should consider whether you understand how CFDs work and whether you can afford to take the high risk of losing your money.
Stratos Trading Pty. Limited (www.fxcm.com):
Trading FX/CFDs carries significant risks. FXCM AU (AFSL 309763), please read the Financial Services Guide, Product Disclosure Statement, Target Market Determination and Terms of Business at www.fxcm.com
Stratos Global LLC (www.fxcm.com):
Losses can exceed deposits.
Please be advised that the information presented on TradingView is provided to FXCM (‘Company’, ‘we’) by a third-party provider (‘TFA Global Pte Ltd’). Please be reminded that you are solely responsible for the trading decisions on your account. There is a very high degree of risk involved in trading. Any information and/or content is intended entirely for research, educational and informational purposes only and does not constitute investment or consultation advice or investment strategy. The information is not tailored to the investment needs of any specific person and therefore does not involve a consideration of any of the investment objectives, financial situation or needs of any viewer that may receive it. Kindly also note that past performance is not a reliable indicator of future results. Actual results may differ materially from those anticipated in forward-looking or past performance statements. We assume no liability as to the accuracy or completeness of any of the information and/or content provided herein and the Company cannot be held responsible for any omission, mistake nor for any loss or damage including without limitation to any loss of profit which may arise from reliance on any information supplied by TFA Global Pte Ltd.
The speaker(s) is neither an employee, agent nor representative of FXCM and is therefore acting independently. The opinions given are their own, constitute general market commentary, and do not constitute the opinion or advice of FXCM or any form of personal or investment advice. FXCM neither endorses nor guarantees offerings of third-party speakers, nor is FXCM responsible for the content, veracity or opinions of third-party speakers, presenters or participants.

Could the Aussie bounce from here?The price is falling towards the pivot which is a pullback support and could bounce to the 1st resistance which acts as a pullback resistance.
Pivot: 0.6200
1st Support: 0.6181
1st Resistance: 0.6232
Risk Warning:
Trading Forex and CFDs carries a high level of risk to your capital and you should only trade with money you can afford to lose. Trading Forex and CFDs may not be suitable for all investors, so please ensure that you fully understand the risks involved and seek independent advice if necessary.
Disclaimer:
The above opinions given constitute general market commentary, and do not constitute the opinion or advice of IC Markets or any form of personal or investment advice.
Any opinions, news, research, analyses, prices, other information, or links to third-party sites contained on this website are provided on an "as-is" basis, are intended only to be informative, is not an advice nor a recommendation, nor research, or a record of our trading prices, or an offer of, or solicitation for a transaction in any financial instrument and thus should not be treated as such. The information provided does not involve any specific investment objectives, financial situation and needs of any specific person who may receive it. Please be aware, that past performance is not a reliable indicator of future performance and/or results. Past Performance or Forward-looking scenarios based upon the reasonable beliefs of the third-party provider are not a guarantee of future performance. Actual results may differ materially from those anticipated in forward-looking or past performance statements. IC Markets makes no representation or warranty and assumes no liability as to the accuracy or completeness of the information provided, nor any loss arising from any investment based on a recommendation, forecast or any information supplied by any third-party.

Aussie H1 | Overlap resistance at 61.8% Fibonacci retracementThe Aussie (AUD/USD) is rising towards an overlap resistance and could potentially reverse off this level to drop lower.
Sell entry is at 0.6246 which is an overlap resistance that aligns with the 61.8% Fibonacci retracement.
Stop loss is at 0.6284 which is a level that sits above a multi-swing-high resistance.
Take profit is at 0.6199 which is a swing-low support.
High Risk Investment Warning
Trading Forex/CFDs on margin carries a high level of risk and may not be suitable for all investors. Leverage can work against you.
Stratos Markets Limited (www.fxcm.com):
CFDs are complex instruments and come with a high risk of losing money rapidly due to leverage. 64% of retail investor accounts lose money when trading CFDs with this provider. You should consider whether you understand how CFDs work and whether you can afford to take the high risk of losing your money.
Stratos Europe Ltd (www.fxcm.com):
CFDs are complex instruments and come with a high risk of losing money rapidly due to leverage. 66% of retail investor accounts lose money when trading CFDs with this provider. You should consider whether you understand how CFDs work and whether you can afford to take the high risk of losing your money.
Stratos Trading Pty. Limited (www.fxcm.com):
Trading FX/CFDs carries significant risks. FXCM AU (AFSL 309763), please read the Financial Services Guide, Product Disclosure Statement, Target Market Determination and Terms of Business at www.fxcm.com
Stratos Global LLC (www.fxcm.com):
Losses can exceed deposits.
Please be advised that the information presented on TradingView is provided to FXCM (‘Company’, ‘we’) by a third-party provider (‘TFA Global Pte Ltd’). Please be reminded that you are solely responsible for the trading decisions on your account. There is a very high degree of risk involved in trading. Any information and/or content is intended entirely for research, educational and informational purposes only and does not constitute investment or consultation advice or investment strategy. The information is not tailored to the investment needs of any specific person and therefore does not involve a consideration of any of the investment objectives, financial situation or needs of any viewer that may receive it. Kindly also note that past performance is not a reliable indicator of future results. Actual results may differ materially from those anticipated in forward-looking or past performance statements. We assume no liability as to the accuracy or completeness of any of the information and/or content provided herein and the Company cannot be held responsible for any omission, mistake nor for any loss or damage including without limitation to any loss of profit which may arise from reliance on any information supplied by TFA Global Pte Ltd.
The speaker(s) is neither an employee, agent nor representative of FXCM and is therefore acting independently. The opinions given are their own, constitute general market commentary, and do not constitute the opinion or advice of FXCM or any form of personal or investment advice. FXCM neither endorses nor guarantees offerings of third party speakers, nor is FXCM responsible for the content, veracity or opinions of third-party speakers, presenters or participants.

AUD/USD "The Aussie Dollar" Forex Market Bullish Heist Plan🌟Hi! Hola! Ola! Bonjour! Hallo!🌟
Dear Money Makers & Robbers, 🤑 💰
Based on 🔥Thief Trading style technical and fundamental analysis🔥, here is our master plan to heist the AUD/USD "The Aussie Dollar" Forex market. Please adhere to the strategy I've outlined in the chart, which emphasizes long entry. Our aim is the high-risk Red Zone. Risky level, overbought market, consolidation, trend reversal, trap at the level where traders and bearish robbers are stronger. 👀 So Be Careful, wealthy and safe trade.💪🏆🎉
Entry 📈 : You can enter a Bull trade at any point,
however I advise placing Buy limit orders within a 15 or 30 minute timeframe. Entry from the most recent or closest low or high level should be in retest.
Stop Loss 🛑: Using the 2H period, the recent / nearest low or high level.
Goal 🎯: 0.63700
Scalpers, take note : only scalp on the Long side. If you have a lot of money, you can go straight away; if not, you can join swing traders and carry out the robbery plan. Use trailing SL to safeguard your money 💰.
Fundamental Outlook 📰 Economic Factors
Australia's Resilient Economy: Despite slowing growth, Australia's economy has shown resilience, with a strong labor market and steady consumer spending.
US Economic Slowdown: A potential slowdown in the US economy could lead to a decrease in interest rates, making the AUD more attractive.
Interest Rate Differential: Although the US has higher interest rates, the RBA's hawkish stance could maintain a relatively high interest rate differential, supporting the AUD.
Central Bank Policies
RBA's Hawkish Stance: The RBA's commitment to keeping interest rates higher to control inflation could support the AUD.
Fed's Dovish Pivot: A potential dovish pivot by the Fed could lead to a decrease in interest rates, making the AUD more attractive.
Sentiment Analysis
Risk Appetite: A rise in risk appetite among investors could lead to a shift towards higher-yielding currencies like the AUD.
US Dollar Weakness: A potential decline in the US dollar could support the AUD/USD pair.
Keep in mind that these factors can change rapidly, and it's essential to stay up-to-date with market developments and adjust your analysis accordingly.
Warning⚠️ : Our heist strategy is incompatible with Fundamental Analysis news 📰 🗞️. We'll wreck our plan by smashing the Stop Loss 🚫🚏. Avoid entering the market right after the news release.
Take advantage of the target and get away 🎯 Swing Traders Please reserve the half amount of money and watch for the next dynamic level or order block breakout. Once it is resolved, we can go on to the next new target in our heist plan.
💖Supporting our robbery plan will enable us to effortlessly make and steal money 💰💵 Tell your friends, Colleagues and family to follow, like, and share. Boost the strength of our robbery team. Every day in this market make money with ease by using the Thief Trading Style.🏆💪🤝❤️🎉🚀
I'll see you soon with another heist plan, so stay tuned 🫂

AUDUSD Long is the way. We have reached the very solid support level of this pair. It's time to ride the bull fam!

AUD-USD Risky Long! Buy!
Hello,Traders!
AUD-USD is trading in a
A strong downtrend but
The pair will soon hit a
Horizontal support level
Of 0.6166 so despite
Our bearish bias we will
Be expecting a local
Bullish rebound
Buy!
Comment and subscribe to help us grow!
Check out other forecasts below too!

GOLD IN CORRECTION FOR SELLOnly weekly is in buy but it give sub choch for sell which is day sell CHOCH
in day retracement also gives day sub choch for sell
now gold in day sub choch retracement confirm point strgy
if above 2608 it will continue to 2650-2660 which is day sub choch 50% fibo zone then
if we got 4hrs revers sell point on there we can place sell order on there other wise we must wait 2717-2725 extreme sell area(day sub choch OB) then we place aggressive entry on there
if market opens below 2608 our buy entry should be 2587 sl 2580 and sell analysis will be same
week=BUY
Day= sell and Retracement buy
4hrs-15mins-1min=buy
THIS ANALYSIS MAY CHANGE AFTER MARKET OPENS

DOUBLE BOTTOM BREAKOUT On M30 timeframe indicates a double bottom is currently forming from a bullish momentum after the price had deeply plummeted so the breakout confirms the Buy signal
