AUDUSD Long Term Trading IdeaHello Traders
In This Chart AUDUSD HOURLY Forex Forecast By FOREX PLANET
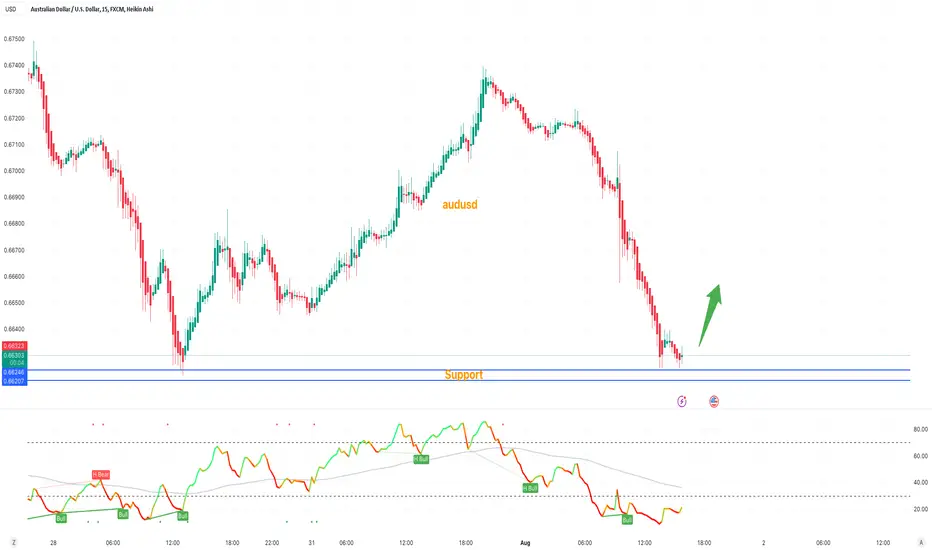
today AUDUSD analysis 👆
🟢This Chart includes_ (AUDUSD market update)
🟢What is The Next Opportunity on AUDUSD Market
🟢how to Enter to the Valid Entry With Assurance Profit
This CHART is For Trader's that Want to Improve Their Technical Analysis Skills and Their Trading By Understanding How To Analyze The Market Using Multiple Timeframes and Understanding The Bigger Picture on the Charts
Audusdanalysis

DeGRAM | AUDUSD kill zone for short opportunityAUDUSD is moving in the descending channel and has made lower lows.
The price is pulling back to the resistance level at 0.65000, which is the psychological level.
Price action formed a kill zone for the short opportunity: fibo level 78.60% and dynamic resistance.
We expect a bearish move from the kill zone.
-------------------
Share your opinion in the comments and support the idea with a like. Thanks for your support!


BluetonaFX - AUDUSD Near 2023 LowHi Traders!
AUDUSD is nearing its 2023 low at 0.64583. Looking at the price action on the 1D chart, our bearish stance worked well, and since the double top pattern was established, the market has been on a downtrend with no upside relief.
Yesterday we had a huge upside rejection candle at 0.66170, which we have highlighted on the chart. This is now a resistance area due to the aggressiveness of the long upside wick.
Due to 0.64583 being the yearly low for the AUDUSD, there is strong support expected here. The longer the market holds above this level, the more likely we are to see a reversal of the bearish trend we have had over the past couple of months. Additionally, the pattern will become a double bottom pattern if there is a hold above 0.64583.
Please remember to click on the like and follow buttons to support us.
We would also love to hear your thoughts.
Your support is greatly appreciated.
BluetonaFX

AUDUSD Analysis H4Here is my analysis for AUDUSD on H4 using Order Block. The price could go bearish, you can put a pending order on the Order block or find an entry on LTF within OB Zone. Trade Safe!

DREAMS FOREX | AUDUSDHello Traders..
First buy 90 pips profit and then sell with 100 pips profit..
Use good trade management only thing important in Trading is how you manage your trade...
Enjoy...

AUDUSD: Great area to BUY BIG :)Dear Traders, hope you are doing great, we have an excellent opportunity to buy AUDUSD, like other USD PAIRS we still believe prices to be bullish.

AUDUSD BUY STOP AUDUSD BUY STOP
Entry point :- 0.65730
Stop lose :- 0.64953
Target 1 :- 0.6651
Target 2 :- 0.6728
Target 3 :- 0.6806
Target 4 :- 0.6884
Target 5 :- 0.6961

AUDUSD Analysis 7Aug2023There was a slight change in the position of Elliot's notation compared to last week's analysis. If you see a pattern that resembles a bullish falling wedge, then the possibility of the current Wave correction is at the end of the period and will enter the beginning of the bullish again. This analysis of crows when the price drops more than the invalid area

DeGRAM | AUDUSD structure based tradeAUDUSD is near the major support level on the 4 hourly chart. It's consolidating on the daily chart.
Price action rebounded from this level twice. Price action is printing a potential double bottom at support.
There's a high chance that price bounces off the support if price creates a false break because we have a psychological level 0.6500.
-------------------
Share your opinion in the comments and support the idea with like. Thanks for your support!

A Short Trader May get happy today, on this AUD pair! {07/08/23}Educational Analysis says AUDUSD may go Short according to my technical.
This is not an entry signal. I have no concerns with your profit and loss from this analysis.
Why long?
Because AUDUSD respects an uptrend line facing down line on a 4-hour time frame.
The market is bearish but a strong AUD may change its direction and start a new trend soon.
The black line is the Order block
The RED line is high and low at the current price.
I HAVE NO CONCERNS WITH YOUR PROFIT OR LOSS,
Happy trading, FX Dollars.

AUDUSD,Bearish trend,Head and ShoulderGood afternoon,
I hope everyone had a succesful trading week and week in their daily lives. Here is a pre market forecast for AUDUSD this upcoming trading week. Last week, AUDUSD was bearish for the most of last week. Toward the end of the week it began a retracement process. Price broke the daily supply/demand area @0.65944.
Price is projected to continue bearish momentum to the next 4hr supply/demand area @0.65464. If price rejects this area, look for the head and shoulder formation to form to confirm this projection.
If there are any questions, comments, concerns, or you may have a similar analysis to mine please do not hesitate to share, comment, and boost this post.

AUDUSD Analysis. Some fakeouts. SignalHello Everyone. I want share my idea about AUDUSD.
In my last idea i detected many false brake outs, after that we still have it. i was longing this pair and still in position.
next week i will try long this pair and here is reason why.
Institutional made lot of brake outs long side but 0.689 LVL was interested for them. From 0.689 point we saw some slow bearish movements, i think they made this brake outs for filter people. I am longing next week this pair because on us dollar index broke weekly support which was strong, last week came for retest that and i think there will be strong sellers than buyers. dollar will continue bearish trend and AUD will rise versus dollar (i have us dollar index analysis which i will link in this idea).
I have 3 scene for this pair price movement.
1 Bullish - price has strong reaction on Fibonacci at levels, brake weak resistance at 0.678, then brake strong 0.689 LVL, price going up and test 0.71 weekly resistance.
2 Bearish - Price is not strong at fibonacci levels coming down and brake strong support at 0.6588.
3 Fake movement - price show us not strong at fibonacci levels coming down, making liquidity swing at 0.6588 support area and then starting bullish trend which test weekly resistance at 0.71.
If i want win this trade i need good risk management and and less risk reward. my stop will be below 0.6588 LVL.
Be patient!!

AUDUSD Buy IdeaLiquidity Grab on H2 and Expansion Shows that there are Some Pending Orders and Internal Liquidity (FVG) There. Expecting a Bullish Move Resumption in Zone
if MSS happened on M15.
Look for MSS/Sweep Based CHoCH/Swing CHoCH as Confirmation.

AUDUSD long now Trade is active {31/07/2023}Trade is Active at
Long at - 0.66430
Stop loss at - 0.66210
Take profit at - 0.68800
I am linking this chart to the previous analysis for better understanding.
This chart is updated one of the last analysis i had done it.

AUDUSD - Buy - LONG!In the case of AUDUSD, the Stochastic Oscillator is giving an oversold signal for the AUD/USD currency pair. The %K and %D values you've provided (8.83% and 5.15% respectively) are both well below 20, which further emphasizes the oversold condition. Additionally, the BEARISH TREND weakens in the short term which supports a short-term uptrend. However, it is important to remember that this is a lagging indicator and might not predict future price movements perfectly. Also, an oversold market can remain oversold for a long time, just as an overbought market can stay overbought for a long time.
while the Stochastic Oscillator might suggest a potential upward price movement in AUD/USD due to the oversold condition, it's recommended to use this in combination with other technical analysis tools, market fundamentals, and risk management strategies to validate the signal and make more informed trading decisions. It's always important to consider the broader market conditions, including geopolitical events, economic data releases and other factors that might influence the forex market.
Moreover, please note that any form of trading involves a substantial risk of loss and is not suitable for everyone. Always consult with a financial advisor before making investment decisions. THIS IS NOT FINANCIAL ADVICE!!

AUDUSD Prediction H1Here is my analysis for AUDUSD on H1 using Order Block. The price could go bearish, you can put a pending order on the Order block or find an entry on LTF within OB Zone. Trade Safe!

DeGRAM | AUDUSD trend continuation opportunityAUDUSD broke and closed below the resistance and fibo levels.
The price is likely to rebound from the resistance zone since it is in the descending channel.
Most likely, the market will pullback above the psychological level at 0.66000 and then continue trending down.
The market is bearish, and we expect a bearish move.
-------------------
Share your opinion in the comments and support the idea with a like. Thanks for your support!

AUDUSD the condition is closing 4h candle under 0.6606 AUDUSD
stabilizing above 0.6606 will support rising to touch 0.6640 then 0.6694 then 0.6724
stabilizing under 0.6606 will support falling to touch 0.6542 and then 0.6501
the condition is closing 4h candle under 0.6606
Pivot Price: 0.6606
Resistance prices: 0.6640 & 0.6694 & 0.6724
Support prices: 0.6542 & 0.6501 & 0.6469
tendency: bearish
timeframe:4H

AUDUSD Trade PlanAUDUSD testing strong support area again, let's wait if support breaks or resist from the area.
Manage your risk according to account size!
AUDUSD - SELL - Inflation and Interest rate forecastThere seems to be a movement in the opposite direction from the original bearish movement. My prediction is the Buyers are making a prediction forecast in the event of lower inflation for AUSSIE and a no-interest rate hike for USD.
However, according to my pattern analysis, the price has not completed its full reversal on price yet. Therefore, there is still a potential for a downside bearish movement.
Please note that the information presented on TradingView is sourced from a third-party provider. It is important to remember that you are solely responsible for making trading decisions for your account. Trading involves a very high level of risk. Any information or content provided is strictly for research, educational, and informational purposes and should not be considered as investment advice, consultation advice, or an investment strategy. The information provided is not customized to meet the investment requirements of any specific individual, and it does not take into account the investment objectives, financial situation, or needs of any recipient who may access it. This is not financial advice and we are not responsible for your losses that may occur following our analysis!!!
If you find this analysis of AUD/USD helpful, please give me a boost, or like to show your support. My first public Idea post

AUDUSD - SHORT SETUP - SELLOnce the price is able to break through here; 0.68441, the next stop with some resistance to breakthrough is most likely 0.67899

AUDUSD - SHORT SETUP - SELL
The Stochastic Oscillator %K value is 84.92% and the %D value is 91.64%. Both values are above 80, indicating an overbought condition. This suggests that the price has reached a relatively high level and a pullback or reversal may be likely. The price is likely to retrace back to around .66300.
From the Daily time frame, it is evident that the price is nearing a significant supply area. This suggests the possibility of a downward correction. We should observe whether the market will present us with a suitable trading setup.
Please note that the information presented on TradingView is sourced from a third-party provider. It is important to remember that you are solely responsible for making trading decisions for your account. Trading involves a very high level of risk. Any information or content provided is strictly for research, educational, and informational purposes and should not be considered as investment advice, consultation advice, or an investment strategy. The information provided is not customized to meet the investment requirements of any specific individual, and it does not take into account the investment objectives, financial situation, or needs of any recipient who may access it. This is not financial advice and we are not responsible for your losses that may occur following our analysis!!!
If you find this analysis of AUD/USD helpful, please give me a boost, or like to show your support. My first public Idea post
