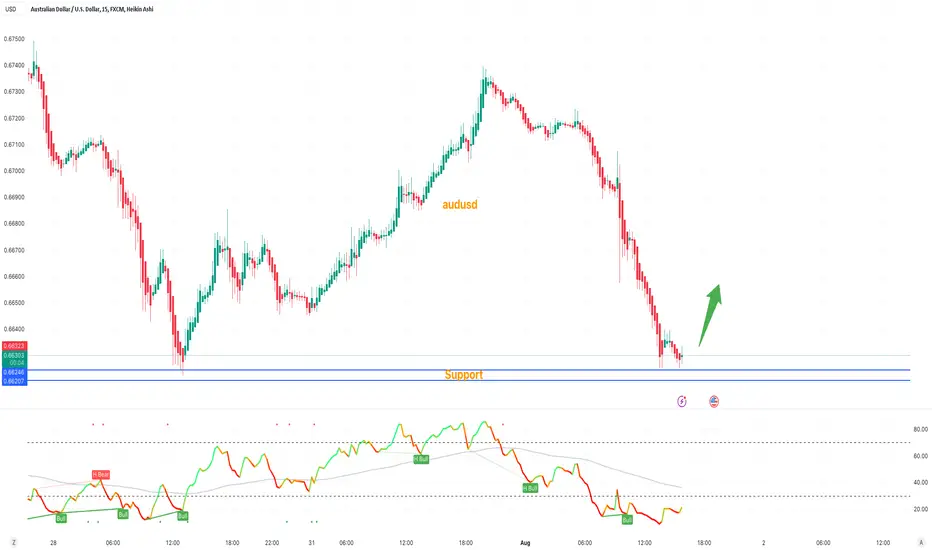
AUDUSD forecast in 1HAnd as for the analysis of the dollar price of the smallest continent on the planet...
Considering the complete clearing of the sellers at the price level of 0.6600, the last big drop that you saw was just to re-energize the price, which I expect to start an upward movement in the support of the price in the green box...
"Not financial advice"
Audusdforecast

AUDUSD - Buy - LONG!In the case of AUDUSD, the Stochastic Oscillator is giving an oversold signal for the AUD/USD currency pair. The %K and %D values you've provided (8.83% and 5.15% respectively) are both well below 20, which further emphasizes the oversold condition. Additionally, the BEARISH TREND weakens in the short term which supports a short-term uptrend. However, it is important to remember that this is a lagging indicator and might not predict future price movements perfectly. Also, an oversold market can remain oversold for a long time, just as an overbought market can stay overbought for a long time.
while the Stochastic Oscillator might suggest a potential upward price movement in AUD/USD due to the oversold condition, it's recommended to use this in combination with other technical analysis tools, market fundamentals, and risk management strategies to validate the signal and make more informed trading decisions. It's always important to consider the broader market conditions, including geopolitical events, economic data releases and other factors that might influence the forex market.
Moreover, please note that any form of trading involves a substantial risk of loss and is not suitable for everyone. Always consult with a financial advisor before making investment decisions. THIS IS NOT FINANCIAL ADVICE!!

AUDUSD Prediction H1Here is my analysis for AUDUSD on H1 using Order Block. The price could go bearish, you can put a pending order on the Order block or find an entry on LTF within OB Zone. Trade Safe!

AUDUSD the condition is closing 4h candle under 0.6606 AUDUSD
stabilizing above 0.6606 will support rising to touch 0.6640 then 0.6694 then 0.6724
stabilizing under 0.6606 will support falling to touch 0.6542 and then 0.6501
the condition is closing 4h candle under 0.6606
Pivot Price: 0.6606
Resistance prices: 0.6640 & 0.6694 & 0.6724
Support prices: 0.6542 & 0.6501 & 0.6469
tendency: bearish
timeframe:4H

AUDUSD Trade PlanAUDUSD testing strong support area again, let's wait if support breaks or resist from the area.
Manage your risk according to account size!
AUDUSD - SELL - Inflation and Interest rate forecastThere seems to be a movement in the opposite direction from the original bearish movement. My prediction is the Buyers are making a prediction forecast in the event of lower inflation for AUSSIE and a no-interest rate hike for USD.
However, according to my pattern analysis, the price has not completed its full reversal on price yet. Therefore, there is still a potential for a downside bearish movement.
Please note that the information presented on TradingView is sourced from a third-party provider. It is important to remember that you are solely responsible for making trading decisions for your account. Trading involves a very high level of risk. Any information or content provided is strictly for research, educational, and informational purposes and should not be considered as investment advice, consultation advice, or an investment strategy. The information provided is not customized to meet the investment requirements of any specific individual, and it does not take into account the investment objectives, financial situation, or needs of any recipient who may access it. This is not financial advice and we are not responsible for your losses that may occur following our analysis!!!
If you find this analysis of AUD/USD helpful, please give me a boost, or like to show your support. My first public Idea post

AUDUSD - SHORT SETUP - SELLOnce the price is able to break through here; 0.68441, the next stop with some resistance to breakthrough is most likely 0.67899

AUDUSD - SHORT SETUP - SELL
The Stochastic Oscillator %K value is 84.92% and the %D value is 91.64%. Both values are above 80, indicating an overbought condition. This suggests that the price has reached a relatively high level and a pullback or reversal may be likely. The price is likely to retrace back to around .66300.
From the Daily time frame, it is evident that the price is nearing a significant supply area. This suggests the possibility of a downward correction. We should observe whether the market will present us with a suitable trading setup.
Please note that the information presented on TradingView is sourced from a third-party provider. It is important to remember that you are solely responsible for making trading decisions for your account. Trading involves a very high level of risk. Any information or content provided is strictly for research, educational, and informational purposes and should not be considered as investment advice, consultation advice, or an investment strategy. The information provided is not customized to meet the investment requirements of any specific individual, and it does not take into account the investment objectives, financial situation, or needs of any recipient who may access it. This is not financial advice and we are not responsible for your losses that may occur following our analysis!!!
If you find this analysis of AUD/USD helpful, please give me a boost, or like to show your support. My first public Idea post

EURUSD and AUDUSD Top-down analysis Hello traders, this is a complete multiple timeframe analysis of this pair. We see could find significant trading opportunities as per analysis upon price action confirmation we may take this trade. Smash the like button if you find value in this analysis and drop a comment if you have any questions or let me know which pair to cover in my next analysis.

AUDUSD Will Fall!AUD-USD is now trading
Below the supply cluster
Of rising and horizontal
Resistance levels so I am
Bearish biased and a
Move down is to be expected !

AUDUSD Analysis 30July2023If this analysis is true that currently forming Wave C, then the possibility after Wave C is perfectly formed, there will be a fairly high bullish. I prefer to look for opportunities to Long by waiting for some reversal signs that might be formed next week.

AUDUSD BullishOn Thursday, DXY was become stronger and put AUDUSD down, but If you look on the chart, we can see huge Bearish candle which is abnormal as compared to another candle. I believe AUDUSD may rise more. Every support is an opportunity to buy.

DECKING THE CHART: AUDUSD shows sign of bullishnessHello Traders,
Trust you are doing great.
Allow me to show you my decked chart of AUDUSD.
From a technical standpoint, if the resistance is broken to the upside, we can expect the price to rise initially to 0.68034, indicating a gradual buildup of buying momentum. Should this momentum continue, the price may rally to 0.68374 and then to 0.68944.
Looking at the Elliott Wave perspective, it seems that we are in wave 4, anticipating a 5-impulse wave of a lower degree to the upside in wave 5. This assumption gains further credibility if the price surpasses the 0.6786 region. However, it's important to note that this EW perspective will no longer hold if the price violates the 0.6700 zone.
On the whole, I expect bullish move on the AUDUSD pair.

AUD Bucks Trend after Fed Hikes Rates to 22-Year High The Federal Reserve has decided to increase interest rates by 25 basis points, reaching a range of 5.25% to 5.50%, marking the highest level seen in 22 years. Market participants widely anticipated this move as the Fed resumed its tightening campaign.
In their statement, the Fed expressed a positive outlook on economic growth, acknowledging that economic activity has been expanding at a moderate pace, which is a subtle improvement from the previous characterization of "modest" growth. The focus on consumer prices remained, with the Fed emphasizing that inflation continues to be elevated, and policymakers will closely monitor the risks it poses, mirroring their assessment from the previous month.
Following the announcement of the Fed's decision, the U.S. dollar retreated across the board. This movement in the dollar contributed to a boost in gold prices and an immediate focus is now on the $1,973 minor resistance and $1,978 further above.
An exception to the general trend is the Australian dollar, which bucked the trend after data revealed that domestic inflation slowed more than expected in the second quarter. This decrease in inflation reduced pressure on the Reserve Bank of Australia to implement further policy tightening measures. The data showed that Australia's consumer price index rose by 6%, a deceleration from the 7% recorded in the first quarter and below the market's expectations of 6.2%. Consequently, the Australian dollar weakened to approximately $0.676.

AUDUSD Analysis H1Here is my analysis for AUDUSD on H1 using Order Block. The price could go bearish, you can put a pending order on the Order block or find an entry on LTF within OB Zone. Trade Safe!

AUDUSD BUY IDEASeems like price need to fill that void to make a retracement before going and continiung to the downside

AUDUSD SHORT - BIG BEARISH SWING!Waiting for a retest of 10.67884 to short AUDUSD back to 4H swing lows at 0.66195
If you agree drop a like and if you have any questions leave a comment :)

AUDUSD Gold Next Possible MovePair : AUDUSD ( Australian Dollar / U.S Dollar )
Description :
Bearish Channel in STF as an Corrective Pattern
Break of Structure
RSI - Divergence
Completed " 1234 " Impulsive Wave
Demand Zone

AUDUSD- 21/07/2023 UPDATE❤️Dear traders ,following our last setup on AUDUSD we now have a second entry which we can maximise for another 200 pips or more.

AUDUSD long term forecastAUDUSD, in the long run, is going to be one hell of a ride
Why? You may ask, while things look pretty straightforward at the moment, price doesn't always go as planned. Especially when trading on the lower time frame. However, for those who utilize the H1, H4, and even daily timeframe, this should be a good wave to ride.
First post here, will be offering more as time goes on.

32,600 Jobs Added! Aussie Dollar Skyrockets!The Australian dollar has surged, driven by an impressive employment report that far exceeded expectations. In the month of June, Australia's net employment rose by a staggering 32,600 compared to the previous month, surpassing estimates by more than double.
This development propelled the Aussie currency up by over 0.9%, reaching an intra-day high of $0.6834. The New Zealand dollar also rode the wave, gaining 0.57% to reach $0.6299. Both Antipodean currencies are now poised to reverse the losses incurred over four consecutive trading sessions.
The current market sentiment favors the bulls, with both short and long-term momentum in their favor. Price action is trading above the 50 and 200-day moving averages, reinforcing the positive outlook for the Australian dollar.
Elsewhere in the currency market, the sterling is doing its best to counter deep losses following a sharp fall in the previous session. The decline was prompted by Britain's inflation data, which fell short of market expectations.
The British pound managed a modest recovery, trading 0.15% higher at $1.2958 in the latest session.

AUDUSD Top-down analysisHello traders, this is a complete multiple timeframe analysis of this pair. We see could find significant trading opportunities as per analysis upon price action confirmation we may take this trade. Smash the like button if you find value in this analysis and drop a comment if you have any questions or let me know which pair to cover in my next analysis.

AUDUSD BUYHi, according to my analysis of the AUDUSD pair. There is a possibility of an uptrend with a retest of the price. Double button model. There is strong support in this area 0.65000. And this is just a corrective wave. to return to height. Good luck everyone .Note: If you like this analysis, please give your opinion on it. in the comments. I will be happy to share ideas. Like and click to get free content. Thank you
