Ready for the Aussie Heist? Is This the Perfect Entry?🚨💰 - "The Aussie Vault Raid: Bullish Robbery in Progress!" 💰🚨
AUD/USD Forex Trade Idea (Thief Style Swing/Day Plan)
📈🔥 Designed for Thief Traders, Market Robbers & Money Makers Worldwide 🤑🐱👤💸
🌍 Hello Global Robbers!
🌟 Hola! Ola! Bonjour! Hallo! Salaam! Konnichiwa! 🌟
Welcome to another bold heist plan from the Thief Trading Crew. This one’s a high-stakes raid on the AUD/USD — "The Aussie" — using our signature Thief Trading Style, combining raw technical setups with real macro/fundamental edge. We're eyeing the Bullish Vault Breakout, so tighten up your gloves — it’s time to rob smart, not hard.
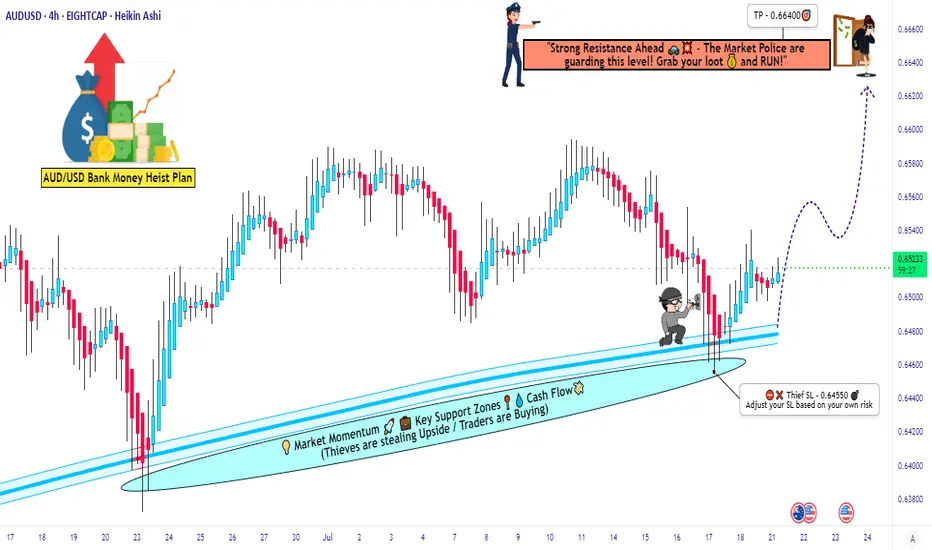
🔓💸 ENTRY PLAN – “The Vault is Unlocked!”
Grab the bullish loot at any valid price zone — but here’s how real thieves move:
📍 Recommended Entry Style:
Use Buy Limit Orders near local swing lows, demand zones, or key pullback entries on the 15m to 30m chart.
Execute DCA (Dollar Cost Averaging) / Layered Orders for more precision.
Align with your MA lines & candle structures for max confirmation.
🛑 STOP LOSS – “Escape Route Secured”
📍 SL hidden beneath recent swing lows below MA (on 4H):
🎯 Suggested Level: 0.64550
💡 Custom-fit your SL based on:
Trade size
Number of active positions
Account risk strategy
🎯 PROFIT TARGET – “Cash Out Before the Cops Show!”
🏴☠️ Take-Profit Zone: 0.66400
This is our bullish breakout reward zone — a high-value zone where profit meets safety.
🔍 MARKET OUTLOOK – "Cops Are Watching, but We're Ahead..."
📈 The AUD/USD market is flashing bullish momentum, supported by:
✅ Risk sentiment flow
✅ US Dollar weakness and rate expectations
✅ Intermarket signals from commodities (Gold/Iron)
✅ Positive macro positioning from smart money (via COT)
✅ Technical demand forming reversal patterns from oversold zones
📎 For a deeper breakdown —
📰 Fundamentals | COT Reports | Sentiment | Intermarket Analysis — Check Klick 🔗
⚠️ THIEF ALERT – “Avoid Sirens. Watch the News.”
Stay out of trouble by following these protocols during major news events:
🚫 Don’t enter trades blindly before/after big news
📍 Use trailing stops to protect gains
🔄 Adjust SL/TP if price nears breakout points during volatility
💥 SUPPORT THE CREW – “Smash That Boost Button!”
Love the plan? Then Boost this chart to show love for the Thief Trading Movement.
Every like, comment, and boost adds power to our robbery network across the globe. 🌍❤️💰
⚖️ DISCLAIMER – “Not Financial Advice, Just Thief Vibes”
📌 This analysis is for educational and entertainment purposes only.
📌 Trade at your own risk and always do your own analysis.
📌 Market moves fast — stay sharp, stay stealthy.
**🎭 See you at the next heist.
Until then, trade rich. Rob wise.
Thief Trader out. 🐱👤💰📉📈**
Audusdlong
"AUD/USD Breakout | Bullish Robbery to Overbought Resistance"🚨💰🦘 AUD/USD "The Aussie" Forex Bank Heist 💰🚨
Oi mates & fellow market robbers! 🏴☠️💵
This is your Thief Trader breaking into the Aussie vault — and this time, the loot is in pips, not gold bars. 😎
💥 MISSION PLAN: Bullish raid with layered limit orders — stacking like a pro safecracker. No hesitation, no mercy. Entry? Any price the vault door swings open. 📈🔓
📍 ENTRY:
🎯 Slip in at ANY level, but a true thief knows how to wait for the pullback sweet spots. Layer the buys like bricks in a getaway tunnel.
🛑 STOP LOSS:
🚔 Park it at 0.64900 — our last escape hatch before the police sirens get too close.
🎯 TARGET:
💣 0.66200 — POLICE BARRICADE RESISTANCE ZONE 🚧🔥 Overbought territory where the getaway chopper is waiting.
📊 Why the Aussie vault is ripe for robbery:
Bullish momentum is loading up like a cash van before payday. 💵
Big players pushing price higher — we just tailgate the convoy. 🚚💨
Layering entries means more bags filled if the price dips before liftoff. 🛍️
⚠ Robbery Rules:
Avoid news time unless you love chaos. 📢
Keep SL tight and respect the plan — greedy thieves get caught.
Trailing stop = locking loot while the ride continues.
💖 Boost this heist plan if you’re rolling with the crew! 🚀💰 The more likes, the louder the sirens, the bigger the thrill.
🏆 Stay sharp, stay sneaky, and let’s rob the Aussie bank together! 🐱👤💸

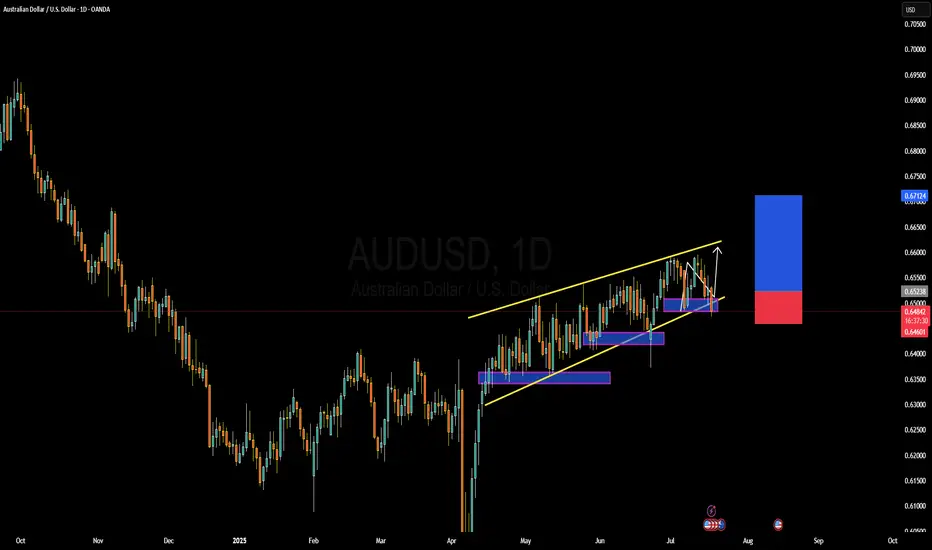
AUDUSD Breakout Setup: Ready for Lift-Off!Hey Guys,
I’ve analyzed the AUDUSD pair for you. If the 0.65245 level breaks to the upside, my target will be 0.65416.
If it doesn’t break, I’ll be looking to buy around 0.65047 or 0.64954.
Either way, my final target remains 0.65416.
In this analysis, I’ve highlighted two key levels and shared my target. I’m planning to buy from these zones.
Every single like from you is my biggest source of motivation to keep sharing these analyses. Huge thanks to everyone who supports by liking!

AUDUSD Bullish Bias!
HI,Traders !
#AUDUSD is trading in a
Local uptrend and the
Pair made a retest of the
Horizontal support of 0.64796
And we are already seeing
A bullish rebound so we
Will be expecting a further
Bullish move up !
Comment and subscribe to help us grow !

AUDUSD – Plan Ready for Both ScenariosWe're patiently waiting for price to reach our key zone. If we get a valid sell signal, we’ll take the short.
But if the market breaks above this level with strength and gives us a clean pullback, we’re ready to go long.
No guessing. No hoping. Just reacting to what the market shows us.
📌 Discipline over prediction.

AUD/USD Pullback or Trap? Key Level in FocusPrice has slipped below the rising channel and is now pulling back to retest the breakdown area. This retest could decide the next move.
If buyers fail to step in here, and price gets rejected again, it may signal the start of a deeper correction. However, reclaiming the channel could flip the bias back to bullish.

AUDUSD(20250807)Today's AnalysisMarket News:
Federal Reserve Chairman Neel Kashkari: A rate cut may be appropriate in the short term, and two rate cuts this year are reasonable. Trump: The new Fed governor will likely be temporary, and the appointment will be announced within 2-3 days.
Technical Analysis:
Today's Buy/Sell Levels:
0.6489
Support and Resistance Levels:
0.6538
0.6520
0.6508
0.6470
0.6458
0.6440
Trading Strategy:
If the price breaks above 0.6508, consider a buy entry, with the first target at 0.6520. If the price breaks below 0.6489, consider a sell entry, with the first target at 0.6470

Ready for the Aussie Heist? Is This the Perfect Entry?🚨💰 - "The Aussie Vault Raid: Bullish Robbery in Progress!" 💰🚨
AUD/USD Forex Trade Idea (Thief Style Swing/Day Plan)
📈🔥 Designed for Thief Traders, Market Robbers & Money Makers Worldwide 🤑🐱👤💸
🌍 Hello Global Robbers!
🌟 Hola! Ola! Bonjour! Hallo! Salaam! Konnichiwa! 🌟
Welcome to another bold heist plan from the Thief Trading Crew. This one’s a high-stakes raid on the AUD/USD — "The Aussie" — using our signature Thief Trading Style, combining raw technical setups with real macro/fundamental edge. We're eyeing the Bullish Vault Breakout, so tighten up your gloves — it’s time to rob smart, not hard.
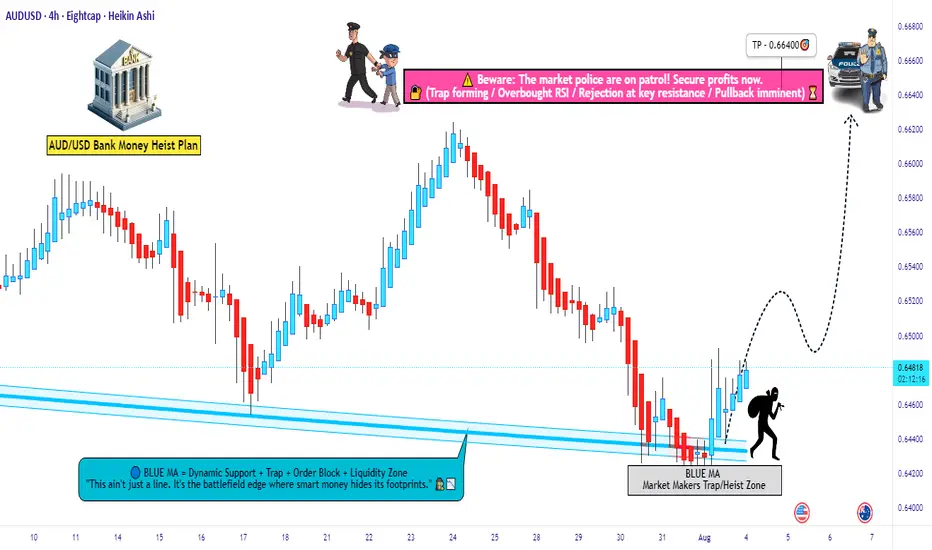
🔓💸 ENTRY PLAN – “The Vault is Unlocked!”
Grab the bullish loot at any valid price zone — but here’s how real thieves move:
📍 Recommended Entry Style:
Use Buy Limit Orders near local swing lows, demand zones, or key pullback entries on the 15m to 30m chart.
Execute DCA (Dollar Cost Averaging) / Layered Orders for more precision.
Align with your MA lines & candle structures for max confirmation.
🛑 STOP LOSS – “Escape Route Secured”
📍 SL hidden beneath recent swing lows below MA (on 4H):
🎯 Suggested Level: 0.64170
💡 Custom-fit your SL based on:
Trade size
Number of active positions
Account risk strategy
🎯 PROFIT TARGET – “Cash Out Before the Cops Show!”
🏴☠️ Take-Profit Zone: 0.66400
This is our bullish breakout reward zone — a high-value zone where profit meets safety.
🔍 MARKET OUTLOOK – "Cops Are Watching, but We're Ahead..."
📈 The AUD/USD market is flashing bullish momentum, supported by:
✅ Risk sentiment flow
✅ US Dollar weakness and rate expectations
✅ Intermarket signals from commodities (Gold/Iron)
✅ Positive macro positioning from smart money (via COT)
✅ Technical demand forming reversal patterns from oversold zones
📎 For a deeper breakdown —
📰 Fundamentals | COT Reports | Sentiment | Intermarket Analysis — Check Klick 🔗
⚠️ THIEF ALERT – “Avoid Sirens. Watch the News.”
Stay out of trouble by following these protocols during major news events:
🚫 Don’t enter trades blindly before/after big news
📍 Use trailing stops to protect gains
🔄 Adjust SL/TP if price nears breakout points during volatility
💥 SUPPORT THE CREW – “Smash That Boost Button!”
Love the plan? Then Boost this chart to show love for the Thief Trading Movement.
Every like, comment, and boost adds power to our robbery network across the globe. 🌍❤️💰
⚖️ DISCLAIMER – “Not Financial Advice, Just Thief Vibes”
📌 This analysis is for educational and entertainment purposes only.
📌 Trade at your own risk and always do your own analysis.
📌 Market moves fast — stay sharp, stay stealthy.
**🎭 See you at the next heist.
Until then, trade rich. Rob wise.
Thief Trader out. 🐱👤💰📉📈**
AUDUSD – DAILY FORECAST Q3 | W31 | D29 | Y25📊 AUDUSD – DAILY FORECAST
Q3 | W31 | D29 | Y25
Daily Forecast 🔍📅
Here’s a short diagnosis of the current chart setup 🧠📈
Higher time frame order blocks have been identified — these are our patient points of interest 🎯🧭.
It’s crucial to wait for a confirmed break of structure 🧱✅ before forming a directional bias.
This keeps us disciplined and aligned with what price action is truly telling us.
📈 Risk Management Protocols
🔑 Core principles:
Max 1% risk per trade
Only execute at pre-identified levels
Use alerts, not emotion
Stick to your RR plan — minimum 1:2
🧠 You’re not paid for how many trades you take, you’re paid for how well you manage risk.
🧠 Weekly FRGNT Insight
"Trade what the market gives, not what your ego wants."
Stay mechanical. Stay focused. Let the probabilities work.
FX:AUDUSD

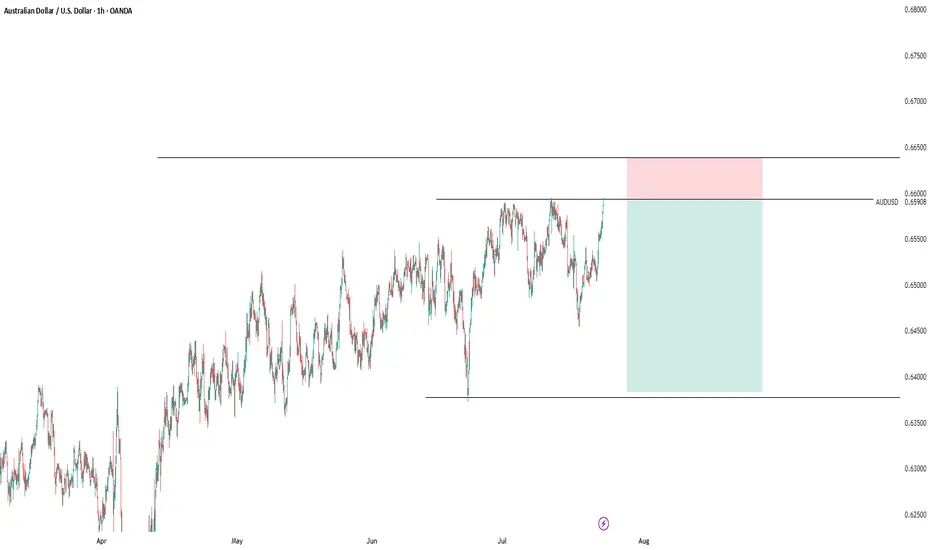
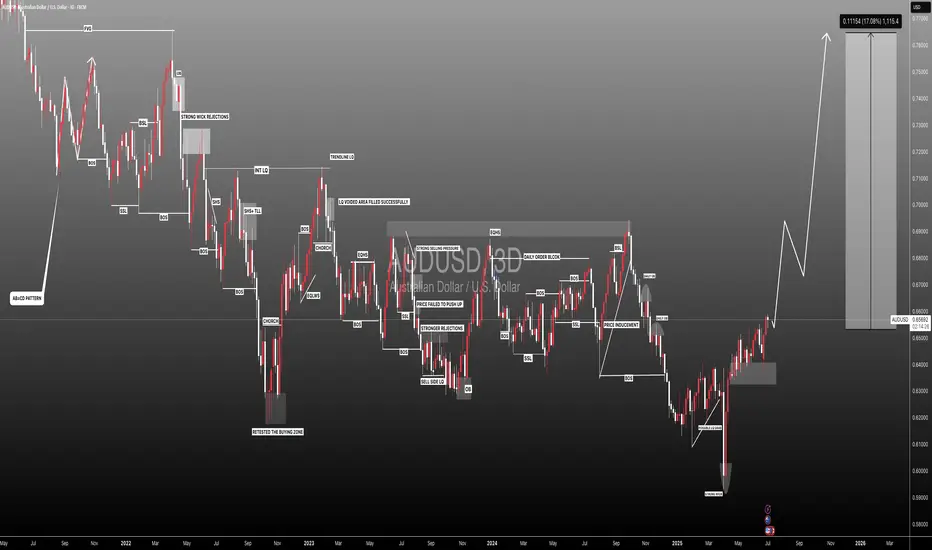
This Chart Screams Breakout – Are You In?AUD/USD – Bullish Setup Brewing
AUD/USD has been respecting this rising channel beautifully, with clean higher highs and higher lows.
Back in April, we saw a classic bear trap, price wicked below support, lured in shorts, and then reversed sharply. That fakeout sparked a strong rally and confirmed demand.
Currently, price is consolidating near the Key Resistance Zone and bouncing off the lower trendline again a sign of strength.
If this pattern continues, we could soon see a breakout above the upper trendline, potentially sending AUD/USD flying toward 0.68+.
Outlook:
As long as the structure holds, dips are for buying. Bulls remain in control.
DYOR, NFA
Thanks for the reading

AUDUSD Bullish Breakout!
HI,Traders !
#AUDUSD is trading in a strong
Uptrend and the price made a
Bullish breakout of the key
Horizontal level of 0.65829
So we are bullish biased
And we will be expecting a
Further bullish move up !
Comment and subscribe to help us grow !

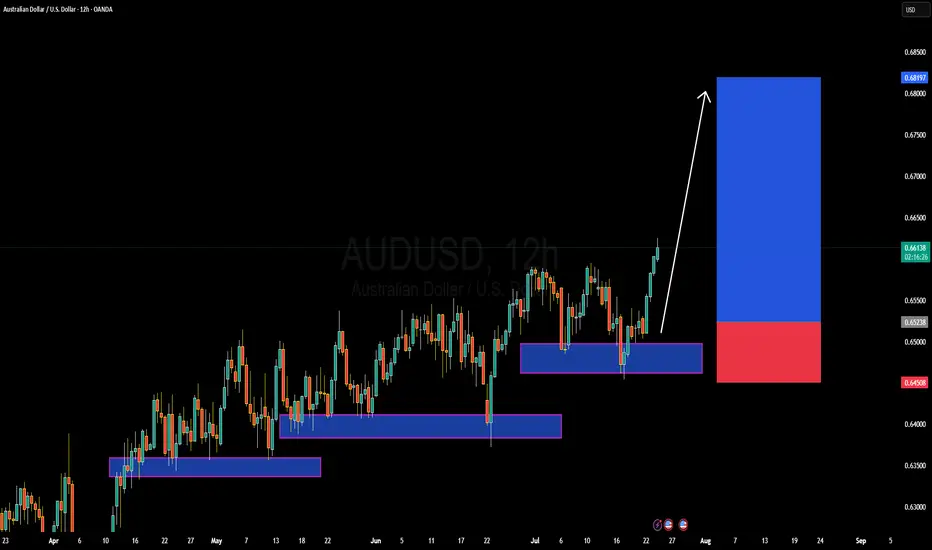
AUDUSD Forming Strong Bullish MomentumAUDUSD is currently showing strong bullish momentum, confirming a key breakout from recent consolidation. After multiple rejections at support zones, price action has now surged through previous resistance levels around 0.6600, signaling a bullish trend continuation. As seen on the 12H chart, the pair is respecting a series of higher lows and forming a clean ascending structure, with a fresh impulse wave now aiming toward the 0.6800–0.6820 target zone.
On the fundamental front, the Australian dollar is gaining strength as recent macro data supports a more optimistic economic outlook. Australia’s labor market remains tight, and inflation prints have come in hotter than expected, increasing speculation that the RBA may maintain a hawkish tone. Meanwhile, the US dollar is under pressure as markets continue to price in a potential Fed rate cut in the coming months, especially amid signs of slowing economic momentum and easing CPI. This divergence is helping AUDUSD push higher.
Technically, buyers are clearly in control. Each dip into demand zones has been aggressively bought, and the current price action confirms continuation. The recent break above 0.6600 is a significant technical development, and as long as price holds above the 0.6520–0.6500 support zone, I expect the pair to grind higher toward 0.6819 and beyond. Risk-reward remains favorable for buyers with a clear bullish structure intact.
With strong bullish confluence both fundamentally and technically, AUDUSD offers a high-probability long opportunity. I’ll be looking for continuation setups on lower timeframes while managing risk below key support. The trend is your friend here—stay with the bulls as the market positions ahead of upcoming US economic releases.
audusd sell signal. Don't forget about stop-loss.
Write in the comments all your questions and instruments analysis of which you want to see.
Friends, push the like button, write a comment, and share with your mates - that would be the best THANK YOU.
P.S. I personally will open entry if the price will show it according to my strategy.
Always make your analysis before a trade
AUDUSD(20250721)Today's AnalysisMarket news:
Waller refused to comment on whether he would dissent at the July meeting, saying that the private sector was not performing as well as people thought, and said that if the president asked him to be the chairman of the Federal Reserve, he would agree.
Technical analysis:
Today's buying and selling boundaries:
0.6506
Support and resistance levels:
0.6572
0.6547
0.6531
0.6481
0.6466
0.6441
Trading strategy:
If the price breaks through 0.6531, consider buying, and the first target price is 0.6547
If the price breaks through 0.6506, consider selling, and the first target price is 0.6481

AUDUSD Forming Bullish MomentumAUDUSD is showing strong bullish momentum, and the current price structure confirms that the pair is gearing up for another potential rally. After building solid bullish pressure from key support zones, price has been making higher lows with clear buying interest stepping in on dips. I entered this setup earlier and am already in deep profit. With the momentum continuing to hold, I’m anticipating another wave to the upside in the coming sessions.
From a fundamental standpoint, the Australian dollar is currently benefiting from broad US dollar softness driven by expectations of a Fed rate cut later this year. As inflation cools in the US and the labor market shows signs of moderation, the Fed’s hawkish stance has softened, weakening the dollar across the board. At the same time, the Reserve Bank of Australia (RBA) has maintained a relatively firm tone, leaving the door open for further tightening if inflation pressures persist domestically. This divergence in central bank tone is favoring AUD strength.
Additionally, commodities like iron ore and copper—major Australian exports—have recently found renewed demand, particularly from China. With Chinese authorities signaling more fiscal and monetary stimulus to support their post-COVID recovery, the Australian economy stands to benefit, further supporting AUD upside. This commodity-backed strength adds another layer of support to the bullish AUDUSD narrative.
Technically, the pair has broken above a key resistance level and is now forming a bullish continuation pattern on the lower timeframes. Price action is supported by rising volume and moving averages starting to slope upward. The structure is clean, the fundamentals are supportive, and sentiment across TradingView shows increasing bullish interest in AUDUSD. I'm holding for higher levels as the bullish wave continues to develop.
AUDUSD SHORT & LONG FORECAST Q3 D15 W29 Y25AUDUSD SHORT & LONG FORECAST Q3 D15 W29 Y25
Professional Risk Managers👋
Welcome back to another FRGNT chart update📈
Diving into some Forex setups using predominantly higher time frame order blocks alongside confirmation breaks of structure.
Let’s see what price action is telling us today! 👀
💡Here are some trade confluences📝
✅Daily Order block identified
✅4H Order Block identified
✅1H Order Block identified
🔑 Remember, to participate in trading comes always with a degree of risk, therefore as professional risk managers it remains vital that we stick to our risk management plan as well as our trading strategies.
📈The rest, we leave to the balance of probabilities.
💡Fail to plan. Plan to fail.
🏆It has always been that simple.
❤️Good luck with your trading journey, I shall see you at the very top.
🎯Trade consistent, FRGNT X

AUDUSD(20250715)Today's AnalysisMarket news:
Sources said that after Trump's latest trade tax threat, the European Central Bank will discuss a more negative scenario next week than expected in June. The ECB is still expected to keep interest rates unchanged at its meeting on July 24. Discussions on rate cuts are still postponed to September.
Technical analysis:
Today's buying and selling boundaries:
0.6557
Support and resistance levels:
0.6602
0.6585
0.6574
0.6539
0.6528
0.6511
Trading strategy:
If it breaks through 0.6557, consider buying in, the first target price is 0.6574
If it breaks through 0.6539, consider selling in, the first target price is 0.6528

#AUDUSD: +1100 Pips Possible Swing Bullish Move! AUDUSD a strong sign of bullish behaviour has appeared alongside bullish momentum. As we have NFP tomorrow, we expect market to remain volatile; what we think now is to have market settled down before we can have any confirmation. We recommend to remain extra cautious tomorrow, once market get settled we can then enter with accurate risk management.
Like, comment and Share for more!
Team Setupsfx_
AUSSIE BANK ROBBERY: AUD/USD Bullish Breakout Confirmed!🔥 AUD/USD BANK HEIST: The Ultimate Bullish Robbery Plan (Thief Trading Style) 🔥
🌟 ATTENTION, MONEY MAKERS & MARKET ROBBERS! 🌟
💸 MISSION BRIEF:
Based on Thief Trading Style (technical + fundamental analysis), we’re executing a bullish heist on AUD/USD ("The Aussie")—time to steal those pips like a pro!
📈 ENTRY STRATEGY (The Heist Begins!)
Long Entry Trigger: Wait for Dynamic Resistance MA crossover + candle close above 0.65300 (bullish confirmation).
Pro Tip: Use Buy Stop orders above MA or Buy Limit orders on pullbacks (15m/30m timeframe).
🔔 SET AN ALERT! Don’t miss the breakout—alert up, gloves on!
🛑 STOP LOSS (Protect Your Loot!)
"Yo, rookie! 🗣️ If you’re entering on breakout, DO NOT set SL before confirmation!
📍 Thief SL Placement: Nearest 4H swing low (0.64800)—adjust based on your risk, lot size, & trade multiples.
⚠️ Warning: Deviate at your own peril—your risk, your rules!
🎯 TARGET (Cash Out & Run!)
Take Profit Zone: 0.65800
Scalpers: Long-only plays! Use trailing SL to lock profits.
Swing Traders: Ride the wave—big money moves require patience!
📰 FUNDAMENTAL BACKUP (Know Why We Robbin’!)
Bullish momentum fueled by macro trends, COT data, sentiment shifts.
🚨 Breaking News Alert: Avoid high-impact news spikes—trail SL or stay out!
💥 BOOST THE HEIST!
Hit 👍 LIKE, 🔄 SHARE & 🚀 BOOST—strengthen the robbery squad! More heists = more profits!
🤑 NEXT HEIST COMING SOON… STAY TUNED! 🐱👤

AUDUSD SHORT & LONG DAILY FORECAST Q3 D7 W28 Y25AUDUSD SHORT & LONG DAILY FORECAST Q3 D7 W28 Y25
Professional Risk Managers👋
Welcome back to another FRGNT chart update📈
Diving into some Forex setups using predominantly higher time frame order blocks alongside confirmation breaks of structure.
Let’s see what price action is telling us today! 👀
💡Here are some trade confluences📝
✅Daily Order block identified
✅4H Order Block identified
✅1H Order Block identified
🔑 Remember, to participate in trading comes always with a degree of risk, therefore as professional risk managers it remains vital that we stick to our risk management plan as well as our trading strategies.
📈The rest, we leave to the balance of probabilities.
💡Fail to plan. Plan to fail.
🏆It has always been that simple.
❤️Good luck with your trading journey, I shall see you at the very top.
🎯Trade consistent, FRGNT X

#AUDUSD:We are yet to see weaken USD! AUDUSD to make yearly highAUDUSD hasn’t seen strong bullish volume yet, but tomorrow’s NFP will be crucial for determining the future trend of the AUDUSD. Based on your analysis, you can set multiple targets.
If you like our work and want to support us, you can do so by following us:
-Liking our ideas
-Commenting on our ideas
-Sharing
Team Setupsfx_
❤️🚀

EURAUD -0.7% Short and AUDUSD MistakeA short position taken on EURAUD for a small loss after manually closing before swaps. I have also included a breakdown of a +4% AUDUSD long I was looking at taking but a small error on my behalf that caused me to stay out of the trade. Full explanation as to why I executed on this position and made the decision to manually close at the level I did.
Any questions you have just drop them below 👇

The Aussie Dollar Heist Blueprint: "AUD/USD" Long Setup!?🌍 Hello, Global Wealth Warriors! Ciao, Salut, Guten Tag, Ola! 🌟
Fellow Profit Pirates & Market Mavericks, 💸⚡
Unveiling our cunning blueprint to plunder the AUD/USD (The Aussie) forex market, crafted with 🔥Thief Trading’s razor-sharp technical and fundamental insights🔥. Stick to the chart’s game plan, zoned in on a long entry. Our mission? Slip out near the high-stakes RED Zone Level—a perilous spot with overbought vibes, consolidation, trend flips, and traps where bearish bandits lurk. 🏴☠️💰 Celebrate your wins, traders—you’ve earned it! 🎉
Entry 📈 : "The heist is on! Wait for the MA line breakout (0.65200) then make your move - Bullish profits await!"
however I advise to Place Buy stop orders above the ATR line (or) Place buy limit orders within a 15 or 30 minute timeframe most recent or swing, low or high level for Pullback entries.
📌I strongly advise you to set an "alert (Alarm)" on your chart so you can see when the breakout entry occurs.
🛑 **Stop Loss**:
📍 Thief SL parked at the recent/swing low on the 4H timeframe (0.64600) for day/swing trades.
📍 Tailor your SL to your risk appetite, lot size, and number of orders. Stay sharp!
🎯 **Target**: Aim for 0.66300 or make a swift exit just before.
👀 **Scalpers, Listen Up**: Stick to long-side scalping. Got deep pockets? Dive in now! Otherwise, join swing traders for the grand heist. Use trailing SL to shield your loot. 💰
💹 **Market Pulse**: The AUD/USD (The Aussie) forex market is in a ATR Dynamic Resistance zone but leaning bullish, fueled by key drivers. ☝
🌐 Dive into Fundamentals, Macro Insights, COT Reports, Quantitative Analysis, Sentiment Outlook, Intermarket Trends, Future Targets & Overall score.. Check the linkss for the full scoop! 🔗🌍
⚠️ **Trading Alert**: News can shake the market! 📰
🔐 Protect your positions:
- Pause new trades during news releases.
- Use trailing stop-loss to lock in gains.
💪 **Join the Heist**: Smash the Boost Button to supercharge our robbery squad! 💥 With Thief Trading Style, we rake in profits daily with ease. 🚀 Your support fuels our market conquests. 🤝❤️
Stay tuned for the next daring heist, money makers! 🤑🐱👤🎯
