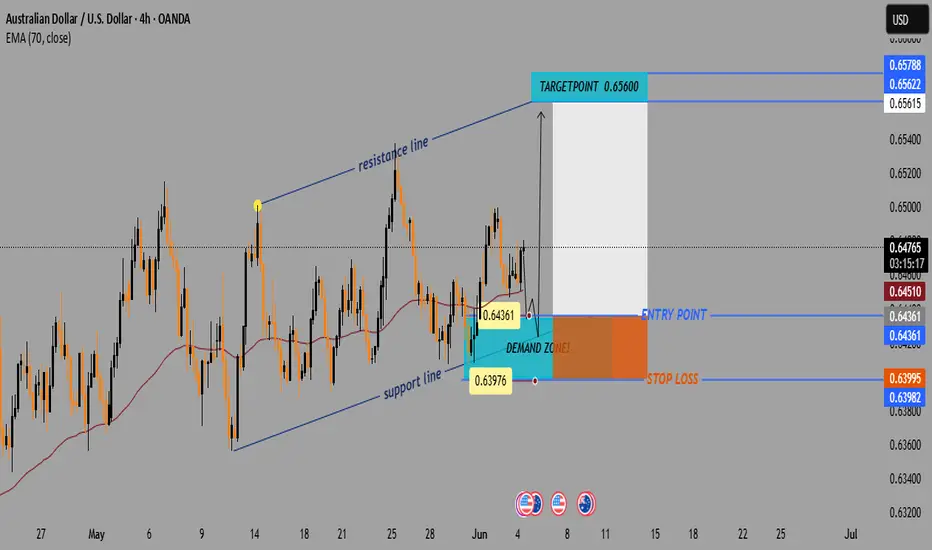
AUD/USD Bullish Setup: Demand Zone Bounce Toward 0.65600📈 Price Channel Analysis
🔼 The pair is moving within an ascending channel: • Support Line 🟦 – lower trendline showing bullish structure
* Resistance Line 🟥 – upper boundary acting as potential target
💡 This suggests bullish momentum is intact unless the price breaks below support.
📌 Key Trade Levels
🔵 Entry Point: 0.64361
* 👇 Positioned just above the DEMAND ZONE
* 📍Near the 70 EMA — a key dynamic support
🟨 Demand Zone: Area between 0.6400 – 0.6436
* 🧲 Buyers are expected here
* Good spot for a bullish entry
🔴 Stop Loss: 0.63995
* 🚨 Below the demand zone = limited risk
🟢 Target Point: 0.65600
* 🎯 Aligned with the upper resistance line
* Nice upside potential
⚙️ Technical Indicator
📉 EMA 70 (red line) = 0.64510
* Price is bouncing near it
* 📊 Acts as trend support — confirming buy idea
📊 Risk-to-Reward Ratio
🔻 Risk: ~36 pips (Entry → Stop Loss)
🔺 Reward: ~124 pips (Entry → Target)
✅ R:R Ratio ≈ 3.4:1 👍
🧠 Trade Idea Summary
📘 Trade Type 🔼 Buy (Long)
💰 Entry 0.64361
🛑 Stop Loss 0.63995
🎯 Target 0.65600
🌟 Bias Bullish
🔍 Final Thoughts
✅ Strong setup within a bullish channel
📉 EMA support + 🟦 Demand zone = Good confluence
📅 Watch out for USD news (see icons below chart)
Audusdprediction
AUD/USD "The Aussie" Forex Bank Money Heist (Bullish)🌟Hi! Hola! Ola! Bonjour! Hallo! Marhaba!🌟
Dear Money Makers & Robbers, 🤑 💰💸✈️
Based on 🔥Thief Trading style technical and fundamental analysis🔥, here is our master plan to heist the AUD/USD "The Aussie" Forex Bank Heist. Please adhere to the strategy I've outlined in the chart, which emphasizes long entry. Our aim is to escape near the high-risk Red Zone. It's a Risky level, overbought market, consolidation, trend reversal, trap at the level where traders and bearish robbers are stronger. 🏆💸"Take profit and treat yourself, traders. You deserve it!💪🏆🎉
Entry 📈 : "The heist is on! Wait for the MA Pullback at Institutional Buy zone (0.63700) & (0.62800) then make your move - Bullish profits await!"
Stop Loss 🛑: "🔊 Yo, listen up! 🗣️ If you're lookin' to get in on a buy stop order, don't even think about settin' that stop loss till after the breakout 🚀. You feel me? Now, if you're smart, you'll place that stop loss where I told you to 📍, but if you're a rebel, you can put it wherever you like 🤪 - just don't say I didn't warn you ⚠️. You're playin' with fire 🔥, and it's your risk, not mine 👊."
📍 Thief SL placed at the nearest/swing low level Using the 2H timeframe "Big Money buy" SL at (0.64000) & "Institutional Buy" SL at (0.62000) Swing trade basis.
📍 SL is based on your risk of the trade, lot size and how many multiple orders you have to take.
🏴☠️Target 🎯: 0.67000
🧲Scalpers, take note 👀 : only scalp on the Long side. If you have a lot of money, you can go straight away; if not, you can join swing traders and carry out the robbery plan. Use trailing SL to safeguard your money 💰.
💰💵💸AUD/USD "The Aussie" Forex Bank Money Heist is currently experiencing a bullishness,., driven by several key factors. .☝☝☝
⚠️Trading Alert : News Releases and Position Management 📰🗞️🚫🚏
As a reminder, news releases can have a significant impact on market prices and volatility. To minimize potential losses and protect your running positions,
we recommend the following:
Avoid taking new trades during news releases
Use trailing stop-loss orders to protect your running positions and lock in profits.
💖Supporting our robbery plan 💥Hit the Boost Button💥 will enable us to effortlessly make and steal money 💰💵. Boost the strength of our robbery team. Every day in this market make money with ease by using the Thief Trading Style.🏆💪🤝❤️🎉🚀
I'll see you soon with another heist plan, so stay tuned 🤑🐱👤🤗🤩

AUDUSD SELL/ SHORTBy utilizing levels, historical patterns, , we can formulate a hypothesis that the market might follow a similar trajectory if bullish sentiment prevails.

Result: #AUDUSD(April 7)One of the best selling positions today, where a 170-pip price movement occurred at the zero point of price reversal! :))

AUD/USD "The Aussie Dollar" Forex Market Heist Plan🌟Hi! Hola! Ola! Bonjour! Hallo! Marhaba!🌟
Dear Money Makers & Robbers, 🤑 💰💸✈️
Based on 🔥Thief Trading style technical and fundamental analysis🔥, here is our master plan to heist the AUD/USD "The Aussie Dollar" Forex market. Please adhere to the strategy I've outlined in the chart, which emphasizes long entry. Our aim is the high-risk Red Zone. Risky level, overbought market, consolidation, trend reversal, trap at the level where traders and bearish robbers are stronger. 🏆💸Book Profits Be wealthy and safe trade.💪🏆🎉
Entry 📈 : "The heist is on! Wait for the MA breakout (0.64000) then make your move - Bullish profits await!"
however I advise to Place Buy stop orders above the Moving average (or) Place buy limit orders within a 15 or 30 minute timeframe most recent or swing, low or high level.
📌I strongly advise you to set an alert on your chart so you can see when the breakout entry occurs.
Stop Loss 🛑:
Thief SL placed at the recent / nearest low level Using the 4H timeframe (0.62800) swing trade basis.
SL is based on your risk of the trade, lot size and how many multiple orders you have to take.
🏴☠️Target 🎯: 0.65500 (or) Escape Before the Target
🧲Scalpers, take note 👀 : only scalp on the Long side. If you have a lot of money, you can go straight away; if not, you can join swing traders and carry out the robbery plan. Use trailing SL to safeguard your money 💰.
AUD/USD "The Aussie Dollar" Forex Market Heist Plan (Day Trade) is currently experiencing a bullishness,., driven by several key factors.
📰🗞️Get & Read the Fundamental analysis, Macro Economics, COT Report, Quantitative Analysis, Intermarket Analysis, Sentimental Outlook, Positioning and future trend...
Before start the heist plan read it.👉👉👉
📌Keep in mind that these factors can change rapidly, and it's essential to stay up-to-date with market developments and adjust your analysis accordingly.
⚠️Trading Alert : News Releases and Position Management 📰 🗞️ 🚫🚏
As a reminder, news releases can have a significant impact on market prices and volatility. To minimize potential losses and protect your running positions,
we recommend the following:
Avoid taking new trades during news releases
Use trailing stop-loss orders to protect your running positions and lock in profits
💖Supporting our robbery plan 💥Hit the Boost Button💥 will enable us to effortlessly make and steal money 💰💵. Boost the strength of our robbery team. Every day in this market make money with ease by using the Thief Trading Style.🏆💪🤝❤️🎉🚀
I'll see you soon with another heist plan, so stay tuned 🤑🐱👤🤗🤩

AUD/USD "The Aussie" Forex Bank Bearish Heist Plan (Swing/Day)🌟Hi! Hola! Ola! Bonjour! Hallo! Marhaba!🌟
Dear Money Makers & Robbers, 🤑💰✈️
Based on 🔥Thief Trading style technical and fundamental analysis🔥, here is our master plan to heist the AUD/USD "The Aussie" Forex Bank. Please adhere to the strategy I've outlined in the chart, which emphasizes short entry. Our aim is the high-risk Green Zone. Risky level, oversold market, consolidation, trend reversal, trap at the level where traders and bullish robbers are stronger. 🏆💸Book Profits Be wealthy and safe trade.💪🏆🎉
Entry 📈 : "The heist is on! Wait for the MA breakout then make your move at (0.62200) - Bearish profits await!"
however I advise to Place sell stop orders above the Moving average (or) after the MA level Breakout Place sell limit orders within a 15 or 30 minute timeframe most NEAREST (or) SWING low or high level.
📌I strongly advise you to set an "alert (Alarm)" on your chart so you can see when the breakout entry occurs.
Stop Loss 🛑: "🔊 Yo, listen up! 🗣️ If you're lookin' to get in on a sell stop order, don't even think about settin' that stop loss till after the breakout 🚀. You feel me? Now, if you're smart, you'll place that stop loss where I told you to 📍, but if you're a rebel, you can put it wherever you like 🤪 - just don't say I didn't warn you ⚠️. You're playin' with fire 🔥, and it's your risk, not mine 👊."
📌Thief SL placed at the nearest/swing High or Low level Using the 4H timeframe (1.42800) Day/Swing trade basis.
📌SL is based on your risk of the trade, lot size and how many multiple orders you have to take.
Target 🎯: 0.62900 (or) Escape Before the Target
🧲Scalpers, take note 👀 : only scalp on the Short side. If you have a lot of money, you can go straight away; if not, you can join swing traders and carry out the robbery plan. Use trailing SL to safeguard your money 💰.
💸💵AUD/USD "The Aussie" Forex Bank Heist Plan (Swing/Day Trade) is currently experiencing a bearishness,., driven by several key factors.👇
📰🗞️Get & Read the Fundamental, Macro, COT Report, Quantitative Analysis, Sentimental Outlook, Intermarket Analysis, Future trend targets.. go ahead to check 👉👉👉🔗
⚠️Trading Alert : News Releases and Position Management 📰 🗞️ 🚫🚏
As a reminder, news releases can have a significant impact on market prices and volatility. To minimize potential losses and protect your running positions,
we recommend the following:
Avoid taking new trades during news releases
Use trailing stop-loss orders to protect your running positions and lock in profits
💖Supporting our robbery plan 💥Hit the Boost Button💥 will enable us to effortlessly make and steal money 💰💵. Boost the strength of our robbery team. Every day in this market make money with ease by using the Thief Trading Style.🏆💪🤝❤️🎉🚀
I'll see you soon with another heist plan, so stay tuned 🤑🐱👤🤗🤩

AUD/USD "The Aussie" Forex Market Bullish Heist Plan🌟Hi! Hola! Ola! Bonjour! Hallo!🌟
Dear Money Makers & Robbers, 🤑💰🐱👤🐱🏍
Based on 🔥Thief Trading style technical and fundamental analysis🔥, here is our master plan to heist the AUD/USD "The Aussie" Forex market. Please adhere to the strategy I've outlined in the chart, which emphasizes long entry. Our aim is the high-risk Red Zone. Risky level, overbought market, consolidation, trend reversal, trap at the level where traders and bearish robbers are stronger. 🏆💸Book Profits Be wealthy and safe trade.💪🏆🎉
Entry 📈 : "The vault is wide open! Swipe the Bullish loot at any price - the heist is on!
however I advise placing Buy limit orders within a 15 or 30 minute timeframe. Entry from the most recent or closest low or high level should be in retest.
Stop Loss 🛑: Thief SL placed at 0.62500(swing Trade Basis) Using the 6H period, the recent / nearest low level.
SL is based on your risk of the trade, lot size and how many multiple orders you have to take.
Target 🎯: 0.65670 (or) Escape Before the Target
🧲Scalpers, take note 👀 : only scalp on the Long side. If you have a lot of money, you can go straight away; if not, you can join swing traders and carry out the robbery plan. Use trailing SL to safeguard your money 💰.
📰🗞️Fundamental, Macro, COT, Sentimental Outlook:
AUD/USD "The Aussie" Forex Market market is currently experiencing a bullish trend,., driven by several key factors.
🔵Market Overview
Current Price: 0.63684
30-Day High: 0.6542
30-Day Low: 0.6147
30-Day Average: 0.6215
🟤Fundamental Analysis
Economic Trends: The Australian economy is expected to grow, driven by a rebound in consumer spending and investment
Interest Rates: The Reserve Bank of Australia is expected to maintain low interest rates, supporting the Australian dollar
🟡Macro Economics
Global Economic Trends: The ongoing global economic recovery is expected to drive up demand for commodities, including Australian exports
Inflation Rate: Global inflation is expected to rise to 3.8% in 2025, potentially increasing demand for commodities and supporting the Australian dollar
Interest Rates: Central banks are expected to maintain low interest rates in 2025, supporting currency markets
🔴COT Data
Non-Commercial Traders (Institutional):
Net Long Positions: 55%
Open Interest: 120,000 contracts
Commercial Traders (Companies):
Net Short Positions: 30%
Open Interest: 80,000 contracts
Non-Reportable Traders (Small Traders):
Net Long Positions: 15%
Open Interest: 40,000 contracts
COT Ratio: 2.2 (indicating a bullish trend)
🟠Sentimental Analysis
Institutional Sentiment: 60% bullish, 40% bearish
Retail Sentiment: 55% bullish, 45% bearish
Market Mood: The overall market mood is bullish, with a sentiment score of +30
🟢Positioning Analysis
Institutional Traders: Net long positions increased by 5% over the past week, indicating growing bullish sentiment
Retail Traders: Net long positions decreased by 2% over the past week, indicating decreasing bullish sentiment
Leverage: The average leverage used by traders has increased to 2.5, indicating growing confidence in the market
⚫Next Move Prediction
Bullish Move: Potential upside to 0.65500-0.66000
Target: 0.65670 (primary target), 0.66000 (secondary target)
Stop Loss: 0.62500 (below the 30-day low)
Risk-Reward Ratio: 1:2 (potential profit of 0.02516 vs potential loss of 0.01267)
⚪Overall Outlook
The overall outlook for AUD/USD is bullish, driven by a combination of fundamental, technical, and sentimental factors. The expected growth in the Australian economy, low interest rates, and bullish market sentiment are all supporting the bullish trend. However, investors should remain cautious of potential downside risks, including changes in global economic trends and unexpected regulatory developments.
⚠️Trading Alert : News Releases and Position Management 📰 🗞️ 🚫🚏
As a reminder, news releases can have a significant impact on market prices and volatility. To minimize potential losses and protect your running positions,
we recommend the following:
Avoid taking new trades during news releases
Use trailing stop-loss orders to protect your running positions and lock in profits
📌Please note that this is a general analysis and not personalized investment advice. It's essential to consider your own risk tolerance and market analysis before making any investment decisions.
📌Keep in mind that these factors can change rapidly, and it's essential to stay up-to-date with market developments and adjust your analysis accordingly.
💖Supporting our robbery plan will enable us to effortlessly make and steal money 💰💵 Tell your friends, Colleagues and family to follow, like, and share. Boost the strength of our robbery team. Every day in this market make money with ease by using the Thief Trading Style.🏆💪🤝❤️🎉🚀
I'll see you soon with another heist plan, so stay tuned 🤑🐱👤🤗🤩

AUD/USD "The Aussie Dollar" Forex Market Bearish Heist Plan🌟Hi! Hola! Ola! Bonjour! Hallo!🌟
Dear Money Makers & Thieves, 🤑 💰🐱👤
Based on 🔥Thief Trading style technical and fundamental analysis🔥, here is our master plan to heist the AUD/USD "The Aussie Dollar" Forex market. Please adhere to the strategy I've outlined in the chart, which emphasizes long entry. Our aim is the high-risk Red Zone. Risky level, overbought market, consolidation, trend reversal, trap at the level where traders and bearish robbers are stronger. 🏆💸Be wealthy and safe trade.💪🏆🎉
Entry 📈 : "The vault is wide open! Swipe the Bullish loot at any price - the heist is on!
however I advise placing Buy Stop Orders above the breakout MA or Place Buy limit orders within a 15 or 30 minute timeframe. Entry from the most re cent or closest low or high level should be in retest.
Stop Loss 🛑: Thief SL placed at the recent / nearest low level Using the 4H timeframe,
SL is based on your risk of the trade, lot size and how many multiple orders you have to take.
Target 🎯: 0.65100 (or) Escape Before the Target
Scalpers, take note 👀 : only scalp on the Long side. If you have a lot of money, you can go straight away; if not, you can join swing traders and carry out the robbery plan. Use trailing SL to safeguard your money 💰.
📰🗞️Fundamental, Macro, COT, Sentimental Outlook:
AUD/USD "The Aussie Dollar" Forex Market is currently experiencing a Bullish trend., driven by several key factors.
💨 Fundamental Analysis
The AUD/USD pair is struggling due to dismal Goods Trade Balance data from Australia, a modest US Dollar uptick, February RBA rate cut bets, and US-China trade war fears. Australia's trade surplus has shrunk to a three-month low, and the latest Q4 Consumer Price Index (CPI) figures showed that headline inflation rose by 2.5% YoY, down from 2.8% in the previous quarter.
💨 Macro Economics
The Reserve Bank of Australia (RBA) has kept interest rates at record highs, while the US Federal Reserve (Fed) has trimmed the benchmark interest rate by 100 bps through 2024 and aims to slow the pace of cuts in 2025 . The Australian economy is expected to be affected by the US-China trade war, as China is its biggest export market.
💨 COT Analysis
Large speculators and asset managers remain net-long the US dollar index, although the latter has a more convincing bullish view . The Australian Dollar COT Index represents the positioning of large non-commercial (speculator) net positions minus large commercial (hedger) net positions.
💨 Key Takeaways
The AUD/USD pair is bearish due to weak Australian data, US Dollar strength, and trade war fears.
The RBA is expected to cut interest rates in February, while the Fed is slowing the pace of rate cuts.
Large speculators and asset managers remain net-long the US dollar index.
💨 Bullish Factors
RBA Rate Cut Priced In: Markets have already priced in a 25 basis point rate cut by the RBA, which could limit the downside potential for AUD/USD.
China's Economy Showing Signs of Recovery: China's latest economic data, including the Caixin Services PMI, has shown signs of recovery, which could boost demand for Australian exports and support the AUD.
Iron Ore Prices Rising: Iron ore prices have been rising due to supply disruptions and strong demand from China, which could support the AUD.
AUD/USD Oversold: The AUD/USD pair is currently oversold, with the Relative Strength Index (RSI) below 30, which could lead to a technical bounce.
US Dollar Overbought: The US Dollar is currently overbought, with the US Dollar Index (DXY) above 98, which could lead to a correction and support the AUD.
Positive Australian Data: Australia's latest economic data, including the Q4 Consumer Price Index (CPI) and the January employment report, has been positive, which could support the AUD.
Technical Support: The AUD/USD pair has technical support at 0.6200, which could limit the downside potential.
💨 Bullish Scenarios
AUD/USD breaks above 0.6300: A break above 0.6300 could lead to a rally towards 0.6400.
RBA surprises with no rate cut: If the RBA surprises markets with no rate cut, the AUD could rally towards 0.6500.
China's economy continues to recover: If China's economy continues to show signs of recovery, the AUD could benefit from increased demand for Australian exports.
💨 Market sentiment for AUD/USD is currently bullish, with 76% of traders holding long positions ¹. This is also reflected in IG's client sentiment data, which shows that 78% of client accounts are long on this market
However, it's essential to note that market sentiment can change rapidly, and it's crucial to consider other factors, such as technical analysis and fundamental data, when making trading decisions.
From a technical perspective, AUD/USD is struggling to capitalize on its recent recovery move from a multi-year low, dropping toward 0.6250 due to dismal Goods Trade Balance data from Australia
Fundamentally, the Australian economy is expected to be affected by the US-China trade war, as China is its biggest export market. The Reserve Bank of Australia (RBA) has kept interest rates at record highs, while the US Federal Reserve (Fed) has trimmed the benchmark interest rate by 100 bps through 2024 and aims to slow the pace of cuts in 2025
⚠️Trading Alert : News Releases and Position Management 📰 🗞️ 🚫🚏
As a reminder, news releases can have a significant impact on market prices and volatility. To minimize potential losses and protect your running positions,
we recommend the following:
Avoid taking new trades during news releases
Use trailing stop-loss orders to protect your running positions and lock in profits
📌Please note that this is a general analysis and not personalized investment advice. It's essential to consider your own risk tolerance and market analysis before making any investment decisions.
📌Keep in mind that these factors can change rapidly, and it's essential to stay up-to-date with market developments and adjust your analysis accordingly.
💖Supporting our robbery plan will enable us to effortlessly make and steal money 💰💵 Tell your friends, Colleagues and family to follow, like, and share. Boost the strength of our robbery team. Every day in this market make money with ease by using the Thief Trading Style.🏆💪🤝❤️🎉🚀
I'll see you soon with another heist plan, so stay tuned 🤑🐱👤🤗🤩

AUD/USD "The AUSSIE" Forex Market Heist Plan on Bullish🌟Hi! Hola! Ola! Bonjour! Hallo!🌟
Dear Money Makers & Robbers, 🤑 💰
Based on 🔥Thief Trading style technical and fundamental analysis🔥, here is our master plan to heist the AUD/USD "The AUSSIE" Forex market. Please adhere to the strategy I've outlined in the chart, which emphasizes long entry. Our aim is the high-risk Red Zone. Risky level, overbought market, consolidation, trend reversal, trap at the level where traders and bearish robbers are stronger. Be wealthy and safe trade.💪🏆🎉
Entry 📈 : Traders & Thieves with New Entry A bull trade can be initiated at any price level.
However I advise placing Buy limit orders within a 15 or 30 minute timeframe. Entry from the most recent or closest low or high level should be in retest.
Stop Loss 🛑: Using the 2H period, the recent / nearest low or high level.
Goal 🎯: 0.63800 (or) Escape Before the Target
Scalpers, take note 👀 : only scalp on the Long side. If you have a lot of money, you can go straight away; if not, you can join swing traders and carry out the robbery plan. Use trailing SL to safeguard your money 💰.
Fundamental Outlook 📰🗞️
The AUD/USD pair is looking interesting right now, with some mixed signals from the latest analysis. On one hand, the pair has stabilized at its horizontal support area, which could lead to a bullish continuation, with the price potentially breaking above the range's resistance. On the other hand, some experts are warning of a potential reversal, with the pair showing signs of exhaustion and a possible shift in momentum.
In terms of fundamentals, the Australian Consumer Inflation Expectations for July increased 6.3% annualized, while the Australian Employment Change for June came in at 88.4K and the Unemployment Rate at 3.5% . The US Initial Jobless Claims for the week of July 9th are predicted at 235K, and US Continuing Claims for the week of July 2nd are predicted at 1,383K. The US PPI for June is predicted to increase 0.8% monthly and 10.7% annualized.
The forecast for the AUD/USD turned bullish after the pair stabilized at its horizontal support area, with short-term volatility likely to rise as bulls and bears fight for control. However, the Ichimoku Kinko Hyo Cloud continues to apply downside pressure, suggesting a rocky path higher. Traders should monitor the CCI after it has formed a positive divergence in extreme oversold territory followed by a breakout above -100.
Overall, it's a bit of a mixed bag, but the bullish scenario is gaining traction. The AUD/USD pair could move in a bullish direction.
BULLISH FACTORS:
Strong US Economy: A strong US economy could lead to an increase in demand for the US dollar, which could put upward pressure on the AUD/USD pair.
Interest Rate Differentials: The interest rate differential between the US and Australia is expected to remain positive, which could support the US dollar and put upward pressure on the AUD/USD pair.
Commodity Prices: A rise in commodity prices, particularly iron ore, could put upward pressure on the Australian dollar and support the AUD/USD pair.
Trading Alert⚠️ : News Releases and Position Management 📰 🗞️ 🚫🚏
As a reminder, news releases can have a significant impact on market prices and volatility. To minimize potential losses and protect your running positions,
we recommend the following:
Avoid taking new trades during news releases
Use trailing stop-loss orders to protect your running positions and lock in profits
Please note that this is a general analysis and not personalized investment advice. It's essential to consider your own risk tolerance and market analysis before making any investment decisions.
Keep in mind that these factors can change rapidly, and it's essential to stay up-to-date with market developments and adjust your analysis accordingly.
💖Supporting our robbery plan will enable us to effortlessly make and steal money 💰💵 Tell your friends, Colleagues and family to follow, like, and share. Boost the strength of our robbery team. Every day in this market make money with ease by using the Thief Trading Style.🏆💪🤝❤️🎉🚀
I'll see you soon with another heist plan, so stay tuned 🫂

Update levels AUDUSD 11.12.24I had to modify this analysis a little because I interpreted the closing triangle here which was wrong, plus I added some levels here and overall I think the market will go a little lower around the price of 0.62700, we could finally create an SFP from this zone, we could move somewhere for the price, easily around the level of 0.67, which is also the point where there is poc level suppor and the fibo level of 0.618, but for now it's still just a matter of waiting.

Scenario on AUDUSDAt the end of this movement I see a final triangle forming after which an upward movement should occur, but since we still have relatively strong support at 0.63900, it is possible that the price could test this support and then after rejection the price could finally establish an SFP. Another scenario could be that the price rises immediately after the wave is completed, and for now it is just a look, nothing is finalized.

AUD/USD "AUSSIE DOLLAR" Bank Money Heist Plan on Bullish Side.Ola! Ola! My Dear Robbers / Money Makers & Losers, 🤑 💰
This is our master plan to Heist AUD/USD "AUSSIE DOLLAR" Bank based on Thief Trading style Technical Analysis.. kindly please follow the plan I have mentioned in the chart focus on Long entry. Our target is Red Zone that is High risk Dangerous level, market is overbought / Consolidation / Trend Reversal / Trap at the level Bearish Robbers / Traders gain the strength. Be safe and be careful and Be rich.
Entry : Can be taken Anywhere, What I suggest you to Place Buy Limit Orders in 15mins Timeframe Recent / Nearest Swing Low
Stop Loss 🛑 : Recent Swing Low using 1h timeframe
Attention for Scalpers : If you've got a lot of money you can get out right away otherwise you can join with a swing trade robbers and continue the heist plan, Use Trailing SL to protect our money 💰.
Warning : Fundamental Analysis news 📰 🗞️ comes against our robbery plan. our plan will be ruined smash the Stop Loss. Don't Enter the market at the news update.
Loot and escape on the target 🎯 Swing Traders Plz Book the partial sum of money and wait for next breakout of dynamic level / Order block, Once it is cleared we can continue our heist plan to next new target.
Support our Robbery plan we can easily make money & take money 💰💵 Follow, Like & Share with your friends and Lovers. Make our Robbery Team Very Strong Join Ur hands with US. Loot Everything in this market everyday make money easily with Thief Trading Style.
Stay tuned with me and see you again with another Heist Plan..... 🫂

#AUD/USD 1HAUD/USD 1H – Falling Wedge Pattern
The AUD/USD pair on the 1-hour chart is showing a falling wedge pattern, which is a classic bullish reversal setup. This pattern indicates that the price, currently in a downtrend, may soon reverse and move higher.
#Pattern Overview:
-Falling Wedge: The pattern is defined by two downward-sloping, converging trendlines. The price moves within this narrowing range as selling pressure weakens over time, which often leads to a bullish breakout.
#Forecast:
-Buy Signal: The anticipated move is a breakout above the upper resistance trendline of the wedge. This breakout is considered a strong buy signal, suggesting the price will move upward as the bearish momentum fades.
#Trading Strategy:
- *Entry Point: Enter a buy position when the price decisively breaks out of the wedge and closes above the resistance line.
- Targets: Initial targets for the move upward could be based on nearby resistance levels or prior price action highs.
-Stop Loss: To manage risk, place a stop-loss below the most recent swing low inside the wedge, ensuring protection in case of a false breakout.
This setup points to a buying opportunity upon breakout, as the AUD/USD pair is likely to climb after confirming the bullish reversal.

AUDUSD BULLISH MOMENTUMThat's an amazing opportunity to buy right now, i'm looking for this break of the resistance we had a nice bullish confirmation from the 1h fvg ,if price close above the 200 ema il be more interested in looking for buy entries and aim for 0.65800 at least.

AUDUSD, Time for SELL ?Hello traders, hope you doing great.
for upcoming week, I think we'll probably see a downtrend in AUDUSD to specified Level. so with a proper trigger, we can open a short position.
and finally tell me what do you think? UP or DOWN? leave your comment below .
if this post was helpful to you, please like and share with your friends.
Thanks.

AUDUSD Short Term Buy IdeaD1 - Double trend line breakout
No opposite signs
Expecting the price to continue higher further in the short term
H4 - Currently the price is moving inside a range
A valid breakout above the top of the range would be the validation for this bullish view.
Alternatively if we get a valid breakout below the bottom of this range then this bullish view will be invalidated.

AUDUSD - Looking To Buy Pullbacks In The Short TermD1 - Downtrend line breakout
No opposite signs
Expecting short term bullish moves to happen here.
H4 - Strong bullish momentum
Currently it looks like a pullback is happening.
Until the two strong support zones hold my short term view remains bullish here.

AUDUSD WYCKOFF BULLISH HELLO FRIENDS
AUDUSD had created a Harmonic Pattern which called Wyckoff and tested a strong Weekly based support zone now we are looking for more bullish move in this pair with very low risk entry Friends it's just a trade idea shares Ur thoughts with us and stay tuned for more updates.

AUDUSD Short Term Sell IdeaH4 - Bearish trend pattern followed by a pullback.
Bearish convergence.
Until the strong resistance zone holds I expect the price to move lower further after pullbacks.

AUDUSD - Looking To Sell Pullbacks In The Short TermH4 - Strong bearish momentum.
Lower lows.
Until the strong resistance zone holds I would be looking to sell pullbacks in the short term.

AUDUSD Short Term Sell IdeaH1 - Bearish trend pattern.
Currently it looks like a pullback is happening.
Until the two strong resistance zones hold my short term view remains bearish here.

AUDUSD BUYING ZONE !!!HELLO TRADERS !!!
As we can see this pair is holding weekly support and moving to north and we are looking for buying opportunity for this pair now it have to retrace with DXY move to the downside till the buying zone so we are looking for these design levels so we will trade on this pair with a low risk and higher rewards its just a trade idea share ur thoughts on this pair with us & stay tuned for new entries

AUDUSD Analysis 10July2023there is consolidation with a fairly wide price range. I still believe if this pair there is a strong opportunity to be bullish. with today seen morubozu bullish candle.
