AUDUSD Will Keep Falling!
HI,Traders !
#AUDUSD keeps falling down
And the pair made a strong
Bearish breakout of the key
Horizontal key level of 0.64796
And the breakout is confirmed
So we are bearish biased and
We will be expecting a further
Bearish move down !
Comment and subscribe to help us grow !
Audusdsell

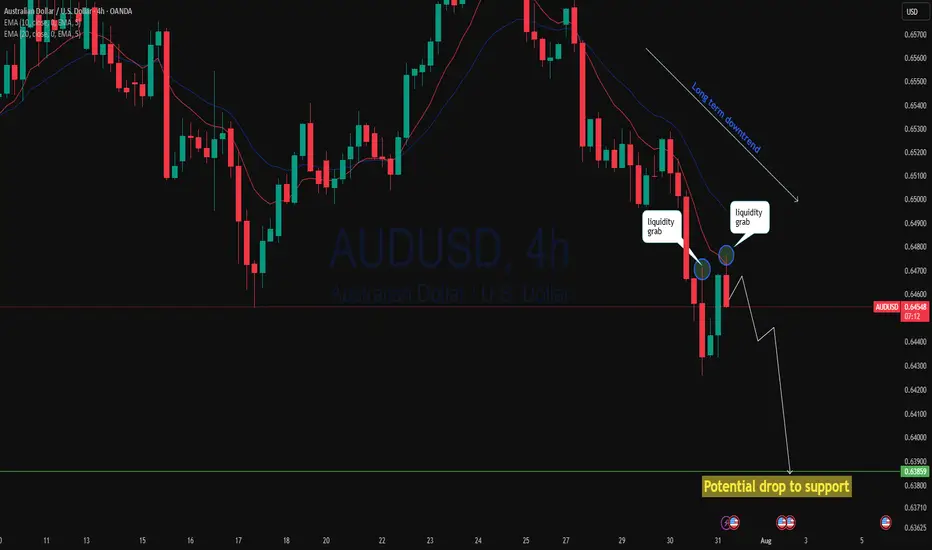
AUDUSD 2 step liquidity grab and drop?AUDUSD 4h has rejected twice from a key area after yesterday's massive breakdown with AUD negative data. Price has done a narrow pullback then this session is rejecting again with a stronger momentum could continue to drop to support. As 4h price action showing strong bearish move we may see continuation of the down trend!
audusd sell signal. Don't forget about stop-loss.
Write in the comments all your questions and instruments analysis of which you want to see.
Friends, push the like button, write a comment, and share with your mates - that would be the best THANK YOU.
P.S. I personally will open entry if the price will show it according to my strategy.
Always make your analysis before a trade
AUDUSD SELLAUD/USD dives to three-week lows near 0.6560 after weak Australian employment data
The Australian Dollar is one of the weakest performers of the G8 currencies on Thursday, hammered by a disappointing Australian Employment report and the overall risk-averse market, which is boosting demand for safe-haven assets, such as the US Dollar
The battle between the Australian Dollar (AUD) and the US Dollar (USD) will be one worth watching in 2025, with central banks stealing the limelight. The Reserve Bank of Australia (RBA) has kept interest rates at record highs whilst most of its overseas counterparts started the loosening process. The US Federal Reserve (Fed), on the other hand, has trimmed the benchmark interest rate by 100 bps through 2024 and aims to slow the pace of cuts in 2025. The central banks’ imbalance aims for record lows in AUD/USD
TP 1 0.650
TP 2 0.649
TP 3 0.648
RESISTANCE 0.653

AUDUSD Bearish Breakout!
HI,Traders !
AUD-USD is trading in a sideways trend
and the pair
Made a breakout of the
Key horizontal level
Of 0.8149 which is now
A resistance and the pair
Is now making a retest
Of the level so as we are
Bearish biased we will
Be expecting a pullback
And a further bearish
Move down !
Comment and subscribe to help us grow !

AUDUSD SHORT FORECAST Q3 D10 W28 Y25AUDUSD SHORT FORECAST Q3 D10 W28 Y25
Professional Risk Managers👋
Welcome back to another FRGNT chart update📈
Diving into some Forex setups using predominantly higher time frame order blocks alongside confirmation breaks of structure.
Let’s see what price action is telling us today! 👀
💡Here are some trade confluences📝
✅Daily Order block identified
✅4H Order Block identified
✅1H Order Block identified
🔑 Remember, to participate in trading comes always with a degree of risk, therefore as professional risk managers it remains vital that we stick to our risk management plan as well as our trading strategies.
📈The rest, we leave to the balance of probabilities.
💡Fail to plan. Plan to fail.
🏆It has always been that simple.
❤️Good luck with your trading journey, I shall see you at the very top.
🎯Trade consistent, FRGNT X

AUDUSD H4 AnalysisAUDUSD Showing a Bearish Flag. If it breaks this zone above, Most probably can fly up to 0.65018 and higher to 0.65379. If no, Can rally between 0.64068 or even lower to 0.63878. Trading Analysis from 23-06-25 to 27-06-25. Take your risk under control and wait for market to break support or resistance on smaller time frame. Best of luck everyone and happy trading.🤗

audusd sell signal. Don't forget about stop-loss.
Write in the comments all your questions and instruments analysis of which you want to see.
Friends, push the like button, write a comment, and share with your mates - that would be the best THANK YOU.
P.S. I personally will open entry if the price will show it according to my strategy.
Always make your analysis before a trade

AUD Bulls Charge on China CPI & Trade HopesOANDA:AUDUSD is trading near 0.6510, buoyed by China’s better-than-expected May CPI print at -0.1% YoY (vs forecast of -0.4%) and optimism over the renewed U.S.-China trade dialogue, which has improved global risk sentiment.
Despite weak CMCMARKETS:AUDUSD Australian Q1 GDP and a narrower trade surplus, the Aussie remains firm as a proxy for Chinese demand and commodity-linked risk appetite.
From a technical perspective, the pair is moving within an ascending hourly channel and is currently testing key resistance at 0.6517. A confirmed breakout could clear the path toward monthly resistance at 0.6582. However, failure to break higher may see a pullback to 0.6492, or deeper to the critical support at 0.6411. As long as the channel structure remains intact, the bias stays bullish.
Resistance : 0.6517 , 0.6582
Support : 0.6492 , 0.6411

audusd sell signal. Don't forget about stop-loss.
Write in the comments all your questions and instruments analysis of which you want to see.
Friends, push the like button, write a comment, and share with your mates - that would be the best THANK YOU.
P.S. I personally will open entry if the price will show it according to my strategy.
Always make your analysis before a trade

AUDUSD Daily Squeeze – Breakout LoadingAUDUSD is pressing against descending trendline resistance, forming a bullish continuation wedge just above the 0.6420–0.6450 support zone (50% Fib level). Price has been consolidating tightly, suggesting a potential breakout setup is developing.
Key Levels:
Resistance: 0.6500 – 0.6547 (wedge top and 61.8% Fib)
Support: 0.6420 (local structure), 0.6300 (deeper demand zone)
Bullish Target: 0.6718 → 0.6900 → 0.6950
Invalidation: Daily close below 0.6410
Scenarios:
🔹 Bullish Breakout
Clean break above wedge resistance
Momentum push toward 0.6700–0.6900 zone
Confirmation = daily close above 0.6547 (Fib confluence)
🔹 Fakeout + Pullback
Temporary rejection leads to retest of 0.6420–0.6400
Holds support = high-probability long setup for second wave up
Outlook:
Bias: Bullish
AUDUSD is building bullish pressure after defending key support. Wedge structure favors breakout continuation, especially if global risk sentiment remains firm and USD softens.

CAUTION 50'EMA NOT ON SIDE AUDUSD SHORT FORECAST Q2 W21 D22 Y25CAUTION 50'EMA NOT ON SIDE AUDUSD SHORT FORECAST Q2 W21 D22 Y25
Professional Risk Managers👋
Welcome back to another FRGNT chart update📈
Diving into some Forex setups using predominantly higher time frame order blocks alongside confirmation breaks of structure.
Let’s see what price action is telling us today!
💡Here are some trade confluences📝
✅4H Order Block
✅Tokyo ranges to be filled
✅15' order block identified
✅Weekly 50 EMA forecasting rejection
✅Daily 50 EMA target
🔑 Remember, to participate in trading comes always with a degree of risk, therefore as professional risk managers it remains vital that we stick to our risk management plan as well as our trading strategies.
📈The rest, we leave to the balance of probabilities.
💡Fail to plan. Plan to fail.
🏆It has always been that simple.
❤️Good luck with your trading journey, I shall see you at the very top.
🎯Trade consistent, FRGNT X

audusd sell signal. Don't forget about stop-loss.
Write in the comments all your questions and instruments analysis of which you want to see.
Friends, push the like button, write a comment, and share with your mates - that would be the best THANK YOU.
P.S. I personally will open entry if the price will show it according to my strategy.
Always make your analysis before a trade

Aussie Turns Bullish — All Eyes on RBACMCMARKETS:AUDUSD AUD/USD trades near 0.6448 ahead of the RBA rate decision, where a 25bps cut to 3.85% is widely expected. Technically, a breakout above the falling trendline suggests a potential bullish reversal. Immediate support lies at 0.6422–0.6406. A rejection near minor resistance at 0.6456 could trigger a pullback, while a sustained break above that level may open room for gains beyond 0.6500. Market direction hinges on RBA’s tone and Governor Bullock’s guidance on future easing.
Resistance : 0.6456 , 0.6500
Support : 0.6422 , 0.6406

AUD/USD Analysis TodayAustralia's Unemployment Rate Remained Stable in April 📊
May 15 — Data released by the Australian Bureau of Statistics (ABS) showed that after seasonal adjustment, Australia's unemployment rate stayed steady at 4.1% in April 2025 👏. The trend-based unemployment rate also held firm at 4.1%, matching the adjusted figure from March 📈.
Meanwhile, the AUD/USD is currently showing a strong upward trend 🔥, with continued bullish sentiment and a target price of 0.64800 🎯
⚡️⚡️⚡️ AUDUSD ⚡️⚡️⚡️
🚀 Buy@ 0.64400 - 0.64500
🚀 TP 0.64750 - 0.64800
Accurate signals are updated every day 📈 If you encounter any problems during trading, these signals can serve as your reliable guide 🧭 Feel free to refer to them! I sincerely hope they'll be of great help to you 🌟 👇

AUD)USD) resistance level back down Read The ChaptianSMC Trading point update
Technical analysis for the AUD/USD pair on the 1-hour timeframe. Here's a breakdown of the idea presented:
Key Elements:
1. Resistance Level (0.65000 - 0.65200 area):
Price is approaching this strong resistance zone.
RSI is in the overbought zone (above 70), indicating potential reversal or correction.
2. Expected Price Action:
The chart suggests that price may spike into the resistance area (possibly a liquidity grab).
After hitting resistance, a drop is expected toward the FVG (Fair Value Gap) zone.
3. FVG and Target Zone (~0.64059):
There’s a highlighted Fair Value Gap that may attract price for mitigation.
Target point is near the EMA200 level and inside a previous structure zone.
This area also aligns with the RSI cooling off.
4. Support Level (~0.63600):
Marked as a stronger support area, though the current trade setup doesn't expect price to reach there soon.
5. EMA200 (blue line around 0.64202):
Acts as dynamic support.
Target is slightly below this EMA, potentially a liquidity sweep before a bounce.
Mr SMC Trading point
---
Summary of the Idea:
Bearish bias after a resistance rejection.
Look for short opportunities around the resistance zone (0.6500 area).
Target near 0.6405–0.6420 (FVG + EMA200).
Overbought RSI supports this pullback expectation.
Pelas support boost 🚀 analysis follow)

AUDUSD Bearish Breakout – Macro and Technicals AlignAUDUSD has broken below a rising wedge formation on the 4H chart, signaling a bearish continuation. With the Reserve Bank of Australia pausing rates and weak local data weighing on sentiment, while the Federal Reserve maintains a hawkish hold due to sticky labor costs, this trade sets up well both technically and fundamentally. I'm watching for downside continuation toward 0.6379 and potentially 0.6350. The bearish bias is invalidated on a move above 0.6475.
🔍 Technical Analysis
Structure: Price broke down from a rising wedge and continues forming bear flags — each followed by further selling pressure.
Current Price Action:
Rejected sharply at ~0.6475 (last swing high)
Confirmed breakout with downside momentum
Key Support Levels:
0.6379 – minor structural support
0.6350 – major support zone from April
Resistance / Invalidation:
Above 0.6475 – would break the bearish structure and negate the setup
Bias: Bearish — clean structure, breakout momentum, and sustained lower highs
🌏 Fundamental Context
🇦🇺 Bearish AUD Drivers:
Weak domestic data:
Building Approvals: -8.8% vs -1.7% forecast
RBA on hold:
No rate hike in sight; cautious due to housing and China concerns
China slow-down:
PBOC cut rates and reduced reserve requirements — signals broader economic softness
🇺🇸 Bullish USD Drivers:
Fed holding firm:
Benchmark rate held at 4.25–4.50%
Labor costs surged +5.3% q/q
Productivity dropped -0.4%, reinforcing inflation concerns
Market repricing rate cuts:
Cuts now expected later in 2025 or even 2026
Political pressure from Trump:
Despite attacks on Jerome Powell, Fed appears unmoved
Trump teasing a “major trade deal” — potentially USD-positive if credible
🎯 Trade Setup
Entry Area: Watching 0.6420–0.6435 as a pullback zone for potential shorts
Target Levels:
First target: 0.6379
Second target: 0.6350
Stop Loss: Placed above 0.6475 (last swing high) to protect against false breakouts
Trade Thesis:
Technical structure supports downside continuation
Macro fundamentals favor USD strength and AUD weakness
Clean reward-to-risk if structure holds
🧭 Conclusion
AUDUSD setup is supported by a strong confluence of technical breakdown and macro divergence. With the Fed staying firm and the RBA cautious amid weak data, the fundamentals validate the bearish trend. As long as price stays below 0.6475, the outlook remains bearish, with 0.6379 and 0.6350 as the next logical levels. Caution around U.S. data releases or trade deal news is advised, but the path of least resistance remains downward.

AUDUSD BEARISH(SELL) TECHNICAL SCENARIO.AUD/USD Market Analysis Scenario
Pair: AUD/USD
Bias: Bearish
Entry Consideration: Upon confirmation of rejection or reversal near the resistance zone.
Key Levels
Resistance: 0.64960 (critical supply zone)
1st Target: 0.64200
Final Target: 0.63800
Technical Scenario
The AUD/USD pair is currently trading below a strong resistance at 0.64960, which has acted as a key reversal zone in the recent past. Price action near this level indicates a potential bearish reversal pattern, such as a bearish engulfing, double top, or rejection wicks on higher time frames (H4 or D1).
If the pair fails to break above 0.64960, we can expect a downward movement toward the first support target at 0.64200, where minor demand might provide temporary consolidation. If bearish momentum continues, the pair could head further down to the final target at 0.63800, a previous swing low and stronger demand area.

The trend next weekJudging from the price trend presented in the chart, the current market is clearly in a bearish state 📉. Previously, after the price reached the key resistance level of 0.64500, it failed to break through effectively and continue the upward trend. Instead, it entered a consolidation pattern 📊. This indicates that the bullish forces encountered strong resistance near this price level and found it difficult to push the price higher 👎.
It is expected that in the coming period, without significant positive news stimuli, the price is highly likely to continue its downward trend 📉. Investors should closely monitor whether the support level of 0.63340 holds 👀. If this support level is broken, they may consider selling short on rallies ⏬.
⚡⚡⚡ AUDUSD ⚡⚡⚡
🚀 Sell@0.6500 - 0.6450
🚀 TP 0.6350 - 0.6300
Accurate signals are updated every day 📈 If you encounter any problems during trading, these signals can serve as your reliable guide 🧭 Feel free to refer to them! I sincerely hope they'll be of great help to you 🌟
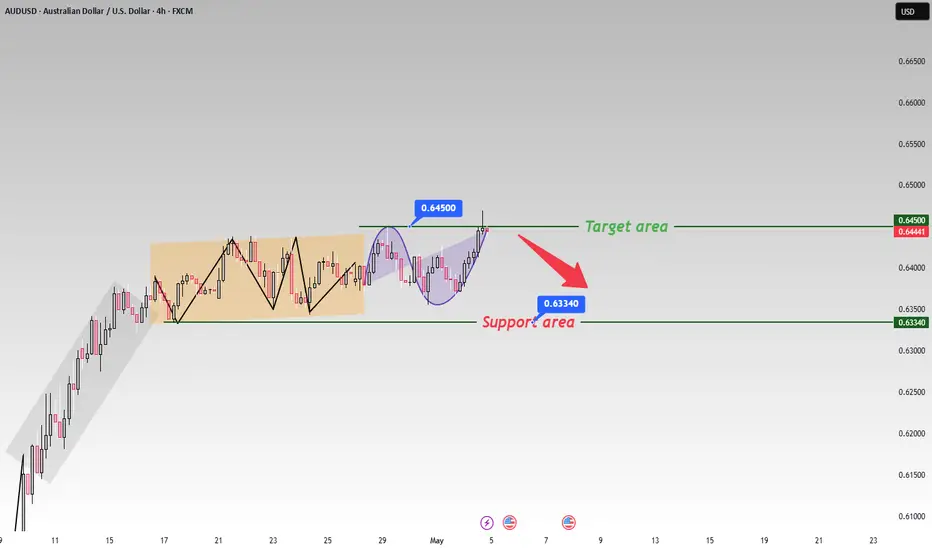
AUD/USD Opening Trends and Trading Strategies Next WeekThe AUD/USD has been in a range - bound fluctuation recently. 📈 In the short term, if the price can stay above the support level of 0.63340 and market risk - appetite sentiment rises, the AUD/USD is expected to challenge the target level of 0.64500. 🎯 However, if it breaks below the support level, it may trigger further downward adjustments. 📉
⚡⚡⚡ AUDUSD ⚡⚡⚡
🚀 Buy@0.6350 - 0.6380
🚀 TP 0.6400 - 0.6450
Accurate signals are updated every day 📈 If you encounter any problems during trading, these signals can serve as your reliable guide 🧭 Feel free to refer to them! I sincerely hope they'll be of great help to you 🌟

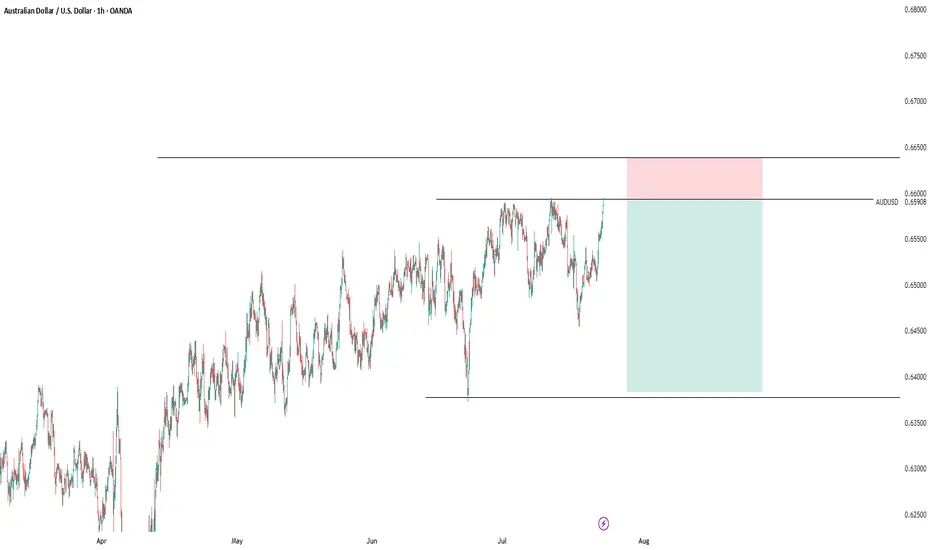
AUDUSD: Neutral View First Buy and Then Sell! Hey everyone!
Our first buy swing entry is going swimmingly! We’ve got over 500 pips running positively, and we reckon price can keep going up and then when it hits our selling zone, you can swing sell too. This is a fantastic opportunity where we can wait for price to do its thing and then when it reaches the sell zone, we can execute our order. But if you’re feeling adventurous and want to take a bit of a risk, you can take a buy entry at the given point and keep it up until it reaches our sell area.
With just one shot, we can make two entries!
Good luck and trade safely!
Thanks a bunch for your unwavering support! 😊
If you’d like to lend a hand, here are a few ways you can contribute:
- Like our ideas
- Comment on our ideas
- Share our ideas
Cheers,
Team Setupsfx_
❤️🚀

AUDUSD SHORT FORECAST Q2 W18 D2 Y25AUDUSD SHORT FORECAST Q2 W18 D2 Y25
Professional Risk Managers👋
Welcome back to another FRGNT chart update📈
Diving into some Forex setups using predominantly higher time frame order blocks alongside confirmation breaks of structure.
Let’s see what price action is telling us today!
💡Here are some trade confluences📝
✅Weekly 50 EMA
✅Intraday 15' order block
✅Tokyo ranges to be filled
✅Intraday 15' order block trading levels
🔑 Remember, to participate in trading comes always with a degree of risk, therefore as professional risk managers it remains vital that we stick to our risk management plan as well as our trading strategies.
📈The Xrest, we leave to the balance of probabilities.
💡Fail to plan. Plan to fail.
🏆It has always been that simple.
❤️Good luck with your trading journey, I shall see you at the very top.
🎯Trade consistent, FRGNT

AUDUSD(20250430)Today's AnalysisTechnical analysis:
Today's buying and selling boundaries: 0.6402
Support and resistance levels:
0.6475
0.6447
0.6430
0.6374
0.6356
0.6329
Trading strategy:
If the price breaks through 0.6402, consider buying, the first target price is 0.6430
If the price breaks through 0.6374, consider selling, the first target price is 0.6356
