AUDUSD SHORT FORECAST Q2 W26 D26 Y25AUDUSD SHORT FORECAST Q2 W26 D26 Y25
Professional Risk Managers👋
Welcome back to another FRGNT chart update📈
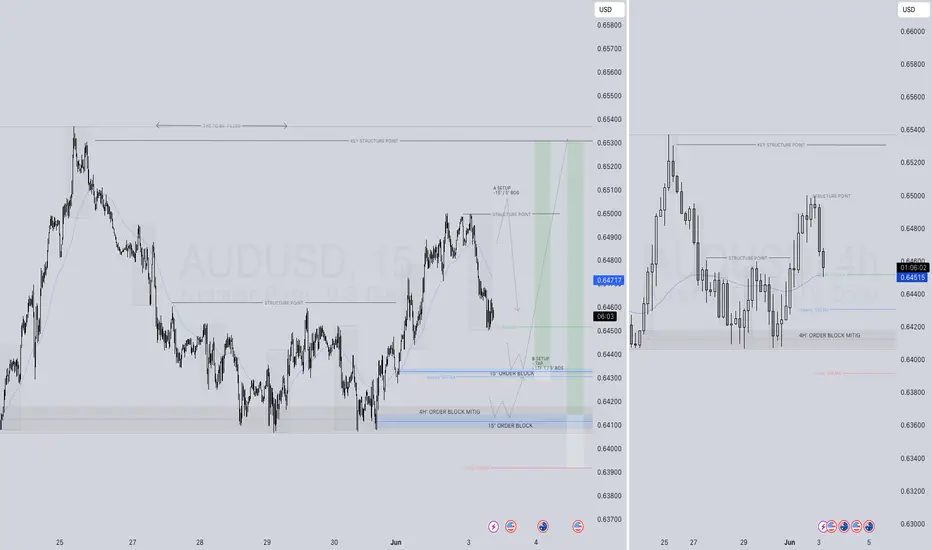
Diving into some Forex setups using predominantly higher time frame order blocks alongside confirmation breaks of structure.
Let’s see what price action is telling us today!
💡Here are some trade confluences📝
✅Daily order block
✅1H Order block
✅Intraday breaks of structure
✅4H Order block
🔑 Remember, to participate in trading comes always with a degree of risk, therefore as professional risk managers it remains vital that we stick to our risk management plan as well as our trading strategies.
📈The rest, we leave to the balance of probabilities.
💡Fail to plan. Plan to fail.
🏆It has always been that simple.
❤️Good luck with your trading journey, I shall see you at the very top.
🎯Trade consistent, FRGNT X
Audusdshort

AUDUSD Analysis – Falling from the Rising WedgeAUDUSD pair broke below an ascending wedge, a bearish reversal pattern.
Clean rejection from 0.6518, with lower highs and new lower lows confirming bearish momentum.
Price is now sitting below former trendline support, retested and respected as resistance.
Bearish target points toward 0.6400–0.6380 zone, aligning with recent swing lows.
Risk invalidation sits above 0.6520, where structure fails.
Technical Bias: Bearish
Target: 0.6400
Stop-loss zone: Above 0.6520
📊 Current Bias: Bearish
🔍 Key Fundamentals Driving AUDUSD
AUD Fundamentals (Weakening):
Australian jobs data was mixed, and wage growth has plateaued.
RBA remains cautious, with expectations for rate cuts later in 2025.
AUD pressured by China growth risks and weak commodity demand.
Geopolitical drag: Australia-China tensions and weak Chinese retail data from 618 Festival dampen AUD outlook.
USD Fundamentals (Resilient):
USD remains bid on risk-off flows, especially after weak global data and ongoing Middle East tensions.
Fed remains reluctant to cut fast despite disinflation signs – supports the USD.
US data is mixed, but rate cut odds are declining (only one expected in 2025 now per dot plot).
⚠️ Risks to This Bearish View
If China announces new stimulus, AUD could rebound sharply.
A dovish surprise from the Fed (e.g. Powell softening in speeches).
Sharp rebound in risk appetite (e.g. tech-led equity rally).
🗓️ Important Events to Watch
🇨🇳 China industrial profits & PMIs
🇦🇺 RBA Meeting Minutes (July preview hints)
🇺🇸 US Core PCE (June 28)
Global risk tone: watch metals, equities, and geopolitical headlines.
🚀 Which Asset Leads?
AUDUSD is lagging other USD pairs, but will likely lead commodity FX downside if China or metals weaken further.
Watch AUDJPY and EURAUD for further confirmation of risk-off flows and Aussie weakness.

AUDUSD H4 AnalysisAUDUSD Showing a Bearish Flag. If it breaks this zone above, Most probably can fly up to 0.65018 and higher to 0.65379. If no, Can rally between 0.64068 or even lower to 0.63878. Trading Analysis from 23-06-25 to 27-06-25. Take your risk under control and wait for market to break support or resistance on smaller time frame. Best of luck everyone and happy trading.🤗

AUDUSD LONG & SHORT FORECAST Q2 W25 D19 Y25AUDUSD LONG & SHORT FORECAST Q2 W25 D19 Y25
Professional Risk Managers👋
Welcome back to another FRGNT chart update📈
Diving into some Forex setups using predominantly higher time frame order blocks alongside intraday confirmation & breaks of structure.
Let’s see what price action is telling us today! 🔥
💡Here are some trade confluences📝
✅4H Order block identified
✅1H Order block identified
✅15’ order block
✅Intraday bullish breaks of structure
🔑 Remember, to participate in trading comes always with a degree of risk, therefore as professional risk managers it remains vital that we stick to our risk management plan as well as our trading strategies.
📈The rest, we leave to the balance of probabilities.
💡Fail to plan. Plan to fail.
🏆It has always been that simple.
❤️Good luck with your trading journey, I shall see you at the very top.
🎯Trade consistent, FRGNT X

AUD/USD Descending Triangle Setup – Support Retest in FocusThe AUD/USD pair is currently forming a descending triangle pattern, a common bearish continuation structure where price makes lower highs while holding above a horizontal or slightly rising support level. This setup indicates increasing selling pressure at lower resistance levels (highlighted with red arrows and trendlines), while buyers are consistently defending the green support zone around 0.6475–0.6485.
So far, the price has been rejected multiple times from the descending resistance line, confirming seller dominance. At the same time, it has found buying interest at support, forming a tight range where a breakout or breakdown is likely to occur soon.
🔽 Current Price Action & Outlook
The latest price structure shows a potential lower high forming, suggesting another move downward toward support.
If the pair revisits the support zone once again, it will be a critical retest, and the market could either:
Bounce from support, continuing the sideways structure within the triangle, or
Break down below the green trendline, triggering a bearish continuation.
Until the support breaks, the market remains range-bound inside the triangle, offering short-term trade setups between support and resistance.
🎯 Strategy Notes
Short-Term Idea: Sell near resistance (~0.6525–0.6535), buy near support (~0.6475–0.6485)
Breakout Traders: Wait for a confirmed breakout of either boundary with volume before entering
Invalidation: A strong breakout above the red descending trendline may invalidate the bearish structure
This is a neutral-to-bearish setup with a potential for breakout in either direction. Patience is key for waiting on confirmation.
=================================================================
Disclosure: I am part of Trade Nation's Influencer program and receive a monthly fee for using their TradingView charts in my analysis.
=================================================================

Audusd setup Here's a bullish analysis on AUD/USD (generic and adaptable to most timeframes; if you want it based on a specific chart or timeframe, let me know):
---
📈 AUD/USD Bullish Analysis
1. Support Zone Holding Strong:
AUD/USD has established a firm support level around where price has bounced multiple times.
Recent price action shows a double bottom or rounded base formation, indicating demand buildup.
2. Bullish Trendline Formation:
A new higher low structure is forming, suggesting a shift in momentum.
Price is respecting a short-term ascending trendline, signaling continued buying interest.
3. Breakout Confirmation:
A bullish breakout above the 0.6650 resistance opens room for an upward move.
Next target levels: 0.6700 and 0.6780.
4. RSI & Momentum Indicators:
RSI trending above 50, showing strength.
Bullish divergence on momentum indicators confirms possible upside continuation.
5. Fundamentals (Optional Context):
AUD supported by improving risk sentiment and commodity strength (especially iron ore and gold).
USD weakening slightly due to lower rate hike expectations from the Fed.
---
🎯 Bullish Targets:
Entry zone: 0.6620–0.6640
Target 1: 0.6700
Target 2: 0.6780
Stop-loss: Below support

MARKET TECHNICAL BREAK DOWN FOR 16TH TO 20TH JUNE📊 Market Technical Breakdown – EURUSD, AUDUSD, XAUUSD & BTCUSDT 🔍
Traders,
Get ready for this week’s precision-driven analysis across four major markets:
✅ EURUSD – Is the euro gaining strength or facing more downside?
✅ AUDUSD – Key zones to watch as the Aussie reacts to USD data.
✅ XAUUSD (Gold) – Will gold hold strong or give in to bearish pressure?
✅ BTCUSDT – Bitcoin’s momentum shift: Are bulls still in control?
This breakdown covers:
🔹 Clean chart analysis
🔹 Key levels (support & resistance)
🔹 Trade ideas with potential entries & exits
🔹 My personal trading insight for each pair
🎯 Whether you're a beginner or a seasoned trader, this breakdown will help sharpen your bias and build confidence in your trades.
👉 Watch the video till the end to catch all setups, confirmations, and bonus tips for the week.
Drop a comment if you found it helpful or want to see a pair included in the next breakdown!

AUDUSD Coiling Near Key Resistance, Big Move Ahead?After a long period of sideways chop, AUD/USD is finally showing signs of strength. Price has been pressing against the key resistance zone, and we’re now seeing a tightening wedge breakout structure forming just beneath it.
A key moment on the chart is where sellers got trapped during that sharp downside wick. Since then, price has been recovering in a steady, controlled manner.
Now, with higher lows forming and momentum building near resistance, a parabolic move could be on the horizon if price manages to break out cleanly.
This is a classic setup where patience could pay off, the structure is bullish, and breakout confirmation may unlock strong upside potential.
DYOR, NFA

AUD/USD at Critical Resistance — Bearish Outlook Below 0.65381. Major Resistance Zone: 0.65380
Price is currently testing a strong horizontal resistance level at 0.65380, a level that has been tested multiple times (as shown by the pink circles).
This level has acted as a historical turning point, which increases its significance.
2. Price Structure: Lower Highs and Equal Highs
The chart reveals a potential double top or distribution pattern, forming under the 0.65380 resistance.
This suggests weakening bullish momentum and increases the probability of a bearish reversal.
3. Projected Bearish Path (White Dotted Lines):
If price fails to break above 0.65380 decisively, the expected move is a stepwise decline.
The projected path targets several support levels:
0.65003
0.64647
0.64213
0.63957
Final target: 0.63627, a key support from early May.
4. Support & Resistance Zones:
Resistance Levels:
0.65380 (Major)
0.65003
Support Levels (Sequential Targets):
0.64647
0.64213
0.63957
0.63627
5. Confluence with Fundamentals:
U.S. economic events (highlighted at the bottom with calendar icons) may act as volatility triggers, potentially accelerating this move.
✅ Summary & Trading Implications:
Bias: Bearish below 0.65380
Trade Idea: Watch for rejection at resistance or break below 0.65003 for confirmation.
Bearish Targets: Gradual move toward 0.63627 with key pauses at intermediate support levels.
Invalidation: Daily close above 0.65380 would negate the bearish setup and open potential for new highs.

AUD/USD Bearish Setup – Key Rejection🔍 Market Context:
AUD/USD has shown an ascending structure followed by a potential bearish divergence. The recent high around 0.65437 is marked as the Invalidation Level — a break and close above this level would invalidate the current bearish scenario.
📌 Key Levels:
Resistance / Invalidation Zone: 0.65437
Support Target Zone: Near 0.64000
---
📉 Bearish Scenario:
Price is expected to reject the resistance zone and move downward based on the current structure and possible exhaustion of bullish momentum. The red projected path illustrates a potential move lower if price fails to break above the invalidation level.
---
📛 Disclaimer:
This analysis is for educational and informational purposes only. It does not constitute financial advice or a trading recommendation. All trading involves risk. Please conduct your own analysis or consult a financial advisor before making trading decisions.

audusd sell signal. Don't forget about stop-loss.
Write in the comments all your questions and instruments analysis of which you want to see.
Friends, push the like button, write a comment, and share with your mates - that would be the best THANK YOU.
P.S. I personally will open entry if the price will show it according to my strategy.
Always make your analysis before a trade

AUD Bulls Charge on China CPI & Trade HopesOANDA:AUDUSD is trading near 0.6510, buoyed by China’s better-than-expected May CPI print at -0.1% YoY (vs forecast of -0.4%) and optimism over the renewed U.S.-China trade dialogue, which has improved global risk sentiment.
Despite weak CMCMARKETS:AUDUSD Australian Q1 GDP and a narrower trade surplus, the Aussie remains firm as a proxy for Chinese demand and commodity-linked risk appetite.
From a technical perspective, the pair is moving within an ascending hourly channel and is currently testing key resistance at 0.6517. A confirmed breakout could clear the path toward monthly resistance at 0.6582. However, failure to break higher may see a pullback to 0.6492, or deeper to the critical support at 0.6411. As long as the channel structure remains intact, the bias stays bullish.
Resistance : 0.6517 , 0.6582
Support : 0.6492 , 0.6411

AUDUSD LONG FORECAST Q2 W23 D3 Y25👀 AUDUSD LONG FORECAST Q2 W23 D3 Y25
Professional Risk Managers👋
Welcome back to another FRGNT chart update📈
Diving into some Forex setups using predominantly higher time frame order blocks alongside intraday confirmation & breaks of structure.
Let’s see what price action is telling us today! 🔥
💡Here are some trade confluences📝
✅Weekly 50 EMA
✅Daily 50 EMA
✅15’ order block
✅Intraday bullish breaks of structure
🔑 Remember, to participate in trading comes always with a degree of risk, therefore as professional risk managers it remains vital that we stick to our risk management plan as well as our trading strategies.
📈The rest, we leave to the balance of probabilities.
💡Fail to plan. Plan to fail.
🏆It has always been that simple.
❤️Good luck with your trading journey, I shall see you at the very top.
🎯Trade consistent, FRGNT X
audusd sell signal. Don't forget about stop-loss.
Write in the comments all your questions and instruments analysis of which you want to see.
Friends, push the like button, write a comment, and share with your mates - that would be the best THANK YOU.
P.S. I personally will open entry if the price will show it according to my strategy.
Always make your analysis before a trade

AUDUSD Bearish Signal | Technical + Custom AlgoSmart Trend Signal | Technical Analysis + Custom Algorithm
This signal is the result of a combination of classic technical trend analysis and a proprietary software I personally developed.

AUDUSD Bearish Signal | Technical + Custom Algo Smart Trend Signal | Technical Analysis + Custom Algorithm
This signal is the result of a combination of classic technical trend analysis and a proprietary software I personally developed.
The system first identifies market trends purely based on technical indicators — no emotions, no subjective analysis.
Then, a custom-built intelligent algorithm evaluates potential entry and exit points and issues the signal.
This means: a fully data-driven signal, with no guesswork or bias.
📌 Note: This signal is for educational and analytical purposes only. Trading is at your own risk.

AUDUSD Daily Squeeze – Breakout LoadingAUDUSD is pressing against descending trendline resistance, forming a bullish continuation wedge just above the 0.6420–0.6450 support zone (50% Fib level). Price has been consolidating tightly, suggesting a potential breakout setup is developing.
Key Levels:
Resistance: 0.6500 – 0.6547 (wedge top and 61.8% Fib)
Support: 0.6420 (local structure), 0.6300 (deeper demand zone)
Bullish Target: 0.6718 → 0.6900 → 0.6950
Invalidation: Daily close below 0.6410
Scenarios:
🔹 Bullish Breakout
Clean break above wedge resistance
Momentum push toward 0.6700–0.6900 zone
Confirmation = daily close above 0.6547 (Fib confluence)
🔹 Fakeout + Pullback
Temporary rejection leads to retest of 0.6420–0.6400
Holds support = high-probability long setup for second wave up
Outlook:
Bias: Bullish
AUDUSD is building bullish pressure after defending key support. Wedge structure favors breakout continuation, especially if global risk sentiment remains firm and USD softens.

THERE IS POTENTIAL - AUDUSD SHORT FORECAST Q2 W21 D23 Y25AUDUSD SHORT FORECAST Q2 W21 D23 Y25
BE SMART- AWAIT A BREAK OF STRUCTURE FIRST!
Professional Risk Managers👋
Welcome back to another FRGNT chart update📈
Diving into some Forex setups using predominantly higher time frame order blocks alongside confirmation breaks of structure.
Let’s see what price action is telling us today!
💡Here are some trade confluences📝
✅4H Order Block
✅Tokyo ranges to be filled
✅15' order block identified
✅Weekly 50 EMA forecasting rejection
✅Daily 50 EMA target
🔑 Remember, to participate in trading comes always with a degree of risk, therefore as professional risk managers it remains vital that we stick to our risk management plan as well as our trading strategies.
📈The rest, we leave to the balance of probabilities.
💡Fail to plan. Plan to fail.
🏆It has always been that simple.
❤️Good luck with your trading journey, I shall see you at the very top.
🎯Trade consistent, FRGNT X

CAUTION 50'EMA NOT ON SIDE AUDUSD SHORT FORECAST Q2 W21 D22 Y25CAUTION 50'EMA NOT ON SIDE AUDUSD SHORT FORECAST Q2 W21 D22 Y25
Professional Risk Managers👋
Welcome back to another FRGNT chart update📈
Diving into some Forex setups using predominantly higher time frame order blocks alongside confirmation breaks of structure.
Let’s see what price action is telling us today!
💡Here are some trade confluences📝
✅4H Order Block
✅Tokyo ranges to be filled
✅15' order block identified
✅Weekly 50 EMA forecasting rejection
✅Daily 50 EMA target
🔑 Remember, to participate in trading comes always with a degree of risk, therefore as professional risk managers it remains vital that we stick to our risk management plan as well as our trading strategies.
📈The rest, we leave to the balance of probabilities.
💡Fail to plan. Plan to fail.
🏆It has always been that simple.
❤️Good luck with your trading journey, I shall see you at the very top.
🎯Trade consistent, FRGNT X

audusd sell signal. Don't forget about stop-loss.
Write in the comments all your questions and instruments analysis of which you want to see.
Friends, push the like button, write a comment, and share with your mates - that would be the best THANK YOU.
P.S. I personally will open entry if the price will show it according to my strategy.
Always make your analysis before a trade

Aussie Turns Bullish — All Eyes on RBACMCMARKETS:AUDUSD AUD/USD trades near 0.6448 ahead of the RBA rate decision, where a 25bps cut to 3.85% is widely expected. Technically, a breakout above the falling trendline suggests a potential bullish reversal. Immediate support lies at 0.6422–0.6406. A rejection near minor resistance at 0.6456 could trigger a pullback, while a sustained break above that level may open room for gains beyond 0.6500. Market direction hinges on RBA’s tone and Governor Bullock’s guidance on future easing.
Resistance : 0.6456 , 0.6500
Support : 0.6422 , 0.6406

AUD/USD Analysis TodayAustralia's Unemployment Rate Remained Stable in April 📊
May 15 — Data released by the Australian Bureau of Statistics (ABS) showed that after seasonal adjustment, Australia's unemployment rate stayed steady at 4.1% in April 2025 👏. The trend-based unemployment rate also held firm at 4.1%, matching the adjusted figure from March 📈.
Meanwhile, the AUD/USD is currently showing a strong upward trend 🔥, with continued bullish sentiment and a target price of 0.64800 🎯
⚡️⚡️⚡️ AUDUSD ⚡️⚡️⚡️
🚀 Buy@ 0.64400 - 0.64500
🚀 TP 0.64750 - 0.64800
Accurate signals are updated every day 📈 If you encounter any problems during trading, these signals can serve as your reliable guide 🧭 Feel free to refer to them! I sincerely hope they'll be of great help to you 🌟 👇

AUD)USD) resistance level back down Read The ChaptianSMC Trading point update
Technical analysis for the AUD/USD pair on the 1-hour timeframe. Here's a breakdown of the idea presented:
Key Elements:
1. Resistance Level (0.65000 - 0.65200 area):
Price is approaching this strong resistance zone.
RSI is in the overbought zone (above 70), indicating potential reversal or correction.
2. Expected Price Action:
The chart suggests that price may spike into the resistance area (possibly a liquidity grab).
After hitting resistance, a drop is expected toward the FVG (Fair Value Gap) zone.
3. FVG and Target Zone (~0.64059):
There’s a highlighted Fair Value Gap that may attract price for mitigation.
Target point is near the EMA200 level and inside a previous structure zone.
This area also aligns with the RSI cooling off.
4. Support Level (~0.63600):
Marked as a stronger support area, though the current trade setup doesn't expect price to reach there soon.
5. EMA200 (blue line around 0.64202):
Acts as dynamic support.
Target is slightly below this EMA, potentially a liquidity sweep before a bounce.
Mr SMC Trading point
---
Summary of the Idea:
Bearish bias after a resistance rejection.
Look for short opportunities around the resistance zone (0.6500 area).
Target near 0.6405–0.6420 (FVG + EMA200).
Overbought RSI supports this pullback expectation.
Pelas support boost 🚀 analysis follow)
