Audusdshort

AUDUSD - Bearish price action ✅Hello traders!
‼️ This is my perspective on AUDUSD.
Technical analysis: Here we are in a bearish market structure from daily perspective, so I am looking for shorts. I expect bearish continuation as price rejected from bearish order block. My target is sell stop liquidity and the imbalance lower.
Fundamental analysis: Tomorrow we have news events on USD, will be released final GDP for first quarter of 2023. The forecast for GDP is to remain the same as per last quarter, which means we would not have such big moves in market, however we should look for the results in order to validate our analysis.
Like, comment and subscribe to be in touch with my content!

AUDUSD TRADE IDEA / DAY TRADE / SHORTThis is trade idea for AUDUSD Day Trade
-Sell in FVG 15M or 5M Area with range 0.66924 - 0.66970 according to the confirmation that will occur.
-AUD slips on easing inflation
-Risk Reward 1:2

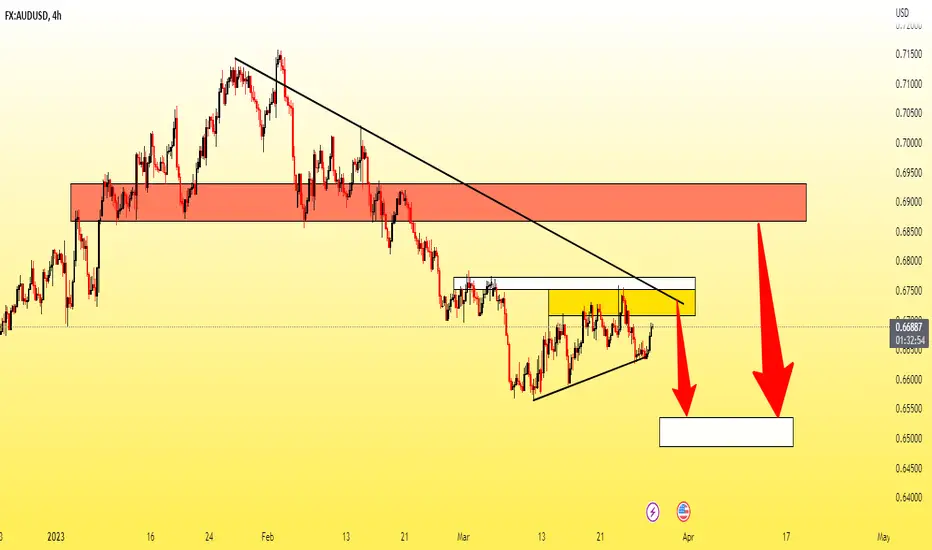
AUDUSD H4Hello traders, AUDUSD is setting up for a downside move, i am waiting for price to enter in a yellow box mentioned area and looking price action there for a short position opportunity but if things doesn't go that i wanted and price break the previous lower high then i will be watching the red box resistance area for a next short opportunity.
This is just analysis, not a proven trading system that would work a 100%
maybe 100% work in something but in trading this sounds like unusual.
i wish you good luck and good trading.
AUDUSD is setting up for a longHi there,
AUDUSD is completing the last wave down for another sharp move up, a retest of the highs will be done soon to decide the trend in Monthly timeframes

AUDUSD H1Here is my view for AUDUSD on H1. The price could go bearish, you can put a pending order on the Order block or find an entry on LTF within OB Zone. Trade Safe!

i see audusd in supply zone I go with short if i find If i Find any confirmation i will go with short this week

AUDUSD SHORTthis strategy is based on E-waves and its published from ADVANCED GET application. AGet is not free but we bought the premium version and we have access to auto E-waves auto drawing indicator.
As you can see the 4th wave is completed and the price is moving to reach 5th wave. FX:AUDUSD

AUDUSD SELLHello Traders, we are Currently going to focus on AUDUSD Sells, Looking at this analysis of mine 100% tells us a lot on price action and also on price movements so let’s patiently wait on price retracement to tap in our my entry zone. Drop a Comment on what you think concerning AU thanks

AUD could retest the March lows if the Fed are not that dovishAUD/USD is hinting at a potential swing high on the daily chart. And if my hunch that the Fed won’t be as dovish as market pricing currently suggest, it leaves room for USD strength and a lower Aussie.
AUD/USD seems to have completed a 3-wave retracement which perfectly respected a 38.2% Fibonacci ratio. Our bias remains bearish beneath the cycle highs, and we anticipate a move back to the March lows should the Fed stick to their hawkish guns, given the RBA delivered a dovish hike and dovish minutes this month.

AUDUSD BuyThe Australian dollar is slightly stronger this morning when valued against the Greenback. The Australian dollar jumped to an overnight high of 0.6758, after the Federal Reserve decision. It is testing the critical resistance zone around 0.6760, amid the broad-based Dollar’s weakness. Yesterday, investors looked past the Reserve Bank of Australia’s (RBA) hint of a rate pause as the prevalent selling bias around the US Dollar (USD) turns out to be a key factor that assists the AUD/USD pair to regain positive traction. It is worth recalling that the minutes of the RBA meeting held on March 7 revealed a step down in hawkishness as policymakers only considered a 25 bps hike and agreed to revisit the case for a pause at the April meeting amid the uncertain economic outlook. Looking ahead today and we will see the release of the Conference Board Leading Index a combination of 7 economic indicators related to money supply, building approvals, profits, exports, inventories, and interest rate spreads. Finally, on Friday we will see the release of the Purchasing Managers’ Index (PMI), a survey of about 400 purchasing managers, which asks respondents to rate the relative level of business conditions including employment, production, new orders, prices, supplier deliveries, and inventories.
AUDUSD h1 price is sideways in the 0.6670-0.6730 zone. Today it is possible that the pair will move up to the 0.6730 resistance area once again. Recommended buy to current price 0.6692, SL: 0.6660, TP: 0.6730

AUDUSD H4 SellGiven AUDUSD H4 chart show a triple top chart pattern,
Then to sell AUDUSD for close to 3:1 reward-risk ratio.

AUDUSD SHORTRetest of the broken trendline and price respecting our supply zone is the reason im jumping in for a sell.

#AUDUSD- SELL 200 PIPS ACCURATE SETUPDear Traders, we have an excellent selling opportunity for AUDUSD and it is an intraday setup, let's catch the big move!!

Bullish reversal for AUDUSDPrice has made a bearish divergence. Head & Shoulder has formed as a clear indicator of trend reversal. If the price breaks the neckline it will be trend reversal.

AUDUSD Trading Plan - 20/Mar/2023Hello Traders,
Hope you all are doing good!!
I expect AUDUSD to go Down after finishing the correction.
Look for your SELL setups.
Please follow me and like if you agree or this idea helps you out in your trading plan.
Disclaimer: This is just an idea. Please do your own analysis before opening a position. Always use SL & proper risk management.
Market can evolve anytime, hence, always do your analysis and learn trade management before following any idea.

UPDATE AUD/USD Almost hit take profit now final stretch SMCAUDUSD formed a Rising Flag and broke below.
We then had price declining on a decent 45 degree slope showing the supply side was strong.
We had peripherals showing downside such as 21 >7 - Bearish RSI < 50 - Bearish
Target 0.6500
The target is still on as now there is a small Rising Pennant forming which we can expect to break to the downside.
SMC (Smart Money Concept)
Where the most recent low was you can see it is one of the strong levels of liquidity (supports). This formed an order block which swept shorters stop losses before going up. I think this upside is short lived and we'lll get one more push to the downside to sweep more liquidity which will get us out of the short.
However, it's not a bad idea to take some profits off the table and move stop to breakeven at this stage.

AUDUSD BuyAUD/USD remains mildly bid above 0.6700, around 0.6715 by the press time, as upbeat comments from the Reserve Bank of Australia (RBA) Official joins the market’s cautious optimism over the UBS-Credit Suisse deal during early Monday. However, fears of more banking sector rout and anxiety ahead of this week’s top-tier data/events probe the Aussie pair buyers of late.
Christopher Kent, Assistant Governor (Financial Markets), gave a speech on "Long and Variable Monetary Policy Lags" at the KangaNews Debt Capital Market Summit, in Sydney, early Monday morning in Asia-Pacific. The policymaker initially followed the suit of global central bankers while trying to rule out fears of the US and European banking sector fallout. More importantly, RBA’s Kent said that RBA is very conscious of the challenges facing borrowers from rapid rate rises.
AUDUSD main trend is still bullish. Currently on the h1 chart the price is consolidating and waiting for a breakout. Recommended to wait to buy around 0.6690, SL: 0.6660, TP: 0.6760

AUDUSD potentional ShortHey Guys, we are also monitoring AUDUSD for a SELL opportunity around 0.67500 zone. If the zone will hold, take a short. Lets see tomorrow.

AUDUSD analysis DAYBroke the trendline and making a move downwards. Price will find resistance and continue down to TP1: 0.62748 and TP2: 0.61941.


AUDUSDAUDUSD has been examined in different dimensions:
1- Strong supply and demand levels that I identify with my own indicator and system.
2- The structure of recently formed waves
3- Current market momentum
4- The structure of classical and price patterns
In this idea, I identified the direction of the market in different ways and in the second step, I analyzed the potential of continuation or reversal. Usually, paying attention to the trend and strength of the trend can greatly increase the accuracy of the analysis.
In general, I tried to describe the continuation of the movement in the simplest possible way in the diagram.
⚠️ Disclaimer:
This is a personal opinion and you are responsible for any trading decisions.

AUDUSD BuyThe Australian dollar trended upward through trade on Thursday as market sentiment improved following reports Credit Suisse will access as much as 50 billion Swiss Franc as a liquidity backstop. Having slipped below US$0.66 on Wednesday the AUD climbed steadily pushing back through US$0.6650 to mark intraday highs at US$0.6665. Better than anticipated domestic employment data helped underpin the AUD and AU rates as the market sought to price future rate adjustments. The events of the last week have dramatically changed the monetary policy landscape with analyst now expecting just one more rate hike before entertaining the possibility of rate cuts. With financial markets still absorbing this last shock price action will continue to be driven by offshore volatility. A sustained improvement in sentiment could help lift the AUD back through 0.67, although we anticipate markets will sideline major bets until after next weeks Fed Policy meeting. With US rate expectations tempered markets will be keenly attuned to the Fed’s response to this latest banking crisis.
AUDUSD h1 price is accumulating for a short period of time waiting to be discovered. Today, it is possible that the pair will go to the 0.6700 resistance area. Recommended to buy at current short price 0.6663, SL: 0.6630, TP: 0.6700
