AUDUSD BUY STOP AUDUSD BUY STOP
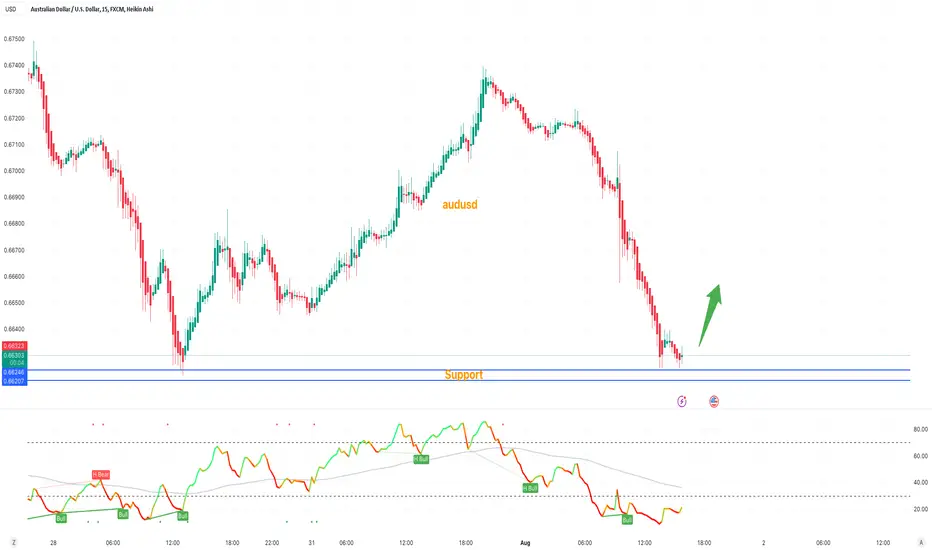
Entry point :- 0.65730
Stop lose :- 0.64953
Target 1 :- 0.6651
Target 2 :- 0.6728
Target 3 :- 0.6806
Target 4 :- 0.6884
Target 5 :- 0.6961
Audusdsignal

AUDUSD Signal 7Aug2023I have noticed a correction in the H1 timeframe. The most recent HH was unable to reach the SND area, resulting in a FTR (Failed to Return) and a subsequent drop in corrected prices. For this AUDUSD analysis, we can set up a buy limit in the SND area with a ratio of RR reaching 1:6. It is important to use a good MM.

AUDUSD Analysis 7Aug2023There was a slight change in the position of Elliot's notation compared to last week's analysis. If you see a pattern that resembles a bullish falling wedge, then the possibility of the current Wave correction is at the end of the period and will enter the beginning of the bullish again. This analysis of crows when the price drops more than the invalid area

DeGRAM | AUDUSD structure based tradeAUDUSD is near the major support level on the 4 hourly chart. It's consolidating on the daily chart.
Price action rebounded from this level twice. Price action is printing a potential double bottom at support.
There's a high chance that price bounces off the support if price creates a false break because we have a psychological level 0.6500.
-------------------
Share your opinion in the comments and support the idea with like. Thanks for your support!

A Short Trader May get happy today, on this AUD pair! {07/08/23}Educational Analysis says AUDUSD may go Short according to my technical.
This is not an entry signal. I have no concerns with your profit and loss from this analysis.
Why long?
Because AUDUSD respects an uptrend line facing down line on a 4-hour time frame.
The market is bearish but a strong AUD may change its direction and start a new trend soon.
The black line is the Order block
The RED line is high and low at the current price.
I HAVE NO CONCERNS WITH YOUR PROFIT OR LOSS,
Happy trading, FX Dollars.

AUDUSD Analysis. Some fakeouts. SignalHello Everyone. I want share my idea about AUDUSD.
In my last idea i detected many false brake outs, after that we still have it. i was longing this pair and still in position.
next week i will try long this pair and here is reason why.
Institutional made lot of brake outs long side but 0.689 LVL was interested for them. From 0.689 point we saw some slow bearish movements, i think they made this brake outs for filter people. I am longing next week this pair because on us dollar index broke weekly support which was strong, last week came for retest that and i think there will be strong sellers than buyers. dollar will continue bearish trend and AUD will rise versus dollar (i have us dollar index analysis which i will link in this idea).
I have 3 scene for this pair price movement.
1 Bullish - price has strong reaction on Fibonacci at levels, brake weak resistance at 0.678, then brake strong 0.689 LVL, price going up and test 0.71 weekly resistance.
2 Bearish - Price is not strong at fibonacci levels coming down and brake strong support at 0.6588.
3 Fake movement - price show us not strong at fibonacci levels coming down, making liquidity swing at 0.6588 support area and then starting bullish trend which test weekly resistance at 0.71.
If i want win this trade i need good risk management and and less risk reward. my stop will be below 0.6588 LVL.
Be patient!!

AUDUSD long now Trade is active {31/07/2023}Trade is Active at
Long at - 0.66430
Stop loss at - 0.66210
Take profit at - 0.68800
I am linking this chart to the previous analysis for better understanding.
This chart is updated one of the last analysis i had done it.

AUDUSD Prediction H1Here is my analysis for AUDUSD on H1 using Order Block. The price could go bearish, you can put a pending order on the Order block or find an entry on LTF within OB Zone. Trade Safe!

DeGRAM | AUDUSD trend continuation opportunityAUDUSD broke and closed below the resistance and fibo levels.
The price is likely to rebound from the resistance zone since it is in the descending channel.
Most likely, the market will pullback above the psychological level at 0.66000 and then continue trending down.
The market is bearish, and we expect a bearish move.
-------------------
Share your opinion in the comments and support the idea with a like. Thanks for your support!

AUDUSD Trade PlanAUDUSD testing strong support area again, let's wait if support breaks or resist from the area.
Manage your risk according to account size!
EURUSD and AUDUSD Top-down analysis Hello traders, this is a complete multiple timeframe analysis of this pair. We see could find significant trading opportunities as per analysis upon price action confirmation we may take this trade. Smash the like button if you find value in this analysis and drop a comment if you have any questions or let me know which pair to cover in my next analysis.

AUDUSD Will Fall!AUD-USD is now trading
Below the supply cluster
Of rising and horizontal
Resistance levels so I am
Bearish biased and a
Move down is to be expected !

AUDUSD Analysis 30July2023If this analysis is true that currently forming Wave C, then the possibility after Wave C is perfectly formed, there will be a fairly high bullish. I prefer to look for opportunities to Long by waiting for some reversal signs that might be formed next week.

AUDUSD BullishOn Thursday, DXY was become stronger and put AUDUSD down, but If you look on the chart, we can see huge Bearish candle which is abnormal as compared to another candle. I believe AUDUSD may rise more. Every support is an opportunity to buy.

AUD USD LONGRisk 0.5%
TP1 = 1:2 RR
RISKY Trade as we are going aginst the trend.
Is willing to see how it turns out.
Disclaimer:
The contents in this Idea are intended for information purpose only and do not constitute investment recommendation or advice. Nor are they used to promote any specific products or services. They serve as an integral part of a case study to demonstrate fundamental concepts in risk management under given market scenarios. A full version of the disclaimer is available in our profile description.

Potential swing trade long on AUD/USD 1-hour chartAUD/USD pulled back for a second day on Monday thanks to weak data from China and rising geopolitical tensions as Russia have backed to of a key gain deal. Support was found around the weekly pivot point, RBA ‘pause’ high and 38.2% Fibonacci retracement level, and the subsequent rally suggests a swing low is in place.
The RBA minutes are due in ~2 hours, and we’d welcome any pullback towards 68c which could help improve the potential reward to risk ratio for longs. Of course, if the minutes are as dovish as hoped then AUD runs the risk of breaking beneath yesterday’s low and invalidating the near-term bullish bias.
But we suspect the minutes may be a little more hawkish than liked, which leaves the potential for it to pop higher. We have a target near the upper 1-day implied volatility band around 0.6850.

AUDUSD Analysis 24July2023If you see this, a double top can occur and the current price forms a bearish channel pattern. Added with Elliot Wave notation, the possibility that happens is in the A-B-C correction period. Find an opportunity for short when the price is corrected bullish approaching the trendline

AUDUSD Analysis H1Here is my analysis for AUDUSD on H1 using Order Block. The price could go bearish, you can put a pending order on the Order block or find an entry on LTF within OB Zone. Trade Safe!

AUDUSD BUY IDEASeems like price need to fill that void to make a retracement before going and continiung to the downside

AUDUSD Gold Next Possible MovePair : AUDUSD ( Australian Dollar / U.S Dollar )
Description :
Bearish Channel in STF as an Corrective Pattern
Break of Structure
RSI - Divergence
Completed " 1234 " Impulsive Wave
Demand Zone

AUDUSD- 21/07/2023 UPDATE❤️Dear traders ,following our last setup on AUDUSD we now have a second entry which we can maximise for another 200 pips or more.

AUDUSD long term forecastAUDUSD, in the long run, is going to be one hell of a ride
Why? You may ask, while things look pretty straightforward at the moment, price doesn't always go as planned. Especially when trading on the lower time frame. However, for those who utilize the H1, H4, and even daily timeframe, this should be a good wave to ride.
First post here, will be offering more as time goes on.

32,600 Jobs Added! Aussie Dollar Skyrockets!The Australian dollar has surged, driven by an impressive employment report that far exceeded expectations. In the month of June, Australia's net employment rose by a staggering 32,600 compared to the previous month, surpassing estimates by more than double.
This development propelled the Aussie currency up by over 0.9%, reaching an intra-day high of $0.6834. The New Zealand dollar also rode the wave, gaining 0.57% to reach $0.6299. Both Antipodean currencies are now poised to reverse the losses incurred over four consecutive trading sessions.
The current market sentiment favors the bulls, with both short and long-term momentum in their favor. Price action is trading above the 50 and 200-day moving averages, reinforcing the positive outlook for the Australian dollar.
Elsewhere in the currency market, the sterling is doing its best to counter deep losses following a sharp fall in the previous session. The decline was prompted by Britain's inflation data, which fell short of market expectations.
The British pound managed a modest recovery, trading 0.15% higher at $1.2958 in the latest session.
